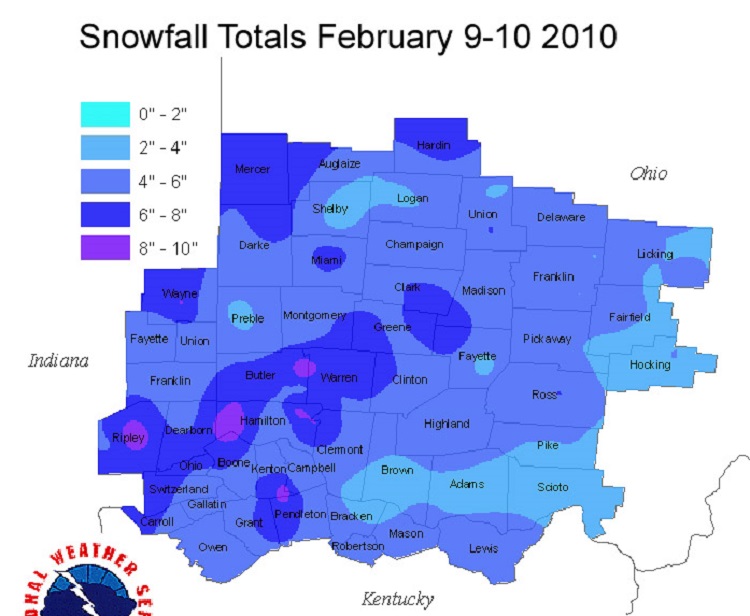
February 2010’s second snowstorm came just 3 days after the month’s first major event. This second low pressure system tracked from Louisville, Kentucky and then up along I-71 to Cleveland. Even though the track was through the heart of the state, the majority of the precipitation in most areas was snowfall. This storm followed so closely on the heels of the February 5th storm that the cold air that first storm had pulled into Ohio was still in place on the 9th. This allowed for snow despite the far north track. While the February 9-10, 2010 snowstorm wasn’t the largest of the month, it helped establish it as one of the snowiest winter months in history.
Snow began in Columbus in the early morning hours of the 9th and continued into the 10th. Snowfall rates reached their peak in the late morning hours of the 9th, falling at 1/2″ per hour at times, but never quite reached the intensities of Storm #1. While some parts of the state had 7-8″, the Columbus area had 5-6″, about half of what it got in Storm #1. Still, cleanup from the first storm was still ongoing, and this latest snowfall severely complicated the process. Traffic and airport delays were common, and many schools were cancelled. Snow depths in Franklin County reached 10-16″ after the storm.
A lot of requests for zip code data come into this site, so I thought it might be a good idea to provide some.
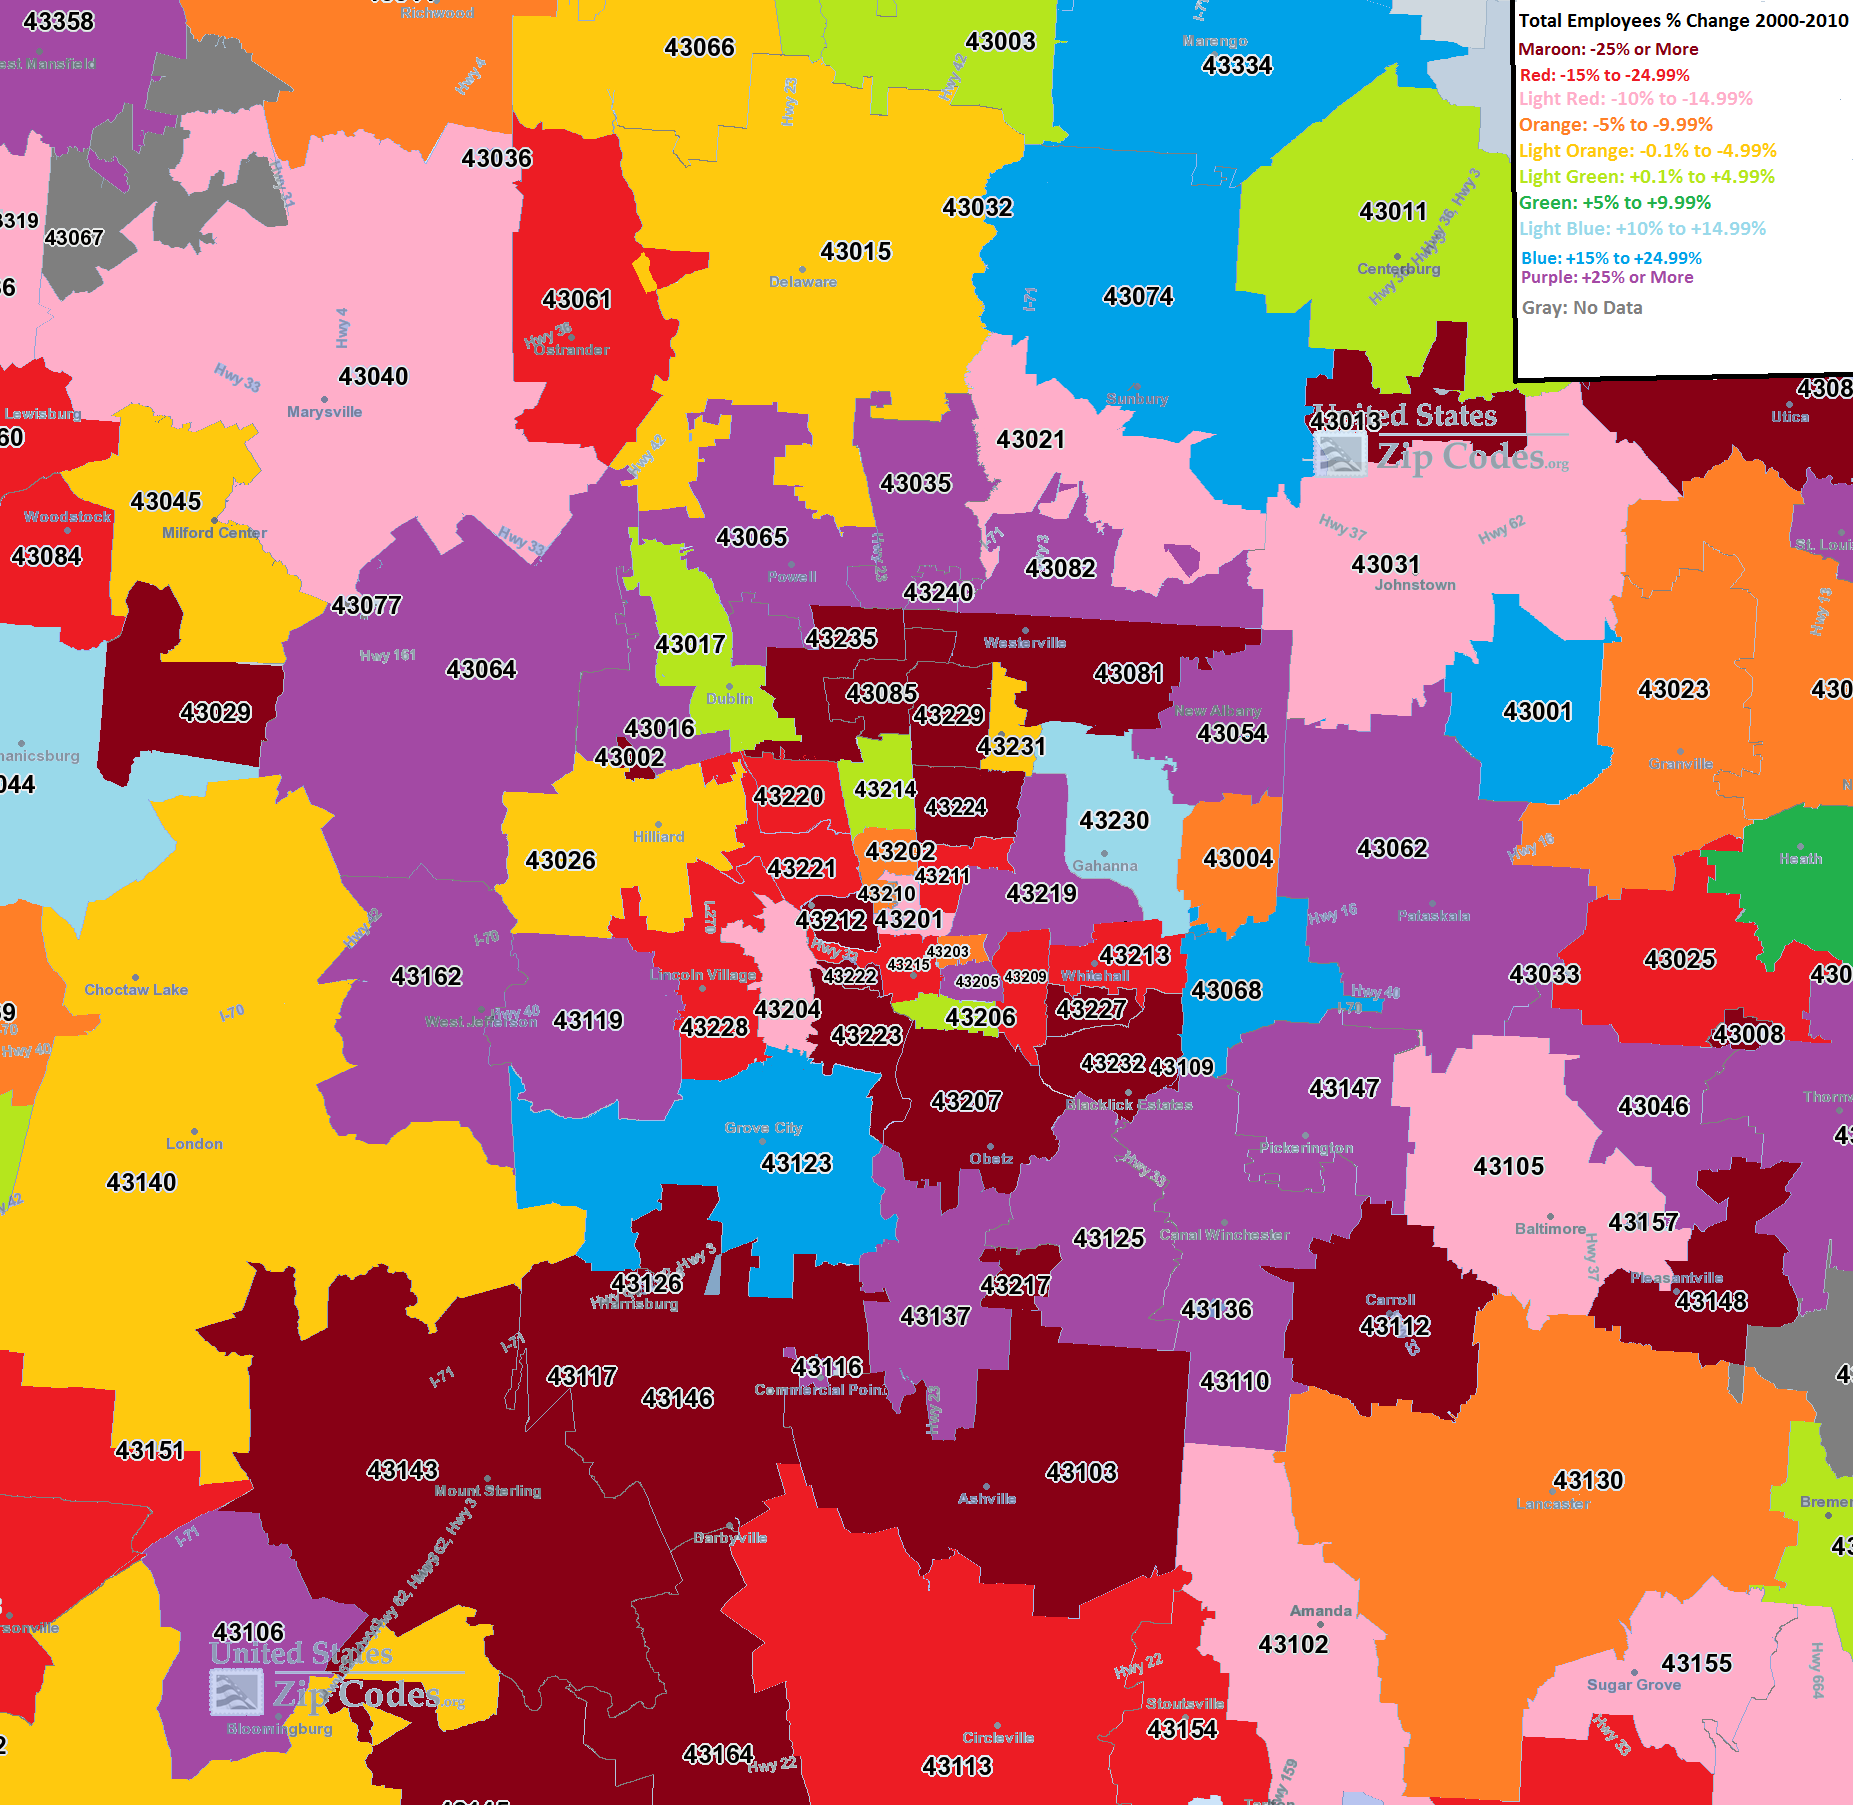
First, we have a map for the Columbus area that includes the % of of employees in a particular zip code from 2000-2010.
From this map, the urban areas of Columbus seem to have lost the most % of their employees the last decade, along with the far suburban and rural areas. The biggest growth was in the areas along and just outside of 270. This is an interesting map as it implies that the nearest suburban areas are attracting the most jobs, but that these suburbs are are both pulling from the inner core, but also from much further out.
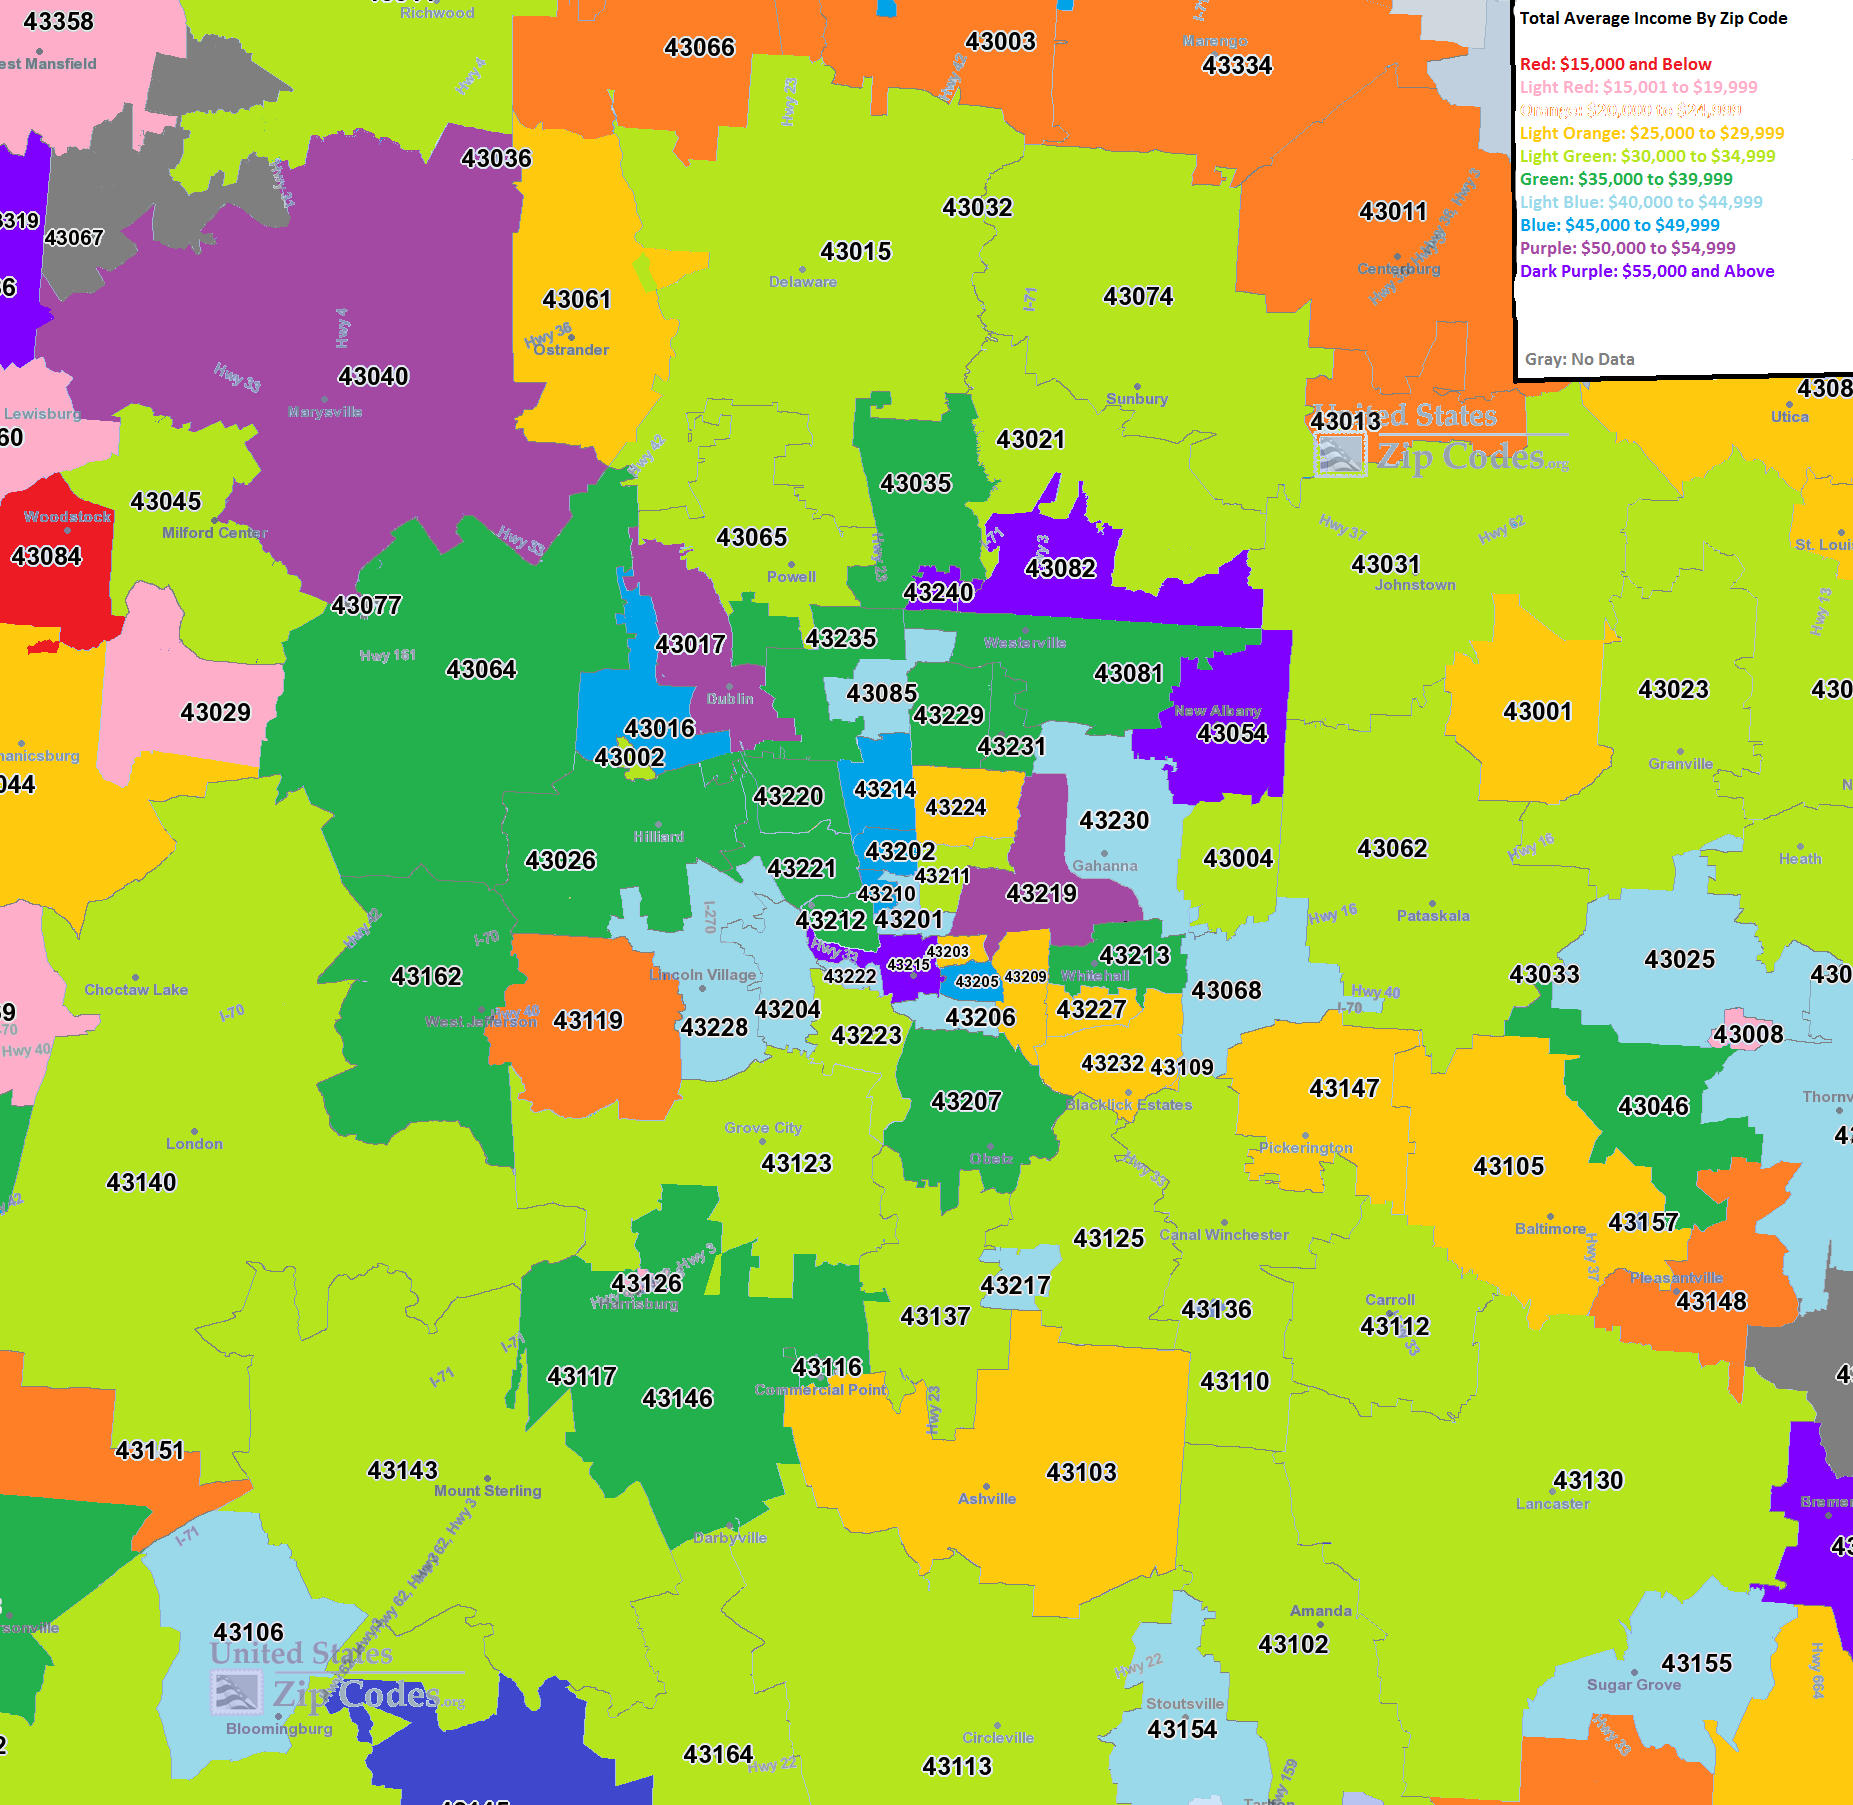
The second map is for average employee income by zip code.
What this map seems to show is that, while jobs may be moving to the I-270 suburbs, pay for those jobs is decidedly mixed across the city. Downtown, for example, averaged some of the highest incomes in the city. Other strong areas include parts of Westerville, New Albany and Dublin. Most of the High Street corridor was fairly strong as well. The lowest incomes were almost entirely in rural and far suburban areas.
Finally, the % change of average income from 2000-2010.
This map is also a mixed bag. Most of the area saw wage growth, but where it occurred the strongest was definitely all over the map. Some suburbs had good and bad, and so did the urban core areas.
So what’s all this mean? Well, certainly it means that the total # of jobs as far as growth shifted to the 270 suburbs the last decade, but at the same time, those jobs that remained in the core areas still grew in income. So it appears that the city is becoming richer about on par with the suburbs, at least the last 10 years. The question becomes, what happens the next decade? If urban trends continue the way they have the past few years (which these maps don’t really take into account), it is entirely possible that some of the job growth will move back inward towards the urban core.
To continue with local and national economic data, the US’ Bureau of Economic Analysis gives the option to look at cities, metro areas and other levels. Zip Code Maps gives population and demographic data in an interactive format.
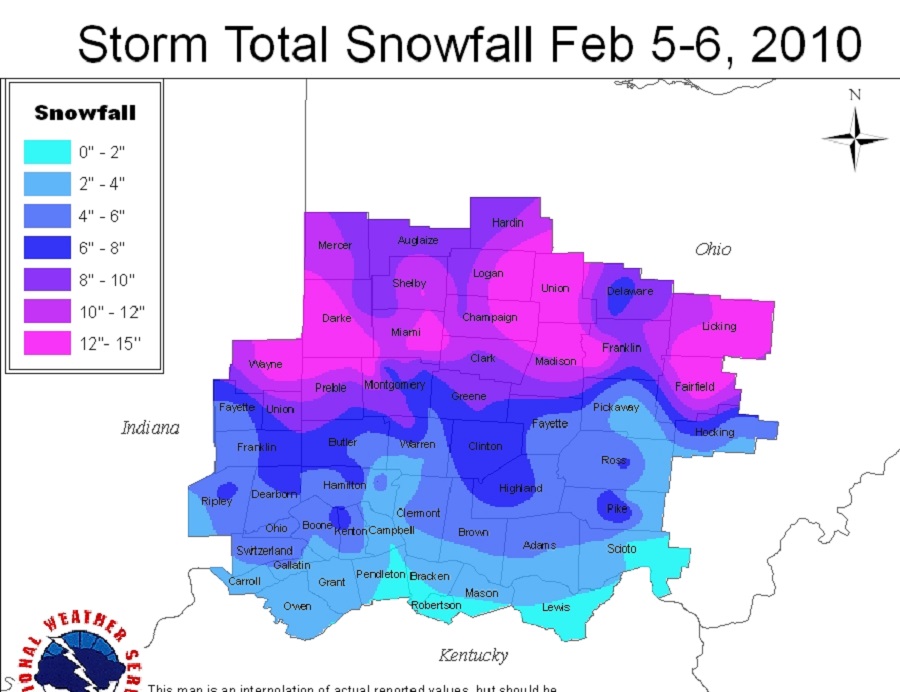
The winter of 2009-2010 will go down as one of the best ever (if you like winter, that is). The biggest reason for that is February 2010 and its cascade of significant winter storms that placed the month as one of the snowiest of all time. The February 5-6, 2010 snowstorm event was one of the capping events of the month and winter as a whole.
The first event started in the morning on February 5th. Forecasts in the days leading up to this event were mixed. Models were showing a lot of precipitation, but also a strong push of upper-level warm air into Ohio. How far north this warm layer reached was the point of contention. In most years, the WTOD, or the “Warm Tongue of Death” as some Ohio weather enthusiasts like to refer to it, is a constant threat each and every winter. When a storm is moving north or northeast south of the state, they tend to pull warm air north, and the Appalachian Mountains act like a funnel directing this warm air straight into Ohio. During winter events, it presents itself as a layer of warm air above the surface, often turning snow to ice, sleet or just plain rain, even if the surface itself is relatively cold. It’s a constant source of frustration for winter weather lovers. It was this phenomenon that was predicted to strike again and the dividing line, as it so often is, was predicted to be along I-70/I-71. North of there, mostly or all snow was predicted, while south was more mix, ice and rain. The I-70 corridor, including Columbus, was to be the northern extent of this mixing, limiting snowfall accumulations. Still, even with the mix predicted, a solid 4″-6″ was predicted, which is a decent event by itself and typically the largest snow event of any given winter.
Precipitation began as snow across southern counties by dawn and spread north, reaching the Columbus area between 9AM and 9:30AM. It started out as flurries, but the flakes were already fairly large. Within 15 minutes, the flurries had turned to very heavy, wet snow. Flakes were as large as quarters at times and stayed large, accumulating quickly despite the above freezing temperatures. Visibility quickly dropped to a half mile or less at times, and traffic quickly snarled with accidents as plows could not keep up with the pace of the inch-per-hour snowfall rates. Between 4PM and 5PM, there was a respite as snowfall lightened and there was a mix of sleet and ice pellets, but all snow resumed once heavier precipitation moved in, concluding the only and very short period of mixing I-70 had. Snow continued through the night of the 5th and into the 6th, finally ending before noon.
Snowfall totals were impressive, especially along and north of I-70, where little mixing took place, but also in pockets to the southeast of Columbus, like Lancaster. For Columbus, the 9.9″ that fell was good enough to be a top 15 largest snowstorm for the city. It would not, however, be the largest snowfall of the month.
Some snow totals across Ohio from February 5-6, 2010 Greenville: 14.8″ Lancaster: 13.0″ Akron: 12.1″ Bellefontaine: 12.0″ Urbana: 12.0″ Westerville: 11.4″ Dayton: 11.1″ Springfield: 11.0″ Columbus: 9.9″ Youngstown: 8.4″ Delaware: 8.0″ Cleveland: 5.9″ Cincinnati: 4.5″ Circleville: 3.0″ Toledo: 3.0″
Snow totals for the NWS Wilmington area.
This event was the only the beginning of what would be a trio of consecutive snowstorms that would strike the area over the course of 11 days, including the February 9-10, 2010 Snowstorm, which occurred just a few days later.
I have a lot of new additions planned for February. I will continue the ongoing updates on the new Census Tract Data page. This project is probably going to take a few months, as there are literally hundreds of census tracts and I plan to present data for each one. I wanted to do this specifically because it’s so difficult to find one site with this information. The US Census has it, but unfortunately it’s separated into invidual census years. Demographics for them are even harder to find. So I hope that those out there, like myself, who love this kind of stuff will find it useful and interesting.
Also, I plan to add a few more catergories to the Demographics Page.
Other than the tract and demographic page updates, I also plan to highlight at least a few individual projects from the past, present and future in regards to development. I will also update the ongoing yearly development list page, as there have been several new projects announced or that I’ve found that need to be added.
I will also be posting February’s weather records as well as a late report on the Blizzard of 1978.
Finally, I will be posting December’s unemployment and jobs report when it is finalized.
And as always, any major news stories about the city or metro will be posted as they show up.
So yeah, definitely a busy month planned with a ton to get done. I may be setting the bar a bit too high!