Columbus poverty, like poverty everywhere else, is not exactly a positive metric. But how does its own rate compare to that of other Ohio cities? The following numbers are based off the American Community Survey. They are estimates, not physical counts like the population census, so there is a definite fudge factor involved with them as to their overall accuracy. 2011 is the latest year available for the ACS estimates.
2011 % of City Population Living in Poverty, Lowest to Highest 1. Columbus: 23.2% 2. Akron: 28.9% 3. Cincinnati: 29.5% 4. Toledo: 30.1% 5. Youngstown: 33.2% 6. Cleveland: 34.3% 7. Dayton: 35.7%
During and just after the recession’s housing crash, single-family home construction in the Columbus area seemed to fall apart, much like it did across the nation. Foreclosure rates soared, prices fell and builders were suddenly left with too many homes they couldn’t get rid of.
Out of the ashes of this market rose a surge in rental demand. It suddenly made more and more sense to rent rather than to own, especially for young professionals and empty nesters who wanted to downsize during tough economic times. Not only did what housing people wanted change, but so did where they wanted it to be located.
Columbus experienced a relative boom in rental housing during the late 1990s into the first few years of the 2000s, but almost all of that rental housing was constructed along and outside of I-270, where the suburbs were exploding with growth. Inside of 270 saw little of this, and the urban core neighborhoods around Downtown were almost completely ignored altogether. Single-family housing became popular again during the early 2000s mild recession, and the housing boom that would help lead to the Great Recession of 2007-2009 really began at that time. However, it was in 2002 that the City and Mayor Coleman came up with a 10-year plan to help bring more residents to Downtown. It began offering tax incentives to developers who would build there, in some cases 100% abatements, in a goal to have 10,000 residential units built in and around Downtown by 2012.
I’ve done a ton of research on the results of this move by the city, and it did have an impact. From what I’ve been able to find (so far), Downtown and the surrounding neighborhoods saw the addition of less than 200 residential units between 2000 and 2002. 2003 saw over 500 alone with the new incentives package in place. Between 2003 and 2006, the area added over 2,000 new residential units, most of them condos. As the Great Recession hit in 2007, the rate of new projects slowed to half of what it was, though still higher than it was prior to 2003.
As the Great Recession eased and more financing became available, construction began to pick up once more. With the new trends in favor of urban living and rentals, the rental market has exploded and overall Columbus residential development is booming across all parts of the city.
Ohio’s most infamous July 4th weather event, occurred in 1969. Severe thunderstorms developed over southeastern Michigan and moved southeastward into the Ohio lakeshore communities around 7:30PM on July 4th. Every lakeshore community from Toledo to Cleveland was affected, as well as areas further inland. The storms continuously trained over the same areas from Lucas to Wayne counties for several hours, dropping torrential rains, tornadoes, high winds, hail and lightning. Rainfall in a 100-mile stretch from just southeast of Toledo into Wayne County totaled 6″-14″. These rains caused record local flooding. All told, the storms of July 4th-5th, 1969 caused $65 million in damage, damaged or destroyed 10,000 homes, 7,000 cars, 104 businesses, 300 mobile homes and more than 700 boats. 41 people were killed and 559 were injured, mostly from flooding. This was the 3rd most damaging flood in Ohio history, behind January 1959 and March 1913. Columbus was too far south to see any of the storms and received just 0.03″ of rain for the period.
The 1810 US Census doesn’t exactly have a lot of information available. The earliest censuses seem to focus more on economic information rather than population and demographics.
In 1810, Ohio had just 36 counties and Columbus had not been founded yet. Franklin County, however, did exist at the time, as well as Franklinton and a few other towns.
Franklin County Cotton Goods Value in Dollars: $6,043 Rank of Ohio’s Counties: 3rd Flaxen Goods Value in Dollars: $13,935 Rank of Ohio’s Counties: 13th Blended and Unnamed Cloths and Stuffs Value in Dollars: $9,927 Rank of Ohio’s Counties: 15th Woolen Goods Value in Dollars: $2,496 Rank of Ohio’s Counties: 13th # of Looms: 150 # of Naileries: 1 # of Tanneries: 5
That’s all I have for now, but if I find more information about the area in 1810, I will add it here.
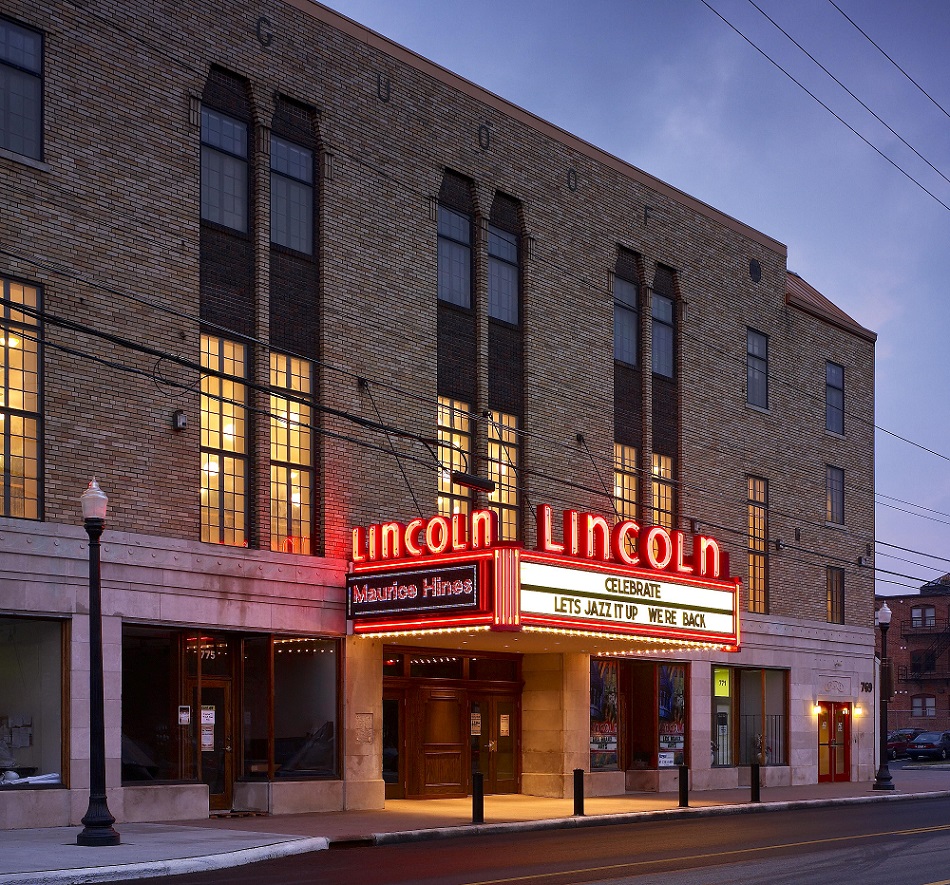
This week is Demographics week. First up, ACD’s second neighborhood profile, featuring the King-Lincoln District, Columbus’ historically African American cultural heart.
I was going to write a history for the area, but this video tells it better than I ever could.
History aside, what I can do is provide a more detailed demographic picture from the past, present and possible future of the neighborhood.
Population peaked around 1950, but during the 1950s began its long-term decline. Some might say this was a product of White Flight, but in this case, the neighborhood was already almost entirely non-White. The White Flight movement was more than just about racial demographic changes in neighborhoods, it was a factor of urban neglect. Just like in the rest of urban Columbus, King-Lincoln lost its urban appeal due to infrastructure deterioration, lack of city-focused leadership, decline of schools and increasing crime rates (among other things). One of the biggest blows to the area, just like what occurred with Olde Towne East to its south, was the construction of I-71 in the early 1960s. The highway cut the neighborhood off from Downtown, demolished hundreds of historic buildings, and allowed more people to effectively leave the neighborhood altogether. This is a good reason why the population dropped by almost 35% between 1960 and 1970.
The population loss rate had been slowing down each decade through 2000. During the 2000s, the city cleared out Poindexter Village, one of Columbus’ first public-housing projects and home to several hundred residents. This accounted for a very large chunk of the loss that occurred from 2000-2010 and why the loss increased during that time. The city is now tearing the complex down with plans for mixed-use development on the site. If not for this action by the city, it’s very likely that King-Lincoln would’ve had it’s lowest total population loss since the decline began in the 1950s.
Demographics White 1990: 6.1% 2000: 6.2% 2010: 9.6% Black 1990: 90.7% 2000: 87.7% 2010: 84.0% Asian 1990: 2.4% 2000: 0.7% 2010: 0.5% Hispanic 1990: 0.6% 2000: 1.1% 2010: 2.2% Other 1990: 0.9% 2000: 5.4% 2010: 5.9%
% Change By Demographic for Each Decade 1990-2000 White: -3.7% Black: -8.2% Asian: -71.6% Hispanic: +63.0% Other: +501.4% 2000-2010 White: +24.5% Black: -23.1% Asian: -42.1% Hispanic: +60.2% Other: -11.8% The demographics for the last 30 years show Hispanic and White populations are becoming an ever larger chunk of the neighborhood, while Asians have declined significantly. The African American population is still, by far, the largest demographic, but it too is on a long-term decline. This suggests a gradual gentrification of the neighborhood.
And what of the future of the area? Significant revitalization news has been coming out in recent months. As mentioned above, the 36-building Poindexter Village, long a hot spot for crime and concentrated poverty, is currently in the process of being torn down. The site will be replaced with residential, retail, office and arts space over time. A larger area plan was recently announced here: http://www.columbusunderground.com/pact-plans-165-million-strategic-redevelopment-for-near-east-side. The $165 million plan will focus on King-Lincoln’s main thoroughfares: East Long Street, Mount Vernon Avenue and Taylor Avenue. Increasing density with mixed-use development and revitalizing the commercial corridors is a big part of the plan, as well as infrastructure and green space improvement. Smaller developments include Homeport’s housing renovations, which have been very successful so far.
So while King-Lincoln has seen better days, the neighborhood is currently in transition. 5-10 years from now, the neighborhood should be radically changed, hopefully for the better. Its proximity to Downtown and other central neighborhoods give it a great advantage as the city has become fairly popular again.