Downtown Columbus parking is a problem… in that there is far too much of it. It’s long been common knowledge that Downtown had an abundance of parking lots and garages, but I’ve never seen it actually mapped or counted before. The following Google map shows what’s long been known in a bit more graphic detail.
Red pins are surface parking lots and blue pins are parking garages. I only tried to count surface lots with 10 spaces or more, and they could be city, business or other types of lots. Lots currently being developed were not counted, nor were underground garages.
The final tally? 310 surface lots and 27 garages! Remember that the next time someone says they can’t find somewhere to park Downtown.
Columbus City Unemployment Rate: 6.4% Unemployment Rate Change since June 2012: -0.1 Unemployment Rate Change since January 2013: -0.4 Civilian Labor Force: 438,100 Civilian Labor Force Change since June 2012: +5,000 Civilian Labor Force Change since January 2013: +11,700 Employment: 409,900 Employment Change since June 2012: +5,100 Employment Change since January 2013: +12,600 Unemployment: 28,200 Unemployment Change since June 2012: -100 Unemployment Change since January 2013: -900
Franklin County Unemployment Rate: 6.4% Unemployment Rate Change since June 2012: -0.1 Unemployment Rate Change since January 2013: -0.4 Civilian Labor Force: 640,600 Civilian Labor Force Change since June 2012: +7,400 Civilian Labor Force Change since January 2013: +16,900 Employment: 599,600 Employment Change since June 2012: +7,500 Employment Change since January 2013: +18,600 Unemployment: 41,100 Unemployment Change since June 2012: +0 Unemployment Change since January 2013: -1,500
Columbus Metro Area Unemployment Rate: 6.4% Unemployment Rate Change since June 2012: +0 Unemployment Rate Change since January 2013: -0.6 Civilian Labor Force: 992,617 Civilian Labor Force Change since June 2012: +12,256 Civilian Labor Force Change since January 2013: +24,712 Employment: 929,158 Employment Change since June 2012: +11,636 Employment Change since January 2013: +28,702 Unemployment: 63,459 Unemployment Change since June 2012: +620 Unemployment Change since January 2013: -3,990
Ohio Overall Unemployment Rate: 7.2% Unemployment Rate Change since June 2012: -0.1 Unemployment Rate Change since January 2013 : +0.2 Civilian Labor Force: 5,756,192 Civilian Labor Force Change since June 2012: +9,844 Civilian Labor Force Change since January 2013: +15,900 Employment: 5,343,335 Employment Change since June 2012: +15,079 Employment Change since January 2013: +2,483 Unemployment: 412,857 Unemployment Change since June 2012: -5,235 Unemployment Change since January 2013: +13,417
Metro Non-Farm Jobs Total: 972,400 Change from June 2012: +15,200 Change from January 2013: +28,800
By Industry Mining/Logging/Construction Total: 31,900 Change from June 2012: +1,000 Change from January 2013: +5,000
Manufacturing Total: 67,800 Change from June 2012: +1,400 Change from January 2013: +2,800
Trade/Transportation/Utilities Total: 181,600 Change from June 2012: -700 Change from January 2013: -1,600
Information Total: 16,400 Change from June 2012: -400 Change from January 2013: -100
Financial Activities Total: 71,800 Change from June 2012: +0 Change from January 2013: +100
Professional and Business Services Total: 161,900 Change from June 2012: +3,400 Change from January 2013: +6,300
Education and Health Services Total: 142,800 Change from June 2012: +6,600 Change from January 2013: +3,300
Leisure and Hospitality Total: 102,100 Change from June 2012: +4,700 Change from January 2013: +13,600
Other Services Total: 36,600 Change from June 2012: -500 Change from January 2013: +400
Government Total: 159,500 Change from June 2012: -300 Change from January 2013: -1,000
Overall, June was a pretty good month for Columbus and the state. Unemployment rose, but mostly because the labor force had strong growth, which is a sign of more people entering a recovering job market. Most industries saw job growth both year-over-year and year-to-date.
Ohio State University has been engaged in long-term housing developmentand improvements on its campus for a few years now, and is set to begin the next and largest phase to date.
The first phase along W. 11th Avenue, called the South Campus High Rise Renovation and Addition Project, is nearing completion. The $171 million project began in 2010 and focused on Stradley, Smith, Park, Steeb and Siebert Halls. The residential buildings, which were all constructed between 1957 and 1960, would see major changes.
-New 12-story additions would connect Park with Stradley and Steeb to Smith. -10-story Siebert Hall would receive a major renovation.
Rendering of the additions between Park/Stradley and Steeb/Smith.
In addition to the building additions, air conditioning, new elevators, lobbies and other improvements were made. The air conditioning was provided by drilling 450 geothermal wells. The additions would bring an additional 360 student beds.
Also renovated and added to was the William H. Hall housing complex at W. 11th and Worthington Street. Opened in August 2012, the building added 530 new beds.
The South Campus High Rise Renovation and Addition Project will ultimately add about 900 new student beds, but this is a far cry from the project just beginning along Lane Avenue.
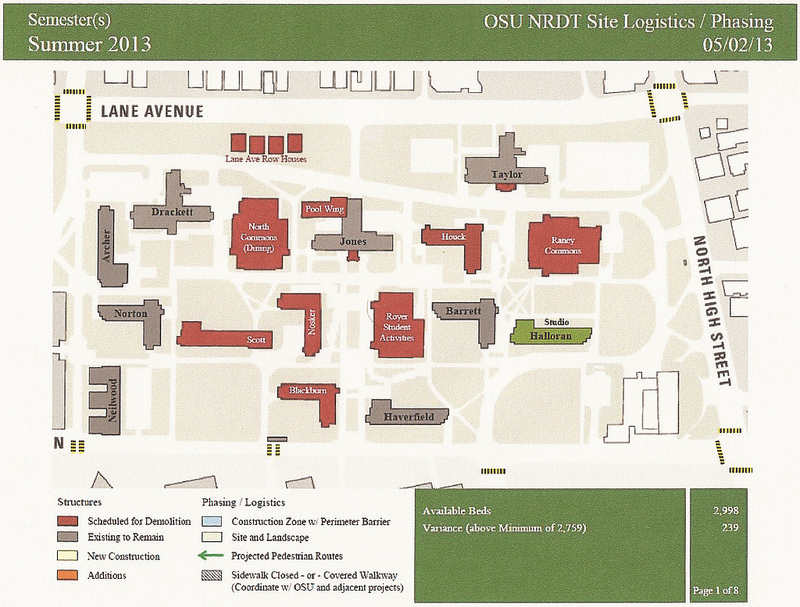
Announced around the same time as SCHRRAP, the North Campus Residential District Project began just this past week. This project focuses on the large cluster of dorms and other buildings at the southwest corner of N. High Street and W. Lane Avenue. Most were built in the 1960s and 1970s and look it.
North Campus in 2013.
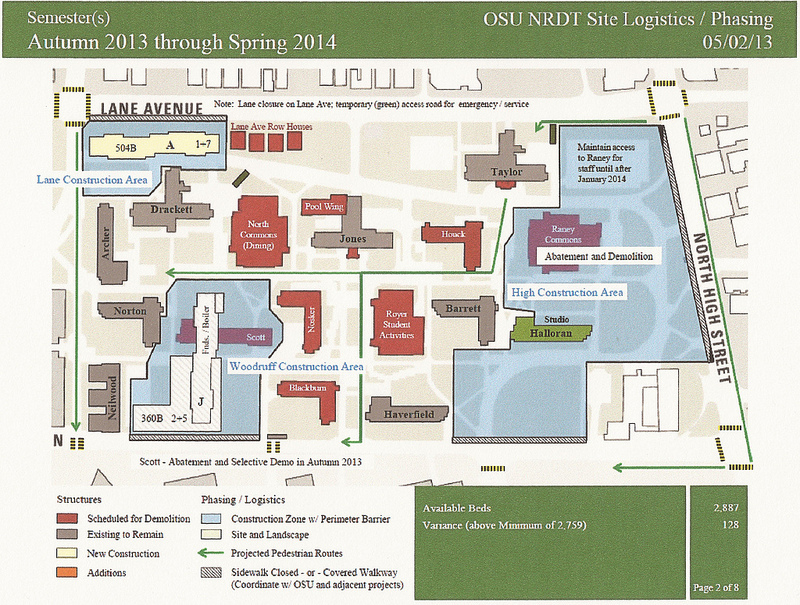
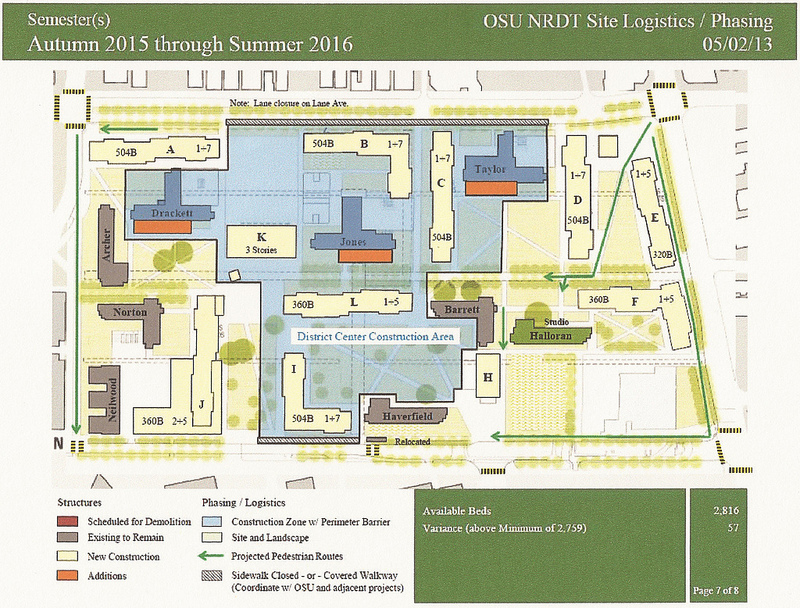
The image above shows how the area looks currently. As the key says, the buildings in red are scheduled to be demolished. The road that goes through the complex, Curl Drive, is also scheduled to be removed. The image above shows the first phases of construction through Spring 2014. As you can see, there will be 3 main areas of construction during this period. -A new dorm will be constructed at the southeast corner of W. Lane and Neil Avenues. This area is currently a surface parking lot. -Scott Hall will be demolished and the site will be replaced with a much larger building. -Raney Commons will be demolished, and site preparation will take place for new buildings, as well as removing Curl Drive and other infrastructure. -Once site preparation is complete, 3 new dorm buildings will be constructed at the corner of N. High and W. Lane. The last image above shows the final phase of construction, from Fall 2015 to Summer 2016. During this period, several changes take place. -4 row homes along W. Lane will be demolished, as well as North Commons, Houck, Blackburn and Nosker Halls, the Royer Student Activities building and the Jones Pool. -5 new buildings will be built in this area, as well as new addtions to Taylor, Jones and Drackett Halls. -A central pedestrian corridor will be completed through the entire complex. -High and Lane will be landscaped, and park spaces will be created throughout.
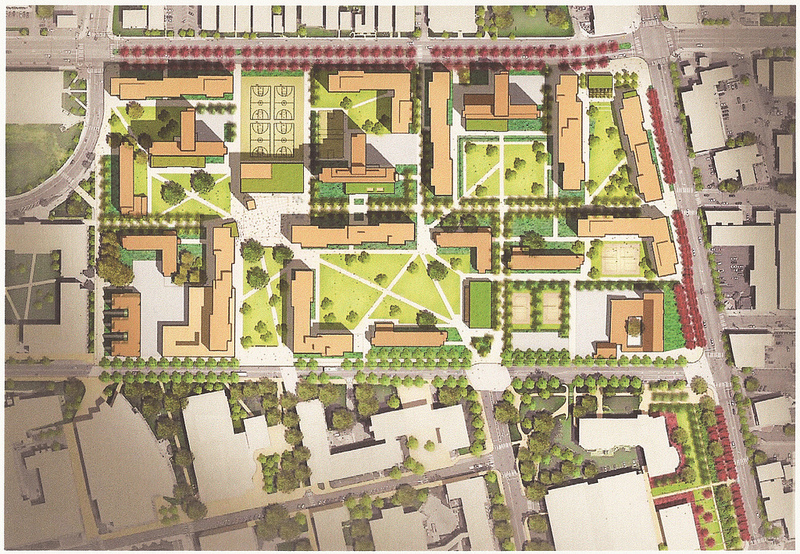
Final rendering.
In the end, 3,200 new beds will be created in the $370 million project. This will drastically change the look and feel of this area, and will continue to add density to the campus area, already Columbus’ most dense.
In this edition of the Columbus Housing Market July 2013, we see from Columbus Realtorsthat the housing market has been pretty white hot, and metro area sales set monthly records in July with an increase over 28%. July also featured the 3rd highest sales of any month on record.
I looked at the 21 major areas of Franklin County (11 urban, 10 suburban). Here is what the July market looked like.
Average # of Days before Sale, July 2013 Urban: 49.8 Suburban: 48.7 Urban without Columbus: 48.8
Average # of Days before Sale, YTD Urban: 64.6 Suburban: 62.3 Urban without Columbus: 64.4
Top 10 Lowest Housing Supplies (based on # of months to sell all listings), July 2013 1. Worthington: 1.9 2. Grandview Heights: 2.4 3. Upper Arlington: 2.4 4. Clintonville: 2.5 5. Hilliard: 2.7 6. Westerville: 2.8 7. Dublin: 3.1 8. Bexley: 3.2 9. Gahanna: 3.6 10. Downtown: 4.0
Average # of Months to Sell All Listings Urban: 3.7 Suburban: 4.2 Urban without Columbus: 3.6
Average % Change of Single-Family Home Sales, July 2013 vs. July 2012 Urban: +55.0% Suburban: +33.4% Urban without Columbus: +58.0%
Average % Change of Condo Sales, July 2013 vs. July 2012 Urban: +78.4% Suburban: +89.0% Urban without Columbus: +82.3%
Average % Change of Single-Family Home Sales YTD vs. YTD 2012 Urban: +14.4% Suburban: +28.5% Urban without Columbus: +13.0%
Average % Change of Condo Sales YTD vs. YTD 2012 Urban: +42.8% Suburban: +32.7% Urban without Columbus: +44.0%
Seems like most areas are doing fairly well, including the urban core. Of course, these number do not measure rentals, which is what is really booming right now in the residential scene.
Columbus City Unemployment Rate: 6.0% Unemployment Rate Change since May 2012: +0 Unemployment Rate Change since January 2013: -0.8 Civilian Labor Force: 431,500 Civilian Labor Force Change since May 2012: +3,600 Civilian Labor Force Change since January 2013: +5,100 Employment: 405,500 Employment Change since May 2012: +3,400 Employment Change since January 2013: +8,200 Unemployment: 26,000 Unemployment Change since May 2012: +100 Unemployment Change since January 2013: -3,100
Franklin County Unemployment Rate: 6.0% Unemployment Rate Change since May 2012: +0 Unemployment Rate Change since January 2013: -0.8 Civilian Labor Force: 631,000 Civilian Labor Force Change since May 2012: +5,300 Civilian Labor Force Change since January 2013: +7,300 Employment: 593,100 Employment Change since May 2012: +5,100 Employment Change since January 2013: +12,100 Unemployment: 37,900 Unemployment Change since May 2012: +200 Unemployment Change since January 2013: -4,700
Columbus Metro Area Unemployment Rate: 6.0% Unemployment Rate Change since May 2012: +0.1 Unemployment Rate Change since January 2013: -1.0 Civilian Labor Force: 977,400 Civilian Labor Force Change since May 2012: +8,600 Civilian Labor Force Change since January 2013: +9,500 Employment: 919,100 Employment Change since May 2012: +7,800 Employment Change since January 2013: +18,600 Unemployment: 58,300 Unemployment Change since May 2012: +800 Unemployment Change since January 2013: -9,100
Ohio Overall Unemployment Rate: 7.0% Unemployment Rate Change since May 2012: -0.3 Unemployment Rate Change since January 2013 : +0 Civilian Labor Force: 5,750,000 Civilian Labor Force Change since May 2012: -5,000 Civilian Labor Force Change since January 2013: +10,000 Employment: 5,345,000 Employment Change since May 2012: +9,000 Employment Change since January 2013: +4,000 Unemployment: 405,000 Unemployment Change since May 2012: -15,000 Unemployment Change since January 2013: +6,000
Metro Non-Farm Jobs Total: 966,900 Change from May 2012: +12,200 Change from January 2013: +23,300
By Industry Mining/Logging/Construction Total: 30,600 Change from May 2012: +500 Change from January 2013: +3,700
Manufacturing Total: 66,600 Change from May 2012: +600 Change from January 2013: +1,600
Trade/Transportation/Utilities Total: 180,700 Change from May 2012: -1,200 Change from January 2013: -2,500
Information Total: 16,400 Change from May 2012: -200 Change from January 2013: -100
Financial Activities Total: 71,300 Change from May 2012: -200 Change from January 2013: -400
Professional and Business Services Total: 161,000 Change from May 2012: +1,100 Change from January 2013: +5,400
Education and Health Services Total: 142,600 Change from May 2012: +4,500 Change from January 2013: +3,100
Leisure and Hospitality Total: 99,700 Change from May 2012: +4,900 Change from January 2013: +11,200
Other Services Total: 35,800 Change from May 2012: -600 Change from January 2013: -400
Government Total: 162,200 Change from May 2012: -200 Change from January 2013: +1,700