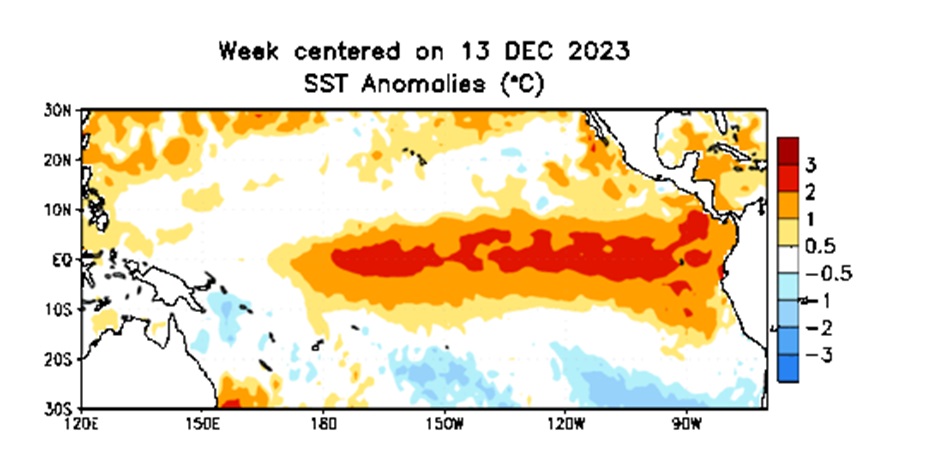
The Winter 2023-2024 review is finally here, and it shows that yet another cold season never really showed up. 2023-2024 was a top 5 warmest winter on record. Outside of a short break in January, warmth persisted for almost the entire winter, likely courtesy of the strong El Niño. This contributed to well below normal snowfall.
The below stats represent both the traditional winter season of December-February, and also the overall cold season of October-April. Rankings are accurate as to the time of the posting.
December-February
Traditional winter numbers, 1991-2020 departures from normal where relevant, and overall winter rankings.
Average High: 45.7 (+5.9) 5th Warmest
Average Low: 30.2 (+5.7) 6th Warmest
Mean: 37.9 (+5.7) 5th Warmest
Coldest High: 16 on January 15th and 16th
Coldest Low: 6 on January 15th and 20th
Coldest Mean: 11 on January 15th
# of 32 or Below Highs: 9 (-16.8) Tied for 4th Fewest
# of 32 or Below Lows: 53 (-15.8) 5th Fewest
Warmest High: 67 on February 26th and 27th
Warmest Low: 56 on February 27th
Warmest Mean: 62 on February 27th
Precipitation: 9.29″ (+0.75″) 38th Wettest
Snowfall: 12.4″ (-9.8″) 37th Least Snowiest
Average Daily Snow Depth: 0.2″ (-0.6″) Tied for 3rd Lowest
Maximum Snow Depth: 4″ on February 17th
Largest Snowstorm: 4.4″ on February 16th
1″+ Snowfall Events: 3 Tied for 4th Fewest
# of Measurable Precipitation Days: 37 (-2.1) Tied for 13th Fewest
# of Measurable Snowfall Days: 13 (-8.4) Tied for 9th Fewest
Highest Average Daily Wind Speed in MPH: 20.8 on January 13th
Highest Wind Gust in MPH: 53 on February 28th
# of Clear Days: 12 13.19%
# of Partly Cloudy Days: 23 25.27%
# of Cloudy Days: 56 61.54%
Entire Cold Season: October-April
Average High: 54.7 2nd Warmest
Average Low: 36.6 6th Warmest
Mean: 45.6 3rd Warmest
Precipitation: 22.82″ 32nd Wettest
Snowfall: 12.6″ 22nd Least Snowiest
Average Snow Depth: 0.1″ Tied for 2nd Lowest
Largest Snowstorm: 4.4″ on February 16th
# of 32 or Below Highs: 10 Tied for 1st Fewest
# of 32 or Below Lows: 84 7th Fewest
# of Measurable Precipitation Days: 76 Tied for 11th Fewest
# of Measurable Snowfall Days: 14 Tied for 5th Fewest
Highest Average Daily Wind Speed in MPH: 20.8 on January 13th
Highest Wind Gust in MPH: 53 on February 28th
# of Clear Days: 30 14.1%
# of Partly Cloudy Days: 62 29.1%
# of Cloudy Days: 121 56.8%
Average High By Month
October 2023: 67.0 Tied for 34th Warmest
November 2023: 54.8 Tied for 18th Warmest
December 2023: 48.4 5th Warmest
January 2024: 37.4 Tied for 50th Warmest
February 2024: 51.8 Tied for 2nd Warmest
March 2024: 56.6 12th Warmest
April 2024: 66.9 Tied for 12th Warmest
High Temperature Records Set
2/28/2024- A record high of 67 was set, breaking the old record of 65 set in 1939.
Average Low By Month
October 2023: 48.2 Tied for 21st Warmest
November 2023: 33.7 Tied for 33rd Coldest
December 2023: 35.3 2nd Warmest
January 2024: 25.9 27th Warmest
February 2024: 29.2 16th Warmest
March 2024: 36.4 Tied for 19th Warmest
April 2024: 47.0 3rd Warmest
Low Temperature Records Set
10/28/2023- A record warm minimum of 62 was set, breaking the old record of 61 set in 1918.
2/10/2024- A record warm minimum of 49 was set, breaking the old record of 47 set in 1938.
2/27/2024- A record warm minimum of 56 was set, breaking the old record of 48 set in 1996.
Mean By Month
October 2023: 57.6 22nd Warmest
November 2023: 44.2 Tied for 26th Warmest
December 2023: 41.8 Tied for 4th Warmest
January 2024: 31.7 Tied for 43rd Warmest
February 2024: 40.5 5th Warmest
March 2024: 46.5 Tied for 14th Warmest
April 2024: 57.0 6th Warmest
Precipitation By Month
October 2023: 3.11″ Tied for 34th Wettest
November 2023: 1.89″ 40th Driest
December 2023: 3.25″ Tied for 44th Wettest
January 2024: 4.81″ 16th Wettest
February 2024: 1.23″ 20th Driest
March 2024: 2.66″ 49th Driest
April 2024: 5.87″ 8th Wettest
Precipitation Records Set
1/9/2024- A record of 1.44″ was set, breaking the old record of 0.86″ set in 1898.
2/2/2024- A record of 2.05″ was set, breaking the old record of 1.51″ set in 1977.
Snowfall By Month
October 2023: Trace Tied for 2nd Least Snowiest
November 2023: Trace Tied for 2nd Least Snowiest
December 2023: 0.4″ Tied for 6th Least Snowiest
January 2024: 5.0″ Tied for 37th Least Snowiest
February 2024: 7.0″ Tied for 40th Snowiest
March 2024: 0.2″ Tied for 3rd Least Snowiest
April 2024: Trace Tied for 2nd Least Snowiest
2023-2024 was the 9th consecutive season that had no snowfall events above 5″. This is the 2nd longest such period on record, surpassed only by the 14-year stretch of 1919-1933.
Average Snow Depth By Month
October 2023: 0.0″
November 2023: Trace
December 2023: Trace
January 2024: 0.2″
February 2024: 0.4″
March 2024: 0.0″
April 2024: 0.0″
Maximum High By Month
October 2023: 87 on the 2nd and 3rd
November 2023: 73 on the 8th
December 2023: 62 on the 25th
January 2024: 61 on the 26th
February 2024: 67 on the 26th and 27th
March 2024: 75 on the 4th
April 2024: 84 on the 16th and 29th
Minimum High By Month
October 2023: 47 on the 31st
November 2023: 30 on the 28th
December 2023: 34 on the 19th
January 2024: 16 on the 15th and 16th
February 2024: 27 on the 17th
March 2024: 36 on the 18th
April 2024: 45 on the 5th
Maximum Low By Month
October 2023: 63 on the 5th
November 2023: 46 on the 7th
December 2023: 51 on the 26th
January 2024: 48 on the 25th
February 2024: 56 on the 27th
March 2024: 51 on the 5th
April 2024: 64 on the 27th and 28th
Minimum Low By Month
October 2023: 29 on the 31st
November 2023: 17 on the 29th
December 2023: 22 on the 14th
January 2024: 6 on the 15th and 20th
February 2024: 13 on the 18th
March 2024: 23 on the 21st and 24th
April 2024: 31 on the 7th
Highest Daily Precipitation by Month
October 2023: 0.72″ on the 19th
November 2023: 0.93″ on the 21st
December 2023: 0.6″ on the 17th
January 2024: 1.44″ on the 9th
February 2024: 0.72″ on the 22nd
March 2024: 0.44″ on the 26th
April 2024: 2.05″ on the 2nd
Highest Daily Snowfall By Month
October 2023: Trace on the 31st
November 2023: Trace on the 27th
December 2023: 0.3″ on the 18th
January 2024: 2.2″ on the 19th
February 2024: 4.4″ on the 16th
March 2024: 0.2″ on the 10th
April 2024: Trace on the 4th and 17th
Deepest Snow Depth By Month
October 2023: 0.0″ on all days.
November 2023: 0.0″ on all days.
December 2023: Trace on the 19th
January 2024: 2″ on the 20th
February 2024: 4″ on the 17th
March 2024: 0.0″ on all days.
April 2024: 0.0″ on all days.
Average Daily Wind Speed by Month in MPH
October 2023: 7.0
November 2023: 7.2
December 2023: 7.3
January 2024: 9.2
February 2024: 8.0
March 2024: 9.3
April 2024: 9.4
Highest Wind Gust by Month in MPH
October 2023: 34 on the 6th
November 2023: 35 on the 27th
December 2023: 43 on the 18th
January 2024: 44 on the 13th
February 2024: 53 on the 28th
March 2024: 47 on the 14th
April 2024: 43 on the 12th and 17th
Clear Days by Month
October 2023: 5 16.13%
November 2023: 10 33.33%
December 2023: 4 12.9%
January 2024: 0 0.0%
February 2024: 7 24.14%
March 2024: 3 9.68%
April 2024: 3 10.0%
Partly Cloudy Days by Month
October 2023: 11 35.48%
November 2023: 13 43.33%
December 2023: 7 22.58%
January 2024: 8 25.81%
February 2024: 17 58.62%
March 2024: 18 58.06%
April 2024: 15 50.0%
Cloudy Days by Month
October 2023: 15 48.39%
November 2023: 7 23.33%
December 2023: 20 64.52%
January 2024: 23 74.19%
February 2024: 5 17.24%
March 2024: 10 32.26%
April 2024: 12 40.0%
The overall cold period saw relatively fewer cloudy days than normal. December and January were cloudier than normal, but November, February and March were less so than normal.
Other Notable Winter 2023-2024 Events
The Columbus Tornado History page gives greater detail on the February 28th, March 14th and April 2nd tornadic events.