Much to the potential annoyance of many, parts of Ohio- including Columbus are predicted to see a late-season snowfall Tuesday night into Wednesday morning. As late as it may seem, Columbus has seen even later season snowfalls since 1878. Though rare, these events do happen, and have sometimes been significant.
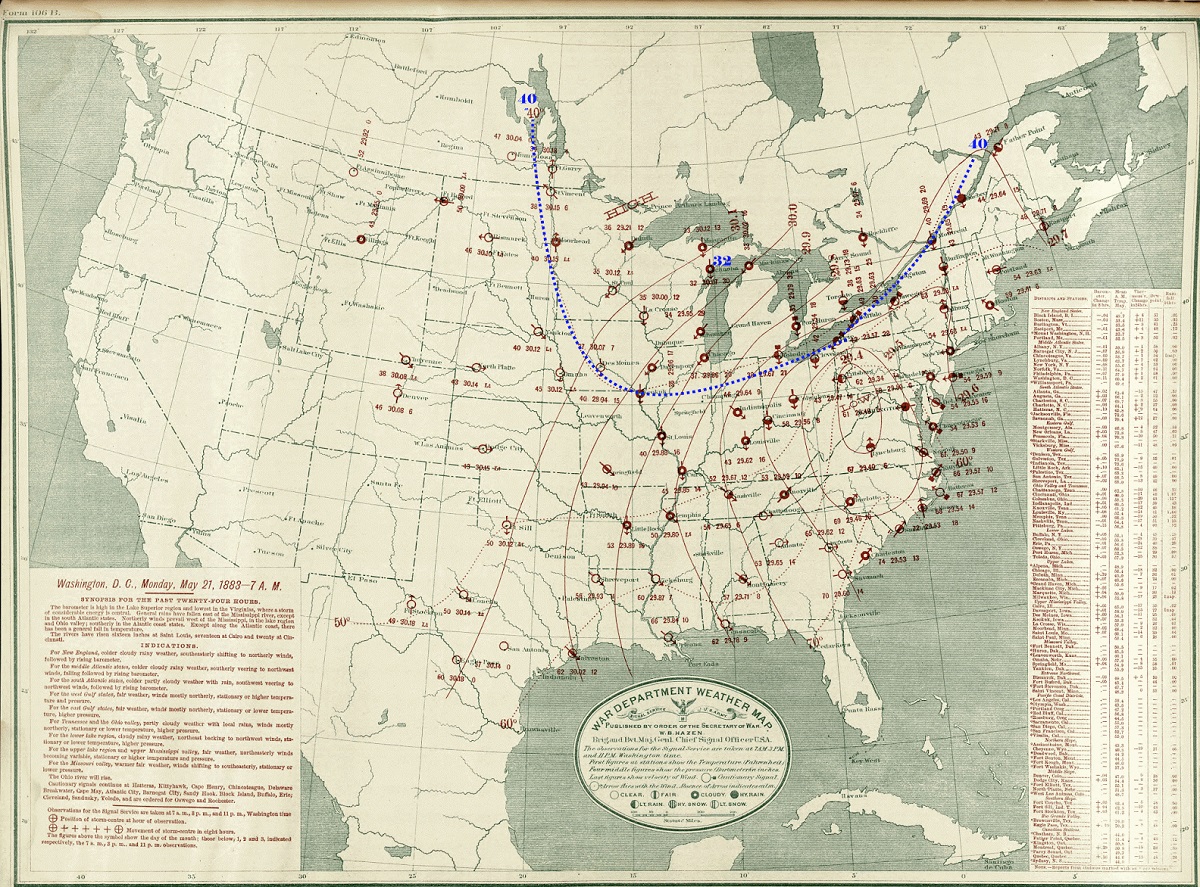
The US weather map on the morning of May 21, 1883.
The absolute latest measurable snow occurred on May 21st, 1883, when 0.4″ fell. The amount was not impactful, but the date certainly was. People are normally thinking about summer by then, but instead got a nasty taste of winter. The present-day I-71 corridor in the state generally had had an inch or less- Cincinnati had upwards of 2″, with 3″ near Hamilton. However, areas just to the north and west were hammered with the heaviest May snow ever recorded.
An excerpt from the book “Thunder in the Heartland” by Thomas W. Schmidlin: “A drizzling rain on Monday morning, 21 May, turned to snow at 9AM, and the air was filled with large, damp flakes all day. The Sidney Journal reported that ‘though it thawed, it lay six inches deep on Tuesday morning.’ Considering that much of the snow melted as it fell, a total of fifteen to twenty inches was estimated for Sidney. Snow depts of ten inches were measured on the north side of buildings at Houston in Shelby County.”
The Columbus Dispatch reported that snow fell in every major city from Lancaster north and west. Crops and trees were damaged by the heavy, wet snow across Western Ohio during the event. Temperatures at most locations were at or above freezing during the snow, so it did not stick around long after. Just 3 days later, it hit 80 degrees in Columbus.
Dates of Measurable Snowfalls After April 15th 1. May 21, 1883: 0.4″ 2. May 9, 1923: 0.3″ 3. May 7, 1989: 0.8″ 4. April 30, 1908: 2.4″ 5. April 24, 2005: 3.0″ 6. April 22, 1893: 0.8″ 6. April 22, 1901: 0.1″ 7. April 21, 1934: 0.4″ 7. April 21, 1936: 0.2″ 7. April 21, 1953: 0.2″ 8. April 20, 1910: 2.4″ 8. April 20, 1962: 0.1″ 9. April 19, 1887: 0.1″ 9. April 19, 1907: 0.4″ 9. April 19, 1969: 0.5″ 9. April 19, 2019: 0.3″ 10. April 18, 1983: 0.1″ 10. April 18, 1984: 0.3″ 11. April 17, 1961: 1.0″ 11. April 17, 2001: 0.6″ 12. April 16, 1935: 0.4″ 12. April 16, 1956: 0.3″ 12. April 16, 1996: 0.1″
Trace amounts have occurred many additional times after April 15th, including into early May. Measurable snow, however, has only occurred 23 times after April 15th since 1878. So snow after that date has occurred roughly once out of every 6.2 years. That rate is not going to be matched this time, as measurable snow fell on April 19th last year. Snow is predicted sometime tomorrow night, the 20th. If it ends up being measurable, it would fall into the tie of 8th latest such ever recorded.
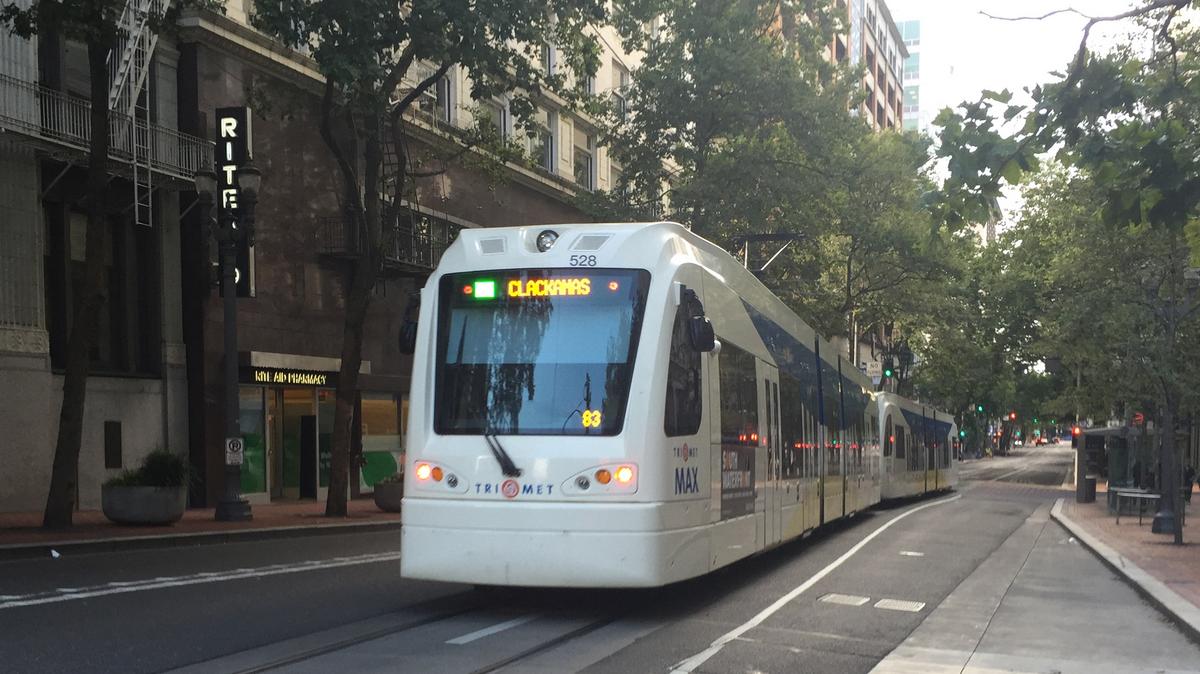
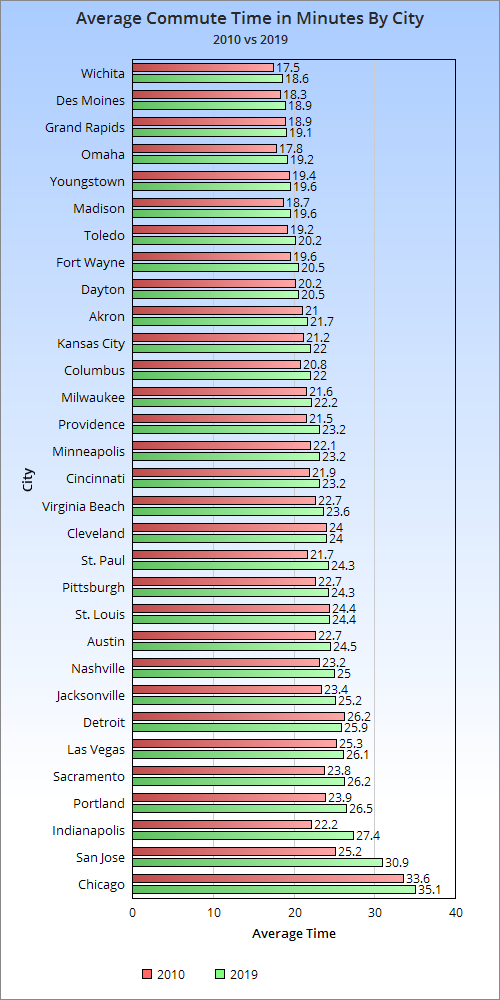
For a long time, Columbus has had a reputation for having a relatively easy commute, at least in terms of driving. Its abundant highway and road system allowed commuters to travel to work quickly, with most commutes 20 minutes or less. However, as the city has grown and traffic has increased, the local commute may not be as quick as it once was. Story after story has shown that Columbus’ commute is steadily getting worse.
This post seeks to answer both how people are getting to work, how fast they get to work, and how commuters in Columbus differ from those in other cities. For this comparison, I used cities from metro areas most similar to Columbus’ size- 1.5-2.5 million- as well as major Midwest and Ohio cities.
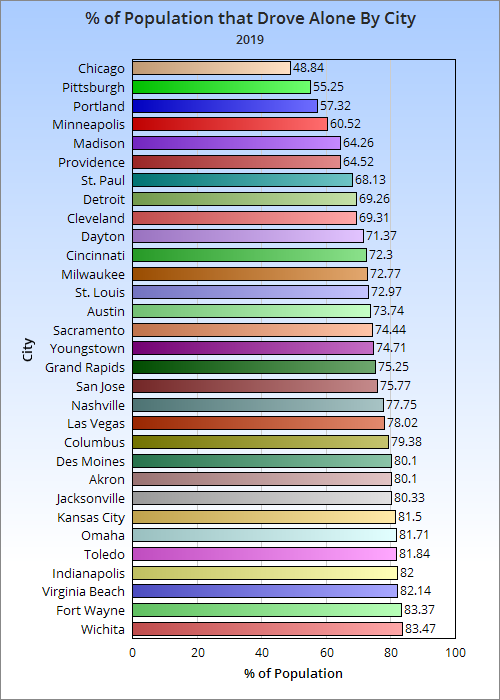
First, let’s look at just how people get to work by the % of workers in 2019, the latest year available.
Out of the 31 cities looked out, Columbus is the 10th most car-dependent city. It is also the 3rd most car-dependent in Ohio after Akron and Toledo.
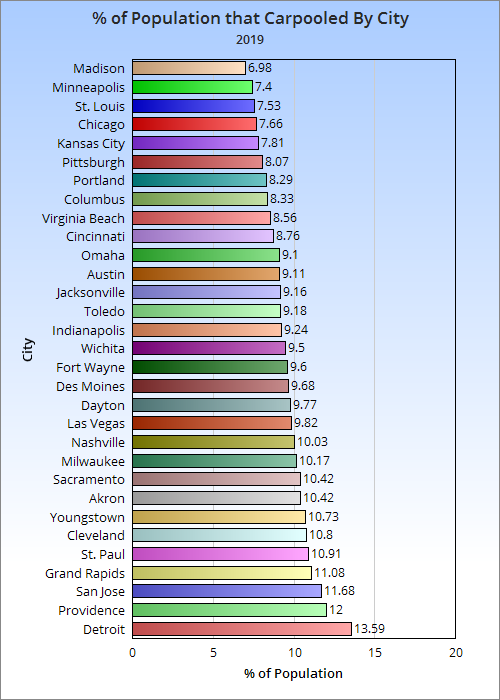
The heavy use of cars in Columbus did not translate to more people carpooling.
With only the COTA bus system available, the portion of the population that uses public transit is also in the bottom half. This despite the city seeing strong bus ridership growth over the last several years.
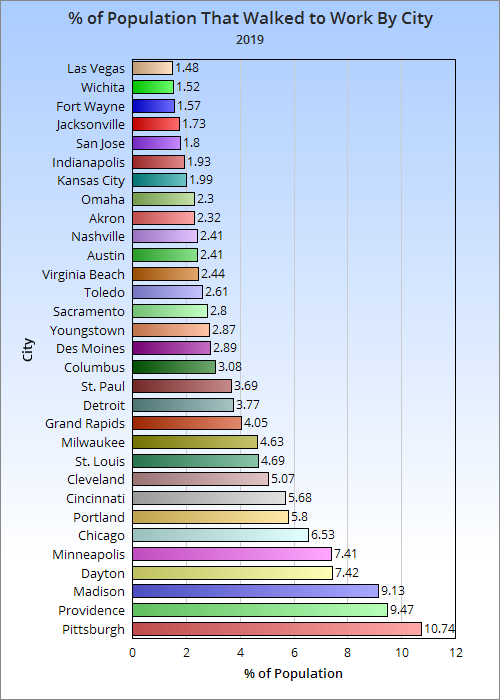
Columbus sat right in the middle of cities with the number of walking commuters. Several parts of the city lack sufficient walking infrastructure. For example, large parts of Linden and the South Side were built without sidewalks of any kind. Crosswalks and other safety features are also lacking in many areas.
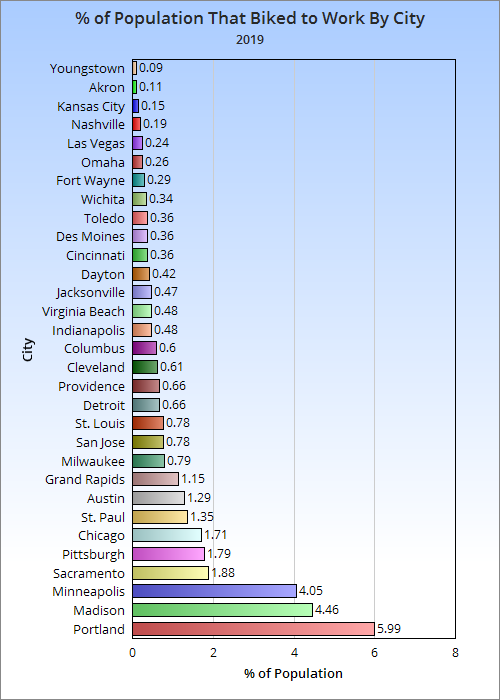
Columbus is again in the middle of the pack on biking commutes, and again infrastructure is the likely reason. There is only a single section of one bike lane that is protected anywhere in the city. Creating more bike lanes, let alone protected ones, remains a low priority for the city. Instead, they have relied on “Shared Use” type signage, along with painting sharrows.
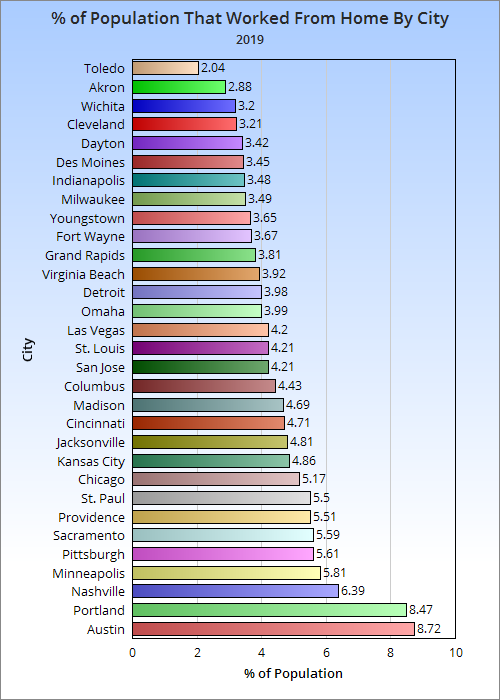
Columbus was in the top half of at-home workers. These numbers were all prior to the pandemic, so it’s likely that there will be significant increases in long-term or permanent home workers in post-2019 numbers.
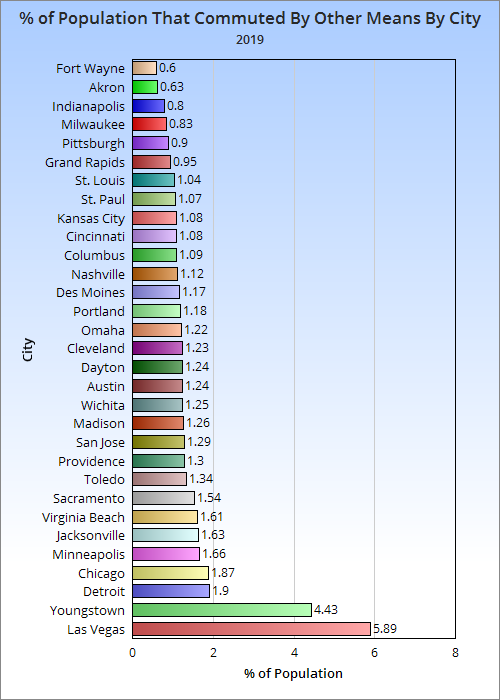
Other types of commuting include everything from taxis to commercial airline flights.
Columbus was in the bottom half of cities for the average commute time. Like almost everywhere else, that time has been increasing, however. Columbus saw the 11th biggest commute time increase and had the 2nd largest in Ohio. With its far larger population growth recently and predicted, that commute time is only going to get worse.
It’s pretty clear that Columbus has significant car dependency. With increasing commute times, it is crucial to plan for how people will get to work in the future. That is why it’s so important that new development is built to be walkable and dense while the average commute is still relatively short. This will promote walking, biking and new transit forms, all of which is better for a more vibrant, healthier city. It will also perhaps keep the number of cars on the road from growing as much. To assist in this process, the city must invest in more pedestrian and bike-friendly infrastructure, while also writing building codes that promote better planning in development.
To be fair, Columbus has made some progress. In 2010, the % of the population that drove alone was 80.76%, 1.38 points above where it was in 2019. Furthermore, the city has promoted more bus usage with its CPASS program. That said, the culture changes could’ve been much better had more policy and infrastructure been in place years ago like many other cities have had. Columbus has a lot of work to do.
The popular monthly series continues with the local housing market update March 2021 report. Let’s drill down into the results.
Note: LSD= Local School District, CSD= City School District. In both cases, school district boundaries differ from city boundaries.
Top 15 Most Expensive Locations By Median Sales Price in March 2021 1. New Albany: $652,000 2. New Albany Plain LSD: $523,500 3. Powell: $519,000 4. Upper Arlington CSD: $476,600 5. German Village: $475,550 6. Grandview Heights: $474,000 7. Dublin: $462,000 8. Olentangy LSD: $443,685 9. Buckeye Valley LSD: $420,000 10. Dublin CSD: $419,000 11. Bexley: $413,000 12. Short North: $399,900 13. Granville LSD: $388,500 14. Big Walnut LSD: $384,900 15. Worthington: $358,000
New Albany continued to dominate the top of the market in terms of median sales price, and it wasn’t even close.
Top 15 Least Expensive Locations by Median Sales Price in March 2021 1. Whitehall: $140,100 2. Newark CSD: $146,000 3. Lancaster CSD: $160,500 4. Hamilton LSD: $166,000 5. Groveport Madison LSD: $185,000 6. Jefferson LSD: $185,000 7. Reynoldsburg CSD: $205,250 8. Columbus CSD: $209,718 9. Circleville CSD: $210,000 10. Columbus: $217,000 11. Obetz: $227,420 12. South-Western CSD: $230,000 13. Johnstown-Monroe LSD: $230,000 14. London CSD: $251,000 15. Teays Valley LSD: $253,092
Whitehall remains the area’s biggest bargain. This inner suburb hasn’t always had the best reputation, but the city has been making efforts to improve both its commercial corridors and residential options. Columbus is relatively cheap compared to most of the metro, yet has by far the largest variety of options and neighborhood types to choose from.
Overall Market Median Sales Price in March 2021: $242,550 The overall market is defined by Columbus Metro Area counties.
Top 15 Locations with the Highest Median Sales Price % Growth Between March 2020 and March 2021 1. London CSD: +52.2% 2. Circleville CSD: +44.3% 3. New Albany Plain LSD: +32.5% 4. German Village: +29.4% 5. Obetz: +26.4% 6. Gahanna Jefferson CSD: +26.0% 7. Grandview Heights: +25.4% 8. Powell: +23.9% 9. Upper Arlington CSD: +23.8% 10. Lancaster CSD: +23.7% 11. Jonathan Alder LSD: +23.6% 12. Grove City: +22.0% 13. Gahanna: +21.9% 14. Teays Valley: +21.5% 15. Pickerington LSD: +20.8% 16. Pickerington: +20.8%
Top 15 Locations with the Lowest Median Sales Price % Growth Between March 2020 and March 2021 1. Johnstown Monroe LSD: -25.0% 2. Downtown Columbus: -14.5% 3. Granville LSD: -13.2% 4. Big Walnut LSD: -10.5% 5. Short North: -10.0% 6. Bexley: -6.1% 7. Minerva Park: -5.4% 8. Worthington: -5.0% 9. Hamilton LSD: -3.8% 10. Hilliard: +0.8% 11. New Albany: +1.7% 12. Newark CSD: +4.3% 13. Dublin CSD: +4.6% 14. Hilliard CSD: +5.5% 15. Dublin: +7.5%
Urban areas and some inner suburbs had either the biggest price declines or smallest increases in March vs. March 2020 as the fallout continued from Covid and protest-related activities. These declines may be seen by potential buyers as a positive from the high prices that otherwise continue, however.
Overall Market Median Sales Price % Change March 2021 vs. March 2020: +16.3%
Top 10 Locations with the Most New Listings in March 2021 1. Columbus: 1,156 2. Columbus CSD: 811 3. South-Western CSD: 187 4. Olentangy LSD: 161 5. Hilliard CSD: 138 6. Westerville CSD: 125 7. Dublin CSD: 125 8. Gahanna Jefferson CSD: 78 9. Dublin: 77 10. Upper Arlington CSD: 76
To no surprise, Columbus remains strongly at the top. There were about 300 more new listings in Columbus in March than in February as warmer weather prompted more sellers to put their homes on the market.
Top 10 Locations with the Fewest New Listings in March 2021 1. Valleyview: 0 2. Lithopolis: 2 3. Minerva Park: 2 4. Jefferson LSD: 8 5. Jonathan Alder: LSD: 11 6. Sunbury: 12 7. Grandview Heights: 12 8. Obetz: 12 9. Whitehall: 12 10. German Village: 13
Total New Listings in the Columbus Metro in March 2021: 2,797 Overall Metro New Listings % Change March 2021 vs March 2020: +3.3% The small increase overall was pushed by big increases smaller counties like Perry, Pickaway and Union.
Top 10 Fastest-Selling Locations by # of Days Homes Remain on the Market Before Sale in March 2021 1. Canal Winchester CSD: 3 2. Johnstown-Monroe LSD: 4 3. Minerva Park: 6 4. Hilliard: 7 5. Jefferson LSD: 7 6. Gahanna: 8 7. Groveport Madison LSD: 8 8. Whitehall: 9 9. London CSD: 10 10. Jonathan Alder LSD: 11 11. Marysville CSD: 11 12. South-Western CSD: 11
Top 10 Slowest-Selling Locations by # of Days Homes Remain on the Market Before Sale in March 2021 1. Lithopolis: 59 2. Powell: 55 3. Downtown Columbus: 54 4. Short North: 52 5. Big Walnut LSD: 49 6. Lancaster CSD: 39 7. Olentangy LSD: 38 8. Dublin: 37 9. Grandview Heights: 36 10. Buckeye Valley LSD: 34
Top 10 Locations with the Greatest % Decline of # of Days on the Market Before Sale March 2021 vs March 2020 1. Johnstown-Monroe LSD: -92.7% 2. Canal Winchester CSD: -92.5% 3. Minerva Park: -90.2% 4. Jefferson LSD: -89.9% 5. Sunbury: -85.0% 6. Jonathan Alder LSD: -83.8% 7. New Albany: -81.9% 8. New Albany Plain LSD: -75.5% 9. Marysville CSD: -71.8% 10. Whitehall: -71.0%
Top 10 Locations with the Lowest % Decline of # of Days on the Market Before Sale March 2021 vs March 2020 1. Worthington CSD: +50.0% 2. Worthington: +38.5% 3. Powell: +12.2% 4. Lancaster CSD: +2.6% 5. Hilliard CSD: -4.3% 6. Obetz: -5.3% 7. Short North: -10.3% 8. Newark CSD: -14.3% 9. Downtown Columbus: -23.9% 10. Pataskala: -26.1%
% Change for the # of Days Homes Remain on the Market Before Sale Across the Metro Overall: -24.5%
The market remained hot in March, with faster sales and higher prices than in the previous. Inventory did inch up some as spring arrived, but not nearly enough to counter overall demand. Urban areas are still a bit off their peaks from pre-Covid and protests, but seem to have recovered slightly from some previous months.
The previous housing market report and the Columbus Realtors site offers additional information on the Columbus market.
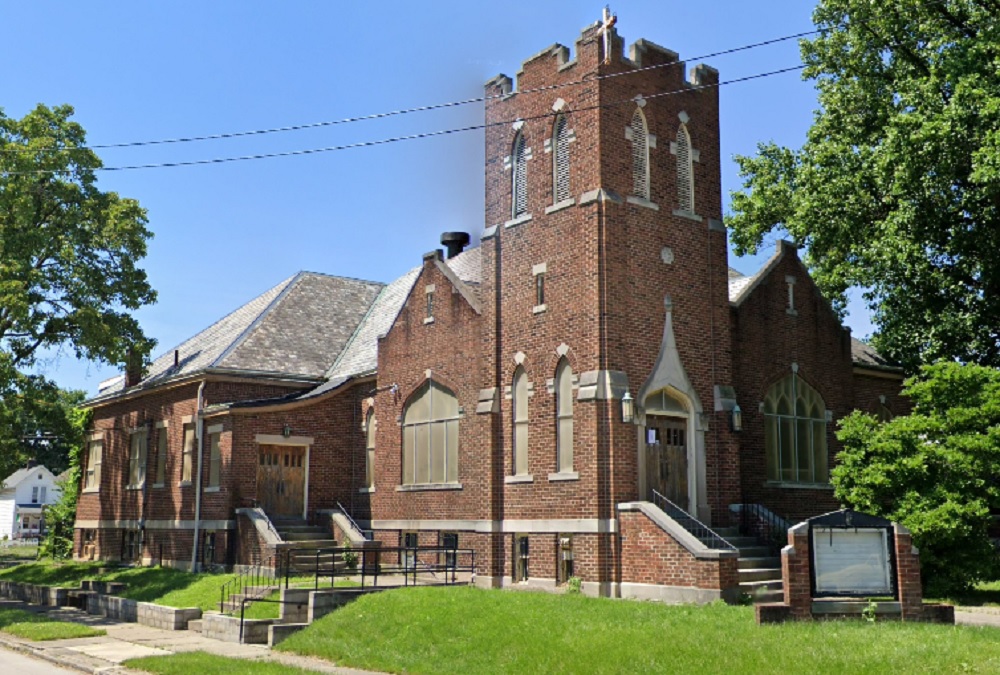
The former Washington Avenue United Methodist Church in 2019.
Columbus historic church demolition is a tricky subject, but has happened far more times over the years than people might believe. The Washington Avenue United Methodist Church at 359 East Markison Avenue has been part of the community since its dedication in 1923. While neither the oldest church in the city, nor the most elaborate, it has its own charms that would be lost to history should it fall to the wrecking ball.
It stopped functioning as a church at the beginning of 2015, perhaps part of the national decline in church attendance. Because of that relatively recent closure, the building remains in relatively good condition.
Churches used to just be torn down after their congregation abandoned them, but in recent years, they have found new life. They have become unique restaurants or retail shops, but the most popular conversion has been residential. Whether one of faith or not, churches offer a kind of architecture not found in any other building type.
Beyond adaptive reuse, however, is the issue of historic preservation. As mentioned, many such buildings have ended up rotting away before they are eventually demolished, and that scenario has played out many times in Columbus. This phenomenon is unfortunately not just part of our past. It continues to happen even now. Recently, a Franklinton church’s demolition was approved for new housing. Unlike the Washington Avenue building, this church had seen long-term abandonment and neglect by its owners. It’s poor overall condition from that neglect was then used to justify its demolition. It survived the 1913 flood when many surrounding buildings didn’t, but it won’t survive the Columbus building boom or intentional neglect.
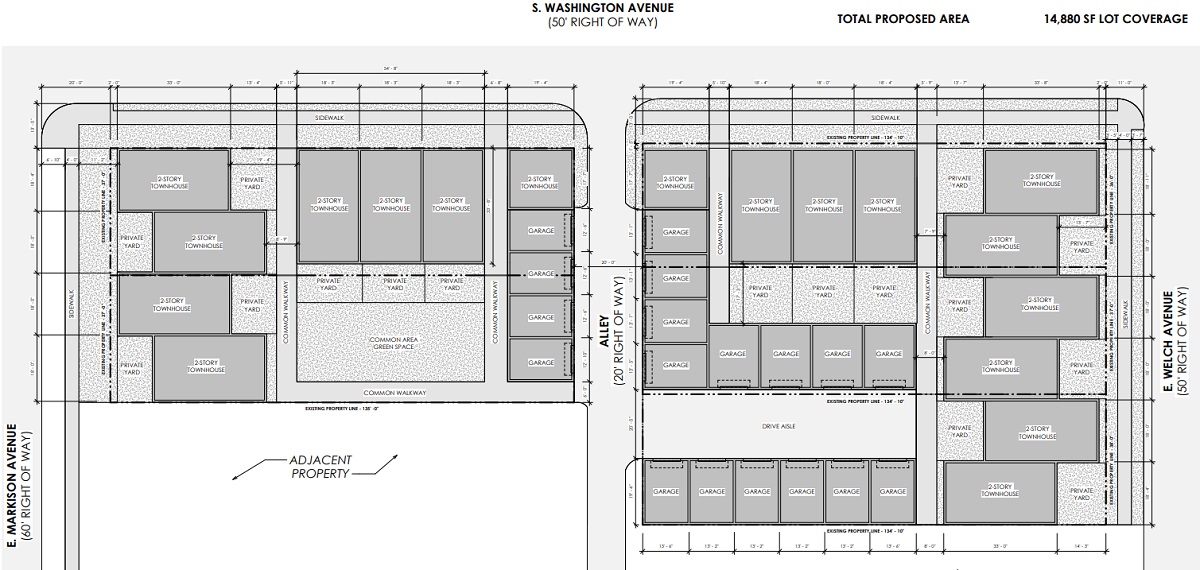
Sadly, it looks like the same fate is in store for the Washington Avenue United Methodist Church. A company called Bexley Manning 569 Holdings has proposed demolishing all but the church’s steeple tower in order to construct 17 townhomes. Columbus is in the midst of one of the largest housing crunches in its history, so the city desperately needs more homes. Sacrificing yet another beautiful old building still seems wrong, though. Columbus has already lost so much of its architectural history to the wrecking ball.
The original site plan for the Markison project.
The project is still in initial approval phases, so it’s possible the demolition will receive some pushback. The fact that the steeple tower is being preserved is actually a change from the original design. Perhaps more of the church may be saved in subsequent project updates. That said, the location is outside of established historic zones and lacks formal protection. Therefore, it seems likely that the WAUMC is facing its last days.
Vaccinations have been going on for about a month now. How is the process progressing across locations and age groups?
This data is updated through April 5, 2021.
Ohio Total Vaccinations Begun (1 shot): 3,721,565 31.84% of Ohio Population Ohio Total Vaccinations Completed (2 shots): 2,188,726 18.72% of Ohio Population
In general, more urban counties- or those within larger metros, have had better vaccination start success while more rural counties have done worse. Holmes County is by far the worst, and that may have something to do with the large Amish population.
There is less of a rural/urban divide in completed numbers, perhaps because there is 3-week time frame between the first and second shots. The numbers may eventually wash out more similarly in the end.
In terms of who is getting the vaccine by age, I will break it down below.
Top 10 Counties with the Most Vaccination Starts for the 0-39 Age Group by % of Population 1. Delaware: 19.13% 2. Wood: 18.63% 3. Cuyahoga: 16.18% 4. Athens: 15.74% 5. Hamilton: 15.63% 6. Warren: 15.43% 7. Franklin: 14.67% 8. Medina: 14.52% 9. Ottawa: 14.07% 10. Geauga: 13.75% Greene: 13.64%
Bottom 10 Counties with the Fewest Vaccination Starts for the 0-39 Age Group by % of Population 1. Holmes: 2.54% 2. Adams: 4.65% 3. Shelby: 5.22% 4. Brown: 5.38% 5. Harrison: 5.94% 6. Preble: 6.10% 7. Logan: 6.20% 8. Belmont: 6.27% 9. Darke: 6.39% 10. Monroe: 6.47%
Top 10 Counties with the Most Vaccination Starts for the 40-59 Age Group by % of Population 1. Delaware: 53.79% 2. Wood: 47.0% 3. Warren: 44.39% 4. Cuyahoga: 40.63% 5. Ottawa: 40.44% 6. Athens: 40.21% 7. Union: 40.21% 8. Franklin: 40.20% 9. Hamilton: 40.12% 10. Greene: 39.63%
Bottom 10 Counties with the Fewest Vaccination Starts for the 40-59 Age Group by % of Population 1. Holmes: 12.41% 2. Adams: 15.24% 3. Brown: 18.33% 4. Ashland: 21.47% 5. Preble: 21.82% 6. Harrison: 22.01% 7. Lawrence: 22.11% 8. Darke: 22.26% 9. Mercer: 23.16% 10. Shelby: 23.22%
Top 10 Counties with the Most Vaccination Starts for the 60 and Older Age Group by % of Population 1. Delaware: 80.12% 2. Wood: 77.63% 3. Union: 75.64% 4. Henry: 74.39% 5. Warren: 72.78% 6. Putnam: 72.61% 7. Sandusky: 71.31% 8. Medina: 71.26% 9. Geauga: 70.36% 10. Muskingum: 70.36%
Bottom 10 Counties with the Fewest Vaccination Starts for the 60 and Older Age Group by % of Population 1. Noble: 38.30% 2. Holmes: 39.92% 3. Lawrence: 46.90% 4. Adams: 47.33% 5. Brown: 50.30% 6. Vinton: 55.02% 7. Preble: 55.22% 8. Scioto: 55.35% 9. Shelby: 56.86% 10. Pike: 57.01%
Again, rural counties do generally worse while suburban and urban counties tend to do better. Only Delaware County has managed to at least start vaccinations for more than 80% of the most vulnerable age group- those aged 60 and older.
So overall, the state clearly has a long way to go if it wants to reach “herd immunity”, which is considered somewhere around 70% or more of the population.
To see more county data for Covid 19 and vaccinations, go to the Ohio Covid Dashboard And for instructions on how to schedule a vaccine shot appointment, go here: Ohio Covid Vaccine Guide