Columbus, Ohio weather is has varied wildly over the 143 years of records, and the holidays are no different. It’s seen record warmth into the 60s, and record cold well below zero, as well as heavy snow and driving rainstorms. The records below break down Columbus’ historic Christmas Day climatology.
Normals 1991-2020
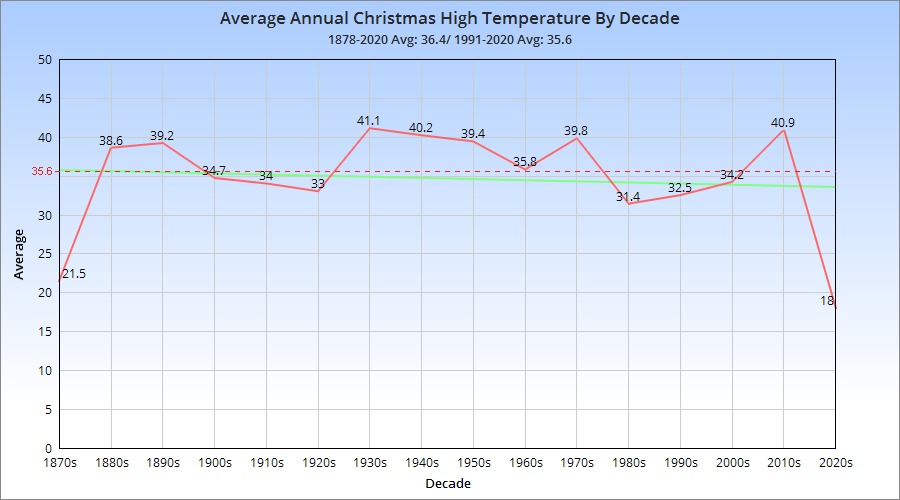
High: 35.6
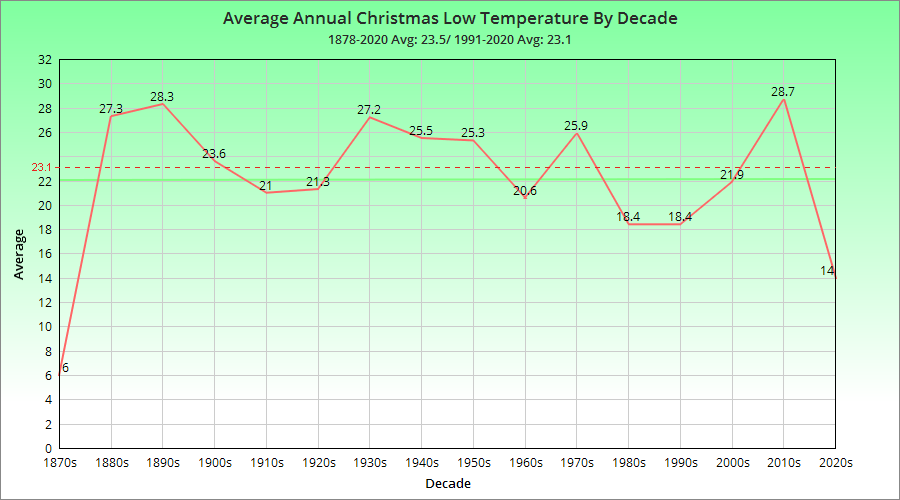
Low: 23.1
Mean: 26.8
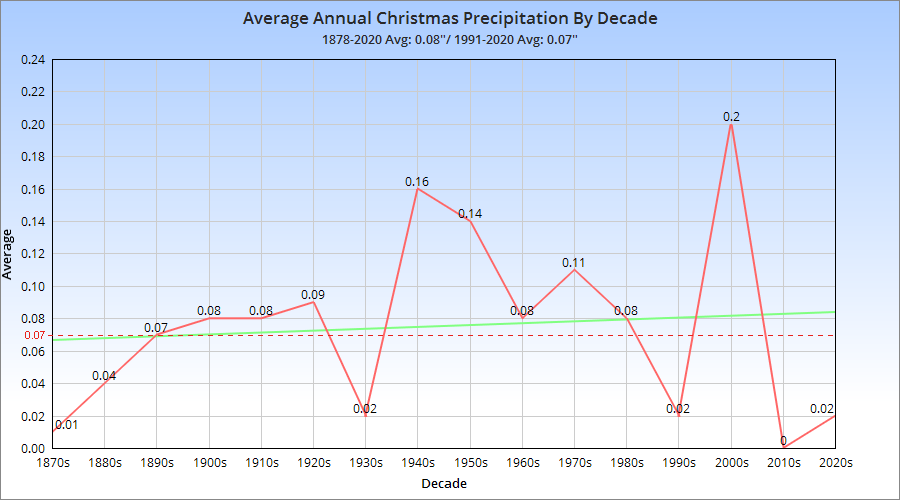
Precipitation: 0.10″
Snowfall: 0.1″
1878-2020 Averages
High: 36.4
Low: 23.5
Mean: 30.1
Precipitation: 0.08″
Snowfall: 0.3″
First, let’s take a look at the temperature breakdowns for the holiday.
Top 10 Coldest Highs
1. 1983: 1
2. 1878: 10
3. 1924: 11
4. 1980: 15
5. 1902: 16
6. 1985: 17
7. 2020: 18
8. 1884, 2000: 19
9. 1899, 1906, 1914:20
10. 1950, 1968: 22
Top 10 Coldest Lows
1. 1983: -12
2. 1980: -5
3. 1935: -4
4. 1924: -3
5. 1878: -2
6. 2004: -1
7. 1985: 1
8. 2000: 2
9. 1884: 4
10. 1914, 1999: 7
Top 10 Warmest Highs
1. 1893: 64
2. 1982: 63
3. 1932, 1940: 62
4. 1889: 60
5. 1964: 58
6. 1895, 1955: 57
7. 2019: 56
8. 1891: 55
9. 1936, 2015: 53
10. 1888, 1915, 1987: 52
Top 10 Warmest Lows
1. 1889, 1982: 55
2. 1895: 52
3. 1893: 49
4. 1891: 45
5. 2015: 43
6. 1932, 1940: 40
7. 1888, 1964, 1973: 39
8. 1987: 38
9. 1922, 1941, 2009, 2016: 37
10. 1936, 1972: 36
Number of Christmases with High Temperature
Less than 10: 1
10-19: 8
20-29: 24
30-39: 54
40-49: 36
50-59: 12
60 or Higher: 5
Number of Christmases with Low Temperature
Less than 0: 6
0-9: 7
10-19: 36
20-29: 47
30-39: 38
40-49: 5
50 or Higher: 4
Now let’s example precipitation and snowfall records.
Top 10 Wettest
1. 2009: 0.79″
2. 1944: 0.77″
3. 1926: 0.69″
4. 1951: 0.58″
5. 2006: 0.57″
6. 1945: 0.54″
7. 1957: 0.52″
8. 1987, 2005: 0.51″
9. 1915: 0.48″
10. 1909: 0.47″
Number of Christmases with Precipitation Amount
0.00″: 46
Trace: 27
0.01″-0.24″: 55
0.25″-0.49″: 6
0.50″-0.74″: 7
0.75″-0.99″: 2
1.00″ or More: 0
Top 10 Snowiest
1. 1890: 7.0″
2. 1909: 5.7″
3. 1950: 3.0″
4. 1917: 2.5″
5. 1969: 2.3″
6. 1884: 2.2″
7. 1976: 1.9″
8. 1880: 1.8″
9. 1935: 1.3″
10. 1944: 1.2″
Most Snow on the Ground (Since 1940)
1. 1960: 9″
2. 1961, 1963, 1989, 1995: 4″
3. 1969, 1980, 2004: 3″
4. 1947, 1950, 2000: 2″
5. 1944, 1945, 1951, 1956, 1962, 1990, 1992, 1993, 2010, 2017: 1″
Number of Christmases with Snowfall Amount
0.0″: 75
Trace: 23
0.1″-0.4″: 20
0.5″-0.9″: 9
1″-2.9″: 7
3″ or More: 3