New 2023 population estimates of Columbus metro places were just released by the US Census. In general, they showed that most places are now recovering from the pandemic population decline blip.
First, the full list of all available population estimates for Columbus metro area incorporated places. This list does not include Census Designated Places, as estimates for those are only done once per decade. Red places have moved down in the rankings, green have moved up.
2023 Population Estimates by Columbus Metro Places
Rank
2020
2023
1
Columbus: 905,939
Columbus: 913,175
2
Newark: 49,948
Newark: 51,046
3
Dublin: 49,313
Dublin: 48,923
4
Delaware: 41,327
Delaware: 45,158
5
Grove City: 41,244
Grove City: 42,782
6
Reynoldsburg: 41,070
Lancaster: 41,422
7
Lancaster: 40,540
Reynoldsburg: 41,220
8
Westerville: 39,194
Westerville: 37,958
9
Hilliard: 37,113
Hilliard: 37,262
10
Upper Arlington: 36,795
Upper Arlington: 35,743
11
Gahanna: 35,726
Gahanna: 35,159
12
Marysville: 25,585
Marysville: 28,423
13
Pickerington: 23,100
Pickerington: 25,256
14
Whitehall: 20,127
Whitehall: 19,727
15
Pataskala: 17,883
Patakala: 18,346
16
Worthington: 14,783
Worthington: 14,497
17
Powell: 14,250
Powell: 14,491
18
Bexley: 13,925
Circleville: 14,452
19
Circleville: 13,925
Bexley: 12,785
20
New Albany: 11,053
New Albany: 11,335
21
Heath: 10,414
Heath: 10,693
22
London: 10,272
London: 10,533
23
Canal Winchester: 9,119
Canal Winchester: 9,777
24
Grandview Heights: 8,085
Grandview Heights: 8,841
25
Logan: 7,292
Sunbury: 8,340
26
Sunbury: 6,610
Logan: 7,166
27
Groveport: 6,009
Obetz: 6,971
28
Granville: 5,950
Granville: 6,281
29
Obetz: 5,483
Groveport: 5,806
30
Johnstown: 5,183
Johnstown: 5,310
31
Ashville: 4,533
Ashville: 4,760
32
New Lexington: 4,430
West Jefferson: 4,488
33
West Jefferson: 4,145
New Lexington: 4,447
34
Plain City: 4,103
Plain City: 4,338
35
Mount Gilead: 3,499
Mount Gilead: 3,533
36
Commercial Point: 3,079
Commercial Point: 3,215
37
Baltimore: 2,980
Baltimore: 2,991
38
Buckeye Lake: 2,516
Lithopolis: 2,708
39
Crooksville: 2,421
South Bloomfield: 2,660
40
Hebron: 2,325
Buckeye Lake: 2,588
41
Richwood: 2,222
Richwood: 2,494
42
South Bloomfield: 2,147
Crooksville: 2,402
43
Lithopolis: 2,142
Hebron: 2,384
44
Cardington: 2,079
Utica: 2,115
45
Utica: 2,067
Cardington: 2,101
46
Minerva Park: 2,012
Mount Sterling: 2,030
47
Mount Sterling: 1,944
Minerva Park: 1,944
48
Roseville: 1,745
Roseville: 1,740
49
Somerset: 1,482
Bremen: 1,502
50
Bremen: 1,478
Somerset: 1,473
51
Hanover: 1,271
Ashley: 1,318
52
Ashley: 1,201
Hanover: 1,317
53
Ostrander: 1,094
Ostrander: 1,197
54
Thornville: 1,083
Thornville: 1,092
55
Urbancrest: 1,031
Galena: 1,018
56
Millersport: 977
Williamsport: 1,012
57
Williamsport: 972
Urbancrest: 996
58
Pleasantville: 943
Millersport: 975
59
Galena: 929
Pleasantville: 951
60
Shawnee Hills: 836
Shawnee Hills: 915
61
Milford Center: 805
Milford Center: 903
62
New Holland: 803
New Holland: 830
63
Junction City: 722
Junction City: 720
64
Amanda: 669
Marble Cliff: 699
65
Valleyview: 668
Amanda: 680
66
New Straitsville: 653
New Straitsville: 651
67
Marble Cliff: 638
Valleyview: 647
68
Thurston: 606
Thurston: 605
69
Riverlea: 596
Stoutsville: 577
70
Stoutsville: 578
Riverlea: 575
71
Buchtel: 519
Buchtel: 513
72
Laurelville: 512
Shawnee: 500
73
Shawnee: 504
Carroll: 500
74
Carroll: 501
Laurelville: 498
75
Corning: 489
Alexandria: 490
76
Alexandria: 481
Corning: 485
77
Kirkersville: 468
Kirkersville: 477
78
Sugar Grove: 427
Edison: 441
79
Edison: 420
Sugar Grove: 425
80
Hartford: 401
Hartford: 404
81
St. Louisville: 351
St. Louisville: 363
82
Murray City: 345
Murray City: 336
83
South Solon: 326
South Solon: 326
84
Harrisburg: 313
Harrisburg: 309
85
Rushville: 306
Rushville: 304
86
Marengo: 280
Magnetic Springs: 293
87
Midway: 269
Marengo: 280
88
Magnetic Springs: 261
Midway: 269
89
Tarlton: 254
Tarlton: 264
90
Fulton: 249
Fulton: 249
91
Unionville Center: 239
Unionville Center: 234
92
Lockbourne: 237
Lockbourne: 229
93
Gratiot: 214
Gratiot: 216
94
Chesterville: 194
Chesterville: 195
95
Darbyville: 185
Darbyville: 189
96
West Rushville: 165
West Rushville: 165
97
Glenford: 165
Glenford: 164
98
Hemlock: 145
Hemlock: 145
99
Sparta: 122
Sparta: 123
100
Brice: 94
Brice: 91
Out of Ohio’s 925 incorporated communities, 660 showed a population loss between 2020-2023, or 71.35%. 27 saw no population change, and 238- or 25.73%- saw population growth. In the Columbus metro, however, 60% of its communities saw growth, with 6% seeing no change and 34% seeing a loss. The Columbus metro places represented just 5.15% of the total communities seeing loss within the state, but 25.73% of all the communities seeing growth. This shows just how poorly most of the state is doing in comparison to the Columbus area.
Capital Crossroads has released its latest report for the state of Downtown. The annual report includes population estimates, information on construction and more.
For 2021, Downtown’s population reached 11,200, and is expected to rise to around 15,000 over the next 3 years.
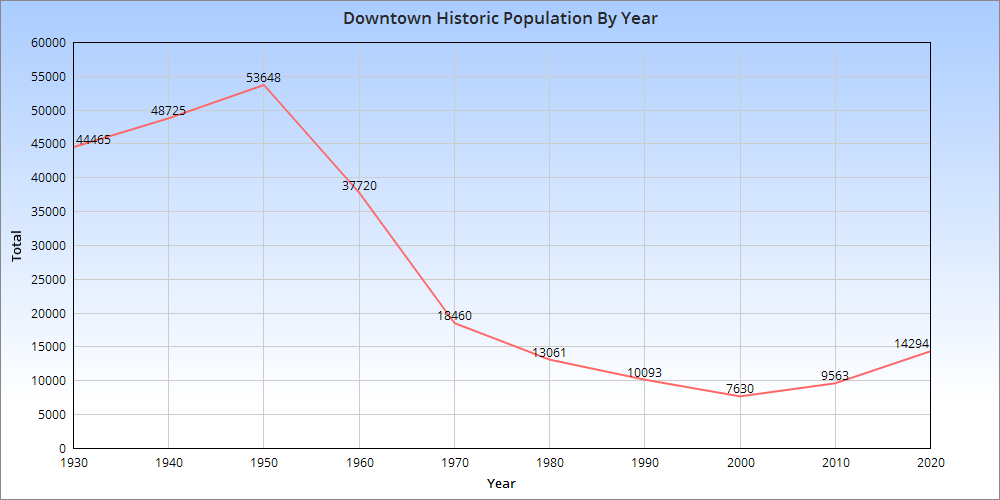
With the latest US Census data for 2020, we can once again take a closer look at how the Downtown area is doing.
Looking at the graph above, we can see that the Downtown population peaked in 1950 and declined through 2000. The last 20 years have seen accelerating growth and the population was the highest in 2020 since 1970. One caveat with this is that the census tract boundaries that are used to make up this graph have changed some over the years. They haven’t changed significantly, but the area that’s being covered in 2020 is slightly different than it was in 1950. As such, it’s more of an approximation per year rather than exact figures based on the exact same area. Still, the rapid decline after 1950 is well-documented. Highways were either being planned or already under construction through the neighborhood during the 1950s, and this also helped the beginning stages of the suburban flight from the urban core.
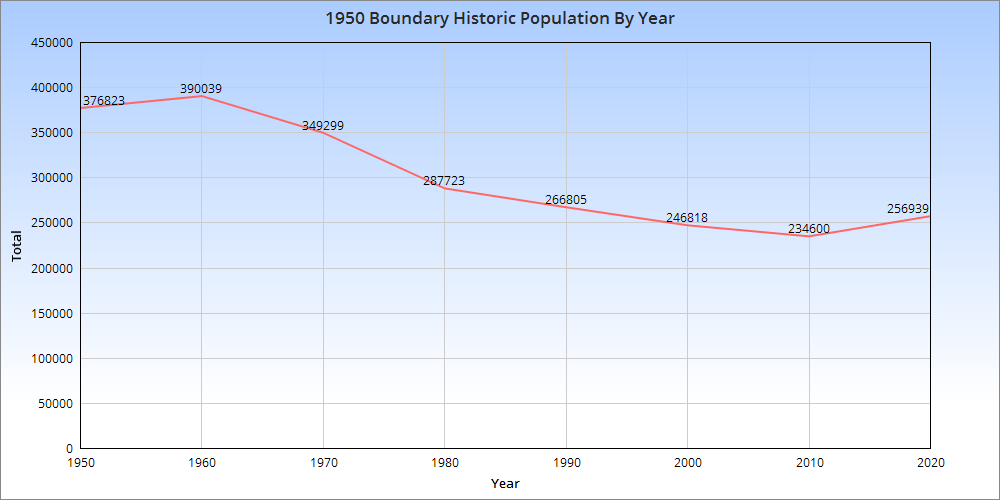
The urban core of the city overall reached its population peak in 1950, and the 1950 boundaries represent the oldest, arguably most urban part of the city today. Let’s examine how the population within that boundary changed over the same time. The 1950 boundary peaked in 1960 and then declined through 2010. Between 2010-2020, the 1950 boundary area gained more than 22,000 new residents, a significant increase which puts the area back to where it was around 1995.
So in both cases, the urban core of Columbus is in recovery, though it is unlikely to ever regain its 1950 population. Average household size is much smaller now than it was 70 years ago, so it would require a massive amount of infill that would be far denser than much of what is getting built in recent years. Outdated zoning codes, among other reasons, have been limiting many projects in the urban core from reaching their potential.
Breaking things down a bit further, let’s look at the census tracts that made up the 1950 boundary in 2020 and rank them for population and growth.
Top 10 Fastest-Growing 1950 Boundary Census Tracts by Total 2010-2020 1. 1121: +4,831 The tract is the main OSU Campus. The explosive growth is mostly due to the recent requirement that sophomores also have to now live on Campus, prompting thousands of students to move to the tract from nearby neighborhoods. 2. 4002: +2,592 This new tract was split off of Tract 40 and includes the southwest area of Downtown, including RiverSouth. 3. 22: +2,428 This tract is the heart of Italian Village and includes the large, new Jeffrey Park development. 4. 1901: +2,028 Includes the 5th Avenue corridor to just east of 5thxNW. 5. 32: +1,353 This tract covers the southern part of Victorian Village/Harrison West, as well as the far western sections of the Arena District where the new White Castle HQ complex is. 6. 17: +1,290 Western Weinland Park, which has seen rapid revitalization in recent years. 7. 30: +1,084 This area includes all of the norther half of Downtown north of Broad Street and west to Neil Avenue in the Arena District. 8. 16: +717 Eastern Weinland Park, which has seen hundreds of new housing units constructed along and near Grant Avenue. 9. 1902: +653 Includes the 5th Avenue corridor through 5thxNW. 10. 21: +648 The heart of the High Street strip in the Short North continued to add people. It reached its highest population in 60 years.
Top 10 Tracts with the Highest Population Densities in 2020 1. 1121: 34,888.8 2. 1810: 28,351.1 3. 1302: 24,740.7 4. 1301: 20,549.1 5. 17: 20,158.6 6. 12: 20,069.6 7. 1110: 18,353.2 8. 10: 16,260.2 9. 16: 12,675.6 10. 21: 12,196.7 All of these tracts are either in the Short North or surrounding Ohio State’s campus. They include the highest densities anywhere in Ohio.
So there you have it. The urban core of Columbus is clearly on a positive path. So long as infill development continues, population growth should also continue to increase. Perhaps someday, this increasing population and density may facilitate the construction of more amenities, including rail lines, BRT and more biking infrastructure, all of which lags in the area. To see Census Tract data in map form, the Census Tract Maps page provides it.
Franklin blew away the competition, adding more than 4x as many people as 2nd place Delaware County. Delaware County may be called the state’s fastest-growing by percent, but it’s clear what the dominant destination is in Ohio.
Core counties in Northern Ohio, as well as pretty much all of Appalachia and rural counties saw large population losses. This pattern of urban/metro counties gaining while exurban and rural counties declined was repeated nationally. 52% of all US counties lost population, with the vast majority of them being exurban and rural. There was clearly a strong trend towards people moving to or near major cities.
The Census has released 2019 metro population estimates. This comparison uses those figures to rank the Columbus metro with other metros under the following categories: Ohio metros with at least 250,000 people. Midwest metros with at least 500,000 people. National metros with 1.5-2.599 million people.
Total Metro Area Population Census 2010, July 1, 2018 and July 1, 2019 Census 2010——————————-July 1, 2018————————July 1, 2019 1. Chicago, IL: 9,461,105————-1. Chicago: 9,484,158———–1. Chicago: 9,458,539 2. Detroit, MI: 4,296,250—————2. Detroit: 4,322,084————-2. Detroit: 4,319,629 3. Minneapolis, MN: 3,348,8459—-3. Minneapolis: 3,610,061–3. Minneapolis: 3,640,043 4. St. Louis, MO: 2,787,701———-4. St. Louis: 2,803,958———4. St. Louis: 2,803,228 5. Pittsburgh, PA: 2,356,285——5. San Antonio: 2,512,379—5. San Antonio: 2,550,960 6. San Juan, PR: 2,350,126———-6. Portland: 2,473,350———6. Portland: 2,492,412 7. Portland, OR: 2,226,009——-7. Sacramento: 2,341,940—–7. Sacramento: 2,363,730 8. Sacramento, CA: 2,149,127—–8. Pittsburgh: 2,322,653——–8. Pittsburgh: 2,317,600 9. San Antonio, TX: 2,142,516—–9. Las Vegas: 2,226,115——-9. Las Vegas: 2,266,715 10. Cincinnati: 2,114,580———–10. Cincinnati: 2,211,936——-10. Austin: 2,227,083 11. Cleveland: 2,077,240———–11. Austin: 2,165,497———–11. Cincinnati: 2,221,208 12. Kansas City, MO: 2,009,342-12. Kansas City: 2,144,427–12. Kanas City: 2,157,990 13. Las Vegas, NV: 1,951,269—–13. Columbus: 2,104,194—–13. Columbus: 2,122,271 14. Columbus: 1,901,974——-14. Cleveland: 2,053,795—–14. Indianapolis: 2,074,537 15. Indianapolis, IN: 1,887,877—15. Indianapolis: 2,052,368—15. Cleveland: 2,048,449 16. San Jose, CA: 1,836,911—16. San Juan: 2,022,139———16. San Juan: 2,023,227 17. Austin, TX: 1,716,289————17. San Jose: 1,993,804—–17. San Jose: 1,990,660 18. Virginia Beach, VA: 1,676,822—18. Nashville: 1,904,726—18. Nashville: 1,934,317 19. Nashville: 1,670,890—19. Virginia Beach: 1,763,713–19. Virginia Beach: 1,768,901 20. Providence, RI: 1,600,852—-20. Providence: 1,622,379—20. Providence: 1,624,578 21. Milwaukee, WI: 1,555,908—–21. Milwaukee: 1,573,995—21. Milwaukee: 1,575,179 22. Jacksonville, FL: 1,345,596-22. Jacksonville: 1,532,663–22. Jacksonville: 1,559,514 23. Grand Rapids: 988,938–23. Grand Rapids: 1,071,370-23. Grand Rapids: 1,077,370 24. Omaha, NE: 865,350————–24. Omaha: 940,970—-24. Omaha: 949,442 25. Dayton: 799,232——————–25. Dayton: 805,088—–25. Dayton: 807,611 26. Akron: 703,200———————26. Akron: 703,855——–26. Akron: 703,479 27. Wichita, KS: 630,919————27. Des Moines: 690,915—27. Des Moines: 699,292 28. Toledo: 610,001——————28.Madison: 659,927——–28. Madison: 664,865 29. Madison, WI: 605,435———–29. Toledo: 643,089——–29. Toledo: 641,816 30. Des Moines, IA: 569,633——-30. Wichita: 637,519——30. Wichita: 640,218 31. Youngstown: 565,773———–31. Lansing: 548,674—–31. Lansing: 550,391 32. Lansing, MI: 534,684————32. Youngstown: 538,226—32. Youngstown: 536,081 33. Canton: 404,422——————33. Canton: 401,165—-33. Canton: 399,927
Charlotte and Orlando metros, previous national peers, have grown past the population standard limit of 2.599 million and are no longer used. Lansing and San Juan have been added.
Metro Area Total Growth Census 2010-July 1, 2019 and July 1, 2018-July 1, 2019 Census 2010-July 1, 2019—————————–July 1, 2018-July 1, 2019 1. Austin: +510,794————————————–1. Austin: +61,586 2. San Antonio: +408,452——————————2. Las Vegas: +40,600 3. Las Vegas: +315,446——————————–3. San Antonio: +38,581 4. Minneapolis: +306,410——————————4. Minneapolis: +29,982 5. Nashville: +288,117———————————-5. Nashville: +29,591 6. Portland: +266,403———————————–6. Jacksonville: +26,851 7. Columbus: +220,297——————————–7. Indianapolis: +22,169 8. Sacramento: +214,603——————————8. Sacramento: +21,790 9. Jacksonville: +213,918——————————9. Portland: +19,062 10. Indianapolis: +186,660—————————-10. Columbus: +18,077 11. San Jose: +153,749——————————–11. Kansas City: +13,563 12. Kansas City: +148,648—————————–12. Cincinnati: +9,272 13. Des Moines: +92,817——————————-13. Omaha: +8,472 14. Omaha: +84,092————————————-14. Des Moines: +8,377 15. Grand Rapids: +83,700—————————–15. Grand Rapids: +6,000 16. Cincinnati: +83,541———————————-16. Virginia Beach: +5,188 17. Madison: +59,430————————————17. Madison: +4,938 18. Virginia Beach: +54,947—————————-18. Wichita: +2,699 19. Providence: +23,726——————————–19. Dayton: +2,523 20. Detroit: +23,379—————————————20. Providence: +2,199 21. Milwaukee: +19,271———————————21. Lansing: +1,717 22. Wichita: +17,157————————————-22. Milwaukee: +1,184 23. Lansing: +15,707————————————23. San Juan: +1,088 24. St. Louis: +15,527———————————–24. Akron: -376 25. Dayton: +8,379—————————————25. St. Louis: -730 26. Akron: +279——————————————-26. Canton: -810 27. Chicago: -2,566————————————–27. Toledo: -1,273 28. Canton: -6,902—————————————28. Youngstown: -2,45 29. Toledo: -9,613—————————————-29. Detroit: -2,455 30. Cleveland: -28,791———————————-30. San Jose: -3,144 31. Youngstown: -29,692——————————-31. Pittsburgh: -5,053 32. Pittsburgh: -36,685———————————32. Cleveland: -5,346 33. San Juan: -326,899——————————–33. Chicago: -25,619
Now let’s look at the components of population change for metro areas.
Total Births By Metro Census 2010-July 1, 2019 and July 1, 2018-July 1, 2019 Census 2010-July 1, 2019———————–July 1, 2018-July 1, 2019 1. Chicago: 1,085,985——————————-1. Chicago: 108,425 2. Detroit: 462,696————————————2. Detroit: 48,879 3. Minneapolis: 419,634—————————–3. Minneapolis: 44,602 4. St. Louis: 310,273———————————4. San Antonio: 32,592 5. San Antonio: 300,032—————————-5. St. Louis: 31,686 6. Kansas City: 253,384—————————-6. Columbus: 27,096 7. Cincinnati: 253,180——————————-7. Las Vegas: 27,048 8. Portland: 253,110———————————8. Cincinnati: 26,892 9. Sacramento: 252,144—————————9. Sacramento: 26,752 10. Columbus: 251,291—————————10. Kanas City: 26,497 11. Las Vegas: 247,787—————————11. Indianapolis: 26,300 12. Indianapolis: 246,099————————-12. Portland: 26,204 13. Austin: 239,673———————————13. Austin: 26,115 14. San Jose: 220,891—————————–14. Nashville: 24,308 15. Pittsburgh: 218,159—————————-15. Pittsburgh: 22,570 16. Nashville: 216,969—————————–16. San Jose: 22,487 17. Cleveland: 212,523—————————-17. Cleveland: 22,003 18. Virginia Beach: 209,617———————-18. Virginia Beach: 21,589 19. Milwaukee: 182,815—————————19. Milwaukee: 18,927 20. Jacksonville: 167,526————————-20. Jacksonville: 18,592 21. Providence: 152,794————————–21. Providence: 16,182 22. Grand Rapids: 125,556———————-22. Grand Rapids: 13,339 23. Omaha: 122,306——————————23. Omaha: 12,848 24. Dayton: 88,783——————————–24. Dayton: 9,391 25. Des Moines: 85,530————————–25. Des Moines: 9,311 26. Wichita: 81,503——————————–26. Wichita: 8,057 27. Toledo: 71,848———————————27. Toledo: 7,428 28. Akron: 69,159———————————-28. Akron: 7,196 29. Madison: 67,559——————————29. Madison: 6,988 30. Lansing: 54,679——————————-30. Lansing: 5,702 31. Youngstown: 51,745————————-31. Youngstown: 5,450 32. Canton: 40,730——————————–32. Canton: 4,254
Components of change stats are not available for San Juan.
Total Deaths By Metro Census 2010-July 1, 2019 and July 1, 2018-July 1, 2019 Census 2010-July 1, 2019———————————July 1, 2018-July 1, 2019 1. Chicago: -647,739——————————————-1. Chicago: -74,501 2. Detroit: -377,943———————————————2. Detroit: -42,151 3. Pittsburgh: -253,686—————————————-3. St. Louis: -27,669 4. St. Louis: -241,884——————————————4. Pittsburgh: -27,387 5. Minneapolis: -210,510————————————-5. Minneapolis: -24,290 6. Cleveland: -198,044—————————————-6. Cleveland: -21,464 7. Cincinnati: -179,563—————————————-7. Cincinnati: -20,279 8. Sacramento: -157,234————————————-8. Sacramento: -18,933 9. Portland: -156,592——————————————9. San Antonio: -18,551 10. Kansas City: -155,166———————————–10. Portland: -18,458 11. San Antonio: -153,339———————————–11. Las Vegas: -17,919 12. Indianapolis: -148,608———————————–12. Kansas City: -17,692 13. Columbus: -142,665————————————–13. Columbus: -16,704 14. Las Vegas: -142,415————————————-14. Indianapolis: -16,678 15. Providence: -139,006————————————15. Virginia Beach: -15,280 16. Virginia Beach: -131,065——————————–16. Providence: -15,189 17. Nashville: -128,228—————————————17. Nashville: -15,122 18. Milwaukee: -123,806————————————-18. Jacksonville: -14,089 19. Jacksonville: -114,660———————————–19. Milwaukee: -13,810 20. San Jose: -94,587—————————————-20. San Jose: -11,582 21. Austin: -89,867——————————————–21. Austin: -11,445 22. Dayton: -77,893——————————————-22. Dayton: -8,506 23. Grand Rapids: -69,869———————————-23. Grand Rapids: -7,947 24. Akron: -65,852——————————————–24. Akron: -7,196 25. Youngstown: -64,558————————————25. Omaha: -6,931 26. Omaha: -62,030——————————————26. Youngstown: -6,842 27. Toledo: -59,436——————————————-27. Toledo: -6,624 28. Wichita: -51,734——————————————28. Wichita: 5,732 29. Des Moines: -44,857————————————29. Des Moines: 5,175 30. Canton: -41,233——————————————30. Lansing: -4,577 31. Lansing: -40,586—————————————–31. Madison: -4,453 32. Madison: -39,499—————————————-32. Canton: -4,395
Total Net Natural Change (Births vs. Deaths) By Metro Census 2010-July 1, 2019 and July 1, 2018-July 1, 2019 Census 2010-July 1, 2019———————————July 1, 2018-July 1, 2019 1. Chicago: 438,246———————————————1. Chicago: 33,924 2. Minneapolis: 209,124—————————————-2. Minneapolis: 20,312 3. Austin: 149,806———————————————–3. Austin: 14,670 4. San Antonio: 146,693—————————————4. San Antonio: 14,041 5. San Jose: 126,304——————————————-5. San Jose: 10,905 6. Columbus: 108,626——————————————6. Columbus: 10,392 7. Las Vegas: 105,372—————————————–7. Indianapolis: 9,622 8. Kansas City: 98,218—————————————–8. Nashville: 9,186 9. Indianapolis: 97,491—————————————–9. Las Vegas: 9,129 10. Portland: 96,518——————————————-10. Kansas City: 8,805 11. Sacramento: 94,910————————————–11. Sacramento: 7,819 12. Nashville: 88,741——————————————12. Portland: 7,746 13. Detroit: 84,753———————————————-13. Detroit: 6,728 14. Virginia Beach: 78,552———————————–14. Cincinnati: 6,613 15. Cincinnati: 73,617—————————————–15. Virginia Beach: 6,309 16. St. Louis: 68,389——————————————-16. Omaha: 5,917 17. Omaha: 60,276———————————————17. Grand Rapids: 5,392 18. Milwaukee: 59,009—————————————–18. Milwaukee: 5,117 19. Grand Rapids: 55,687————————————19. Jacksonville: 4,503 20. Jacksonville: 52,866————————————–20. Des Moines: 4,136 21. Des Moines: 40,673————————————–21. St. Louis: 4,017 22. Wichita: 29,769——————————————–22. Madison: 2,535 23. Madison: 28,060——————————————23. Wichita: 2,325 24. Cleveland: 14,479—————————————-24. Lansing: 1,125 25. Lansing: 14,093——————————————25. Providence: 993 26. Providence: 13,788————————————–26. Dayton: 885 27. Toledo: 12,412——————————————–27. Toledo: 804 28. Dayton: 10,890——————————————-28. Cleveland: 539 29. Akron: 3,307———————————————-29. Akron: 0 30. Canton: -503———————————————-30. Canton: -141 31. Youngstown: -12,813———————————–31. Youngstown: -1,392 32. Pittsburgh: -35,527————————————–32. Pittsburgh: -4,817
Total Domestic Migration By Metro Census 2010-July 1, 2019 and July 1, 2018-July 1, 2019 Census 2010-July 1, 2019———————————July 1, 2018-July 1, 2019 1. Austin: 293,162———————————————–1. Austin: 41,334 2. San Antonio; 214,509—————————————2. Las Vegas: 31,643 3. Las Vegas: 185,570—————————————–3. San Antonio: 21,987 4. Nashville: 158,336——————————————-4. Jacksonville: 20,051 5. Jacksonville: 126,483—————————————5. Nashville: 15,482 6. Portland: 121,473——————————————–6. Sacramento: 9,941 7. Sacramento: 69,723—————————————-7. Portland: 8,374 8. Columbus: 53,301——————————————-8. Indianapolis: 6,196 9. Indianapolis: 46,076—————————————-9. Columbus: 3,746 10. Des Moines: 40,183————————————–10. Des Moines: 3,718 11. Kansas City: 24,457————————————–11. Minneapolis: 3,202 12. Madison: 15,880——————————————12. Kansas City: 2,437 13. Minneapolis: 11,638————————————–13. Madison: 1,418 14. Grand Rapids: 10,903———————————–14. Cincinnati: 1,193 15. Omaha: 7,537———————————————-15. Omaha: 1,068 16. Canton: -7,124———————————————16. Dayton: 896 17. Dayton: -15,586——————————————–17. Wichita: -291 18. Akron: -15,683———————————————-18. Grand Rapids: -669 19. Lansing: -18,240——————————————-19. Canton: -677 20. Youngstown: -19,317————————————-20. Youngstown: -751 21. Cincinnati: -19,944—————————————-21. Lansing: -840 22. Wichita: -21,454——————————————-22. Akron: -1,190 23. Toledo: -27,740——————————————–23. Virginia Beach: -2,197 24. Pittsburgh: -31,804—————————————24. Toledo: -2,339 25. Providence: -38,503————————————-25. Pittsburgh: -2,658 26. Virginia Beach: -59,729———————————26. Providence: -3,185 27. Milwaukee: -64,395————————————–27. Milwaukee: -5,140 28. Cleveland: -78,763————————————–28. Cleveland: -7,250 29. St. Louis: -85,003—————————————-29. St. Louis: -7,685 30. San Jose: -124,105————————————-30. Detroit: -16,655 31. Detroit: -172,225—————————————–31. San Jose: -27,495 32. Chicago: -638,599—————————————32. Chicago: -74,950
Total International Migration By Metro Census 2010-July 1, 2019 and July 1, 2018-July 1, 2019 Census 2010-July 1, 2019———————————July 1, 2018-July 1, 2019 1. Chicago: 197,093——————————————-1. Chicago: 15,257 2. San Jose: 152,520—————————————–2. San Jose: 13,371 3. Detroit: 110,907———————————————3. Detroit: 7,516 4. Minneapolis: 87,847—————————————4. Minneapolis: 6,645 5. Austin: 62,740———————————————–5. Indianapolis: 6,394 6. Columbus: 58,853——————————————6. Austin: 5,280 7. Sacramento: 51,225—————————————7. Nashville: 4,937 8. Providence: 49,015—————————————-8. Providence: 4,455 9. Portland: 47,983——————————————–9. Sacramento: 4,053 10. San Antonio: 45,348————————————10. Columbus: 4,032 11. Indianapolis: 43,502————————————-11. St. Louis: 2,991 12. Nashville: 39,422—————————————–12. Portland: 2,960 13. Virginia Beach: 36,319———————————-13. Pittsburgh: 2,555 14. Cleveland: 36,318—————————————-14. San Antonio: 2,504 15. Jacksonville: 34,089————————————-15. Kansas City: 2,377 16. St. Louis: 32,872—————————————–16. Jacksonville: 2,251 17. Cincinnati: 31,157—————————————-17. Cincinnati: 1,547 18. Pittsburgh: 30,654—————————————-18. Omaha: 1,517 19. Kansas City: 27,259————————————-19. Lansing: 1,452 20. Milwaukee: 25,298—————————————20. Cleveland: 1,433 21. Las Vegas: 23,319—————————————21. Grand Rapids: 1,316 22. Lansing: 19,865——————————————22. Milwaukee: 1,277 23. Grand Rapids: 17,629———————————-23. Virginia Beach: 1,165 24. Omaha: 16,785——————————————24. Madison: 988 25. Madison: 15,600—————————————–25. Akron: 836 26. Dayton: 13,473——————————————26. Dayton: 785 27. Akron: 13,086——————————————–27. Wichta: 688 28. Des Moines: 11,716————————————28. Des Moines: 519 29. Wichita: 9,096——————————————-29. Toledo: 270 30. Toledo: 5,646——————————————–30. Canton: 25 31. Youngstown: 2,675————————————-31. Youngstown: 25 32. Canton: 1,073——————————————–32. Las Vegas: -360
Total Net Migration By Metro Census 2010-July 1, 2019 and July 1, 2018-July 1, 2019 Census 2010-July 1, 2019———————————July 1, 2018-July 1, 2019 1. Austin: 355,902———————————————1. Austin: 46,614 2. San Antonio: 259,857————————————-2. Las Vegas: 31,283 3. Las Vegas: 208,889—————————————3. San Antonio: 24,491 4. Nasvhille: 197,758—————————————–4. Jacksonville: 22,302 5. Portland: 169,456——————————————5. Nashville: 20,419 6. Jacksonville: 160,572————————————-6. Sacramento: 13,994 7. Sacramento: 120,948————————————-7. Indianapolis: 12,590 8. Columbus: 112,154—————————————-8. Portland: 11,334 9. Minneapolis: 99,458—————————————9. Minneapolis: 9,847 10. Indianapolis: 89,578————————————10. Columbus: 7,778 11. Des Moines: 51,899————————————-11. Kansas City: 4,814 12. Kansas City: 51,716————————————-12. Des Moines: 4,237 13. Madison: 31,480——————————————13. Cincinnati: 2,740 14. Grand Rapids: 28,352———————————–14. Omaha: 2,585 15. San Jose: 28,415—————————————-15. Madison: 2,406 16. Omaha: 24,322——————————————-16. Dayton: 1,681 17. Cincinnati: 11,213—————————————-17. Providence: 1,270 18. Providence: 10,512————————————–18. Grand Rapids: 647 19. Lansing: 1,625——————————————–19. Lansing: 612 20. Pittsburgh: -1,150—————————————-20. Wichita: 397 21. Dayton: -2,113——————————————–21. Pittsburgh: -103 22. Akron: -2,597———————————————-22. Akron: -354 23. Canton: -6,051——————————————–23. Canton: -652 24. Wichita: -12,358——————————————24. Youngstown: -726 25. Youngstown: -16,642————————————25. Virginia Beach: -1,032 26. Toledo: -22,094——————————————-26. Toledo: -2,069 27. Virginia Beach: -23,410——————————–27. Milwaukee: -3,863 28. Milwaukee: -39,097————————————-28. St. Louis: -4,694 29. Cleveland: -42,445————————————–29. Cleveland: -5,817 30. St. Louis: -52,131—————————————-30. Detroit: -9,139 31. Detroit: -61,318——————————————31. San Jose: -14,124 32. Chicago: -441,506————————————–32. Chicago: -59,693
The 2019 metro population estimates show Columbus largely holding its own against state, regional and national peers.