For the Columbus economy May 2022 report, we will look for any signs that the local economy is being negatively affected by ongoing inflation and higher energy prices.
Overall Metro Area May 2022 and Change from May 2021 Labor Force: 1,132,871 +24,699 Employed: 1,100,438 +43,723 Unemployed: 32,433 -19,024 Unemployment Rate: 2.9% -1.7 Total Non-Farm Jobs: 1,123,200 +28,300
The 2.9% May unemployment rate for the Columbus metro remains one of the lowest in more than 30 years, and all metrics were better than they were a year ago.
Overall Metro Area May 2022 and Change from February 2020 (Pre-Pandemic) Labor Force: 1,132,871 +12,067 Employed: 1,100,438 +23,598 Unemployed: 32,433 -11,531 Unemployment Rate: 2.9% -1.0 Total Non-Farm Jobs: 1,123,200 +11,800 The metro area has surpassed pre-pandemic data across the board.
Now let’s view the results by industry.
Mining/Logging/Construction 5/2020———–5/2021———-5/2022 43,200————45,700———47,500 This industry has fully recovered from the pandemic and continues to set new highs.
Manufacturing 5/2020———–5/2021———-5/2022 66,700———–71,900———-72,300 Although manufacturing has largely recovered from pandemic lows, it remains *well* below anytime before 2000.
Trade/Transportation/Utilities 5/2020———–5/2021———-5/2022 205,400———-221,000———238,000 This industry is at 30 year highs.
Information 5/2020———–5/2021———-5/2022 15,500———–15,600———-16,600 The industry has been in somewhat of a decline overall since the Dot.com boom of the late 1990s. It recovered most pandemic losses, but seems unlikely to do much better in the long run.
Financial Activities 5/2020———–5/2021———-5/2022 83,900———–84,500———-83,700 Financial activities jobs have declined slightly since recovering its pandemic losses.
Professional and Business Services 5/2020———–5/2021———-5/2022 166,500———-179,600———178,200 As with the financial activities industry, this industry initially recovered from the pandemic, but has stagnated a bit since then.
Education and Health Services 5/2020———–5/2021———-5/2022 145,600———-159,700———158,800 These industries have been somewhat stagnant as well since around October, 2020.
Leisure and Hospitality 5/2020———–5/2021———-5/2022 69,000———-97,200———-107,600 This industry was arguably hit the hardest of any during the pandemic crash, but have recovered fairly strongly since then. However, because the fall was so great, it has not completely come back to date.
Other Services 5/2020———–5/2021———-5/2022 32,800———–39,800———-41,500 This industry is on track for full recovery by late summer.
Government 5/2020———–5/2021———-5/2022 177,500———-179,900———179,000 Government jobs remain below where they were pre-pandemic, and have shown little movement either way.
Overall, the metro has recovered from the pandemic and most metrics are generally positive, but not all industries are doing equally well. There remains no sign of any impending downturn.
The Bureau of Labor Statistics, the source of this data, is useful for local employment data for any metro area in the United States.
In this latest edition of the Housing Market Update May 2022, we see that home prices continue to reach record levels in the metro area, and houses are selling faster than ever. With rising mortgage interest rates, will the region eventually see a slowdown?
Note: LSD= Local School District, CSD= City School District. In both cases, school district boundaries differ from city boundaries.
Top 15 Most Expensive Locations By Median Sales Price in May 2022 1. New Albany: $789,900 2. New Albany Plain LSD: $650,000 3. Big Walnut LSD: $572,127 4. Powell: $565,000 5. Upper Arlington CSD: $558,000 6. Dublin: $555,000 7. Grandview Heights: $545,000 8. Granville CSD: $530,000 9. Dublin CSD: $515,000 10. Olentangy LSD: $505,000 11. Buckeye Valley LSD: $495,000 12. Worthington: $481,000 13. German Village: $475,000 14. Bexley: $470,000 15. Pickerington: $444,000 16. Canal Winchester CSD: $430,000 Several suburbs now have median prices at or above half a million dollars, with several others not too far behind.
Top 15 Least Expensive Locations by Median Sales Price in May 2022 1. Lancaster CSD: $175,000 2. Miami Trace LSD: $180,000 3. Newark CSD: $184,000 4. Circleville CSD: $187,500 5. Whitehall CSD: $205,000 6. Jefferson LSD: $220,000 7. London CSD: $227,450 8. Groveport Madison LSD: $243,000 9. Hamilton LSD: $256,700 10. Obetz: $256,700 11. Columbus CSD: $257,500 12. Columbus: $277,750 13. Reynoldsburg CSD: $280,500 14. Minerva Park: $291,500 15. South Western CSD: $295,450 On the opposite side of things, even some of the cheapest markets are approaching the $300K mark. Columbus itself remains *relatively* affordable in comparison to the market overall.
Overall Market Median Sales Price in May: $303,460 Based on the 10 Columbus Metro Area counties.
Top 15 Locations with the Highest Median Sales Price % Growth Between May 2021 and May 2022 1. Canal Winchester CSD: +65.4% 2. Big Walnut LSD: +50.4% 3. Whitehall: +48.6% 4. Northridge LSD: +42.6% 5. Groveport Madison LSD: +39.0% 6. Grandview Heights: +38.3% 7. Granville CSD: +31.7% 8. Gahanna: +27.6% 9. Teays Valley LSD: +26.4% 10. Pataskala: +26.3% 11. Pickerington: +25.1% 12. Downtown: +24.3% 13. Johnstown-Monroe LSD: +23.5% 14. Powell: +22.8% 15. Sunbury: +22.5%
Top 15 Locations with the Lowest Median Sales Price % Growth Between May 2021 and May 2022 1. German Village: -24.6% 2. Miami Trace LSD: -19.3% 3. Obetz: -14.0% 4. Bexley: -5.5% 5. Delaware CSD: -4.7% 6. New Albany: -2.5% 7. Minerva Park: -2.2% 8. Lancaster CSD: -0.6% 9. Newark CSD: -0.1% 10. Jonathan Alder LSD: 0.0% 11. Short North: 0.5% 12. London CSD: +1.1% 13. Westerville: +2.4% 14. Circleville CSD: +3.0% 15. Beechwold/Clintonville: +3.5% So far, the “Intel Effect” has yet to kick in in places like Newark and some Northeast Side communities. Only Johnstown is seeing a significant price increase. This may have to do with some of these places already being overvalued, especially New Albany.
Overall Market Median Sales Price % Change May 2022 vs. May 2021:+14.5% Based on 53 metro market locations.
Top 10 Locations with the Most New Listings in May 2022 1. Columbus: 1,337 2. Columbus CSD: 898 3. Olentangy LSD: 214 4. South Western CSD: 210 5. Hilliard CSD: 162 6. Dublin CSD: 146 7. Westerville CSD: 139 8. Worthington CSD: 94 9. Dublin: 90 10. Lancaster CSD: 88
Top 10 Locations with the Fewest New Listings in May 2022 1. Valleyview: 0 2. Lithopolis: 2 3. Minerva Park: 5 4. Obetz: 6 5. Jefferson LSD: 12 6. Northridge LSD: 14 7. Johnstown-Monroe LSD: 15 8. Miami Trace LSD: 18 9. Sunbury: 20 10. Granville CSD: 20 11. German Village: 21
Total New Listings in the Columbus Metro in May 2022:+3,362 Overall Metro New Listings % Change May 2022 vs May 2021:-3.1% New listings fell in May year-over-year even though the late spring is often a time when more homes go onto the market. Franklin County had one of the largest declines in inventory, dropping about 6.9%.
Top 10 Fastest-Selling Locations by # of Days Homes Remain on the Market Before Sale in May 2022 1. Grandview Heights: 3 2. Canal Winchester CSD: 4 3. Hilliard: 4 4. Miami Trace LSD: 4 5. Minerva Park: 4 6. Westerville: 4 7. Westerville CSD: 4 8. German Village: 5 9. Hilliard CSD: 5 10. Marsyville CSD: 5 11. Powell: 5 12. Reynoldsburg CSD: 5 13. Sunbury: 5 14. Worthington: 5 15. Worthington CSD: 5 16. Bexley: 6 17. Dublin: 6 18. Groveport Madison LSD: 6 19. Jefferson LSD: 6 20. Pickerington: 6 21. Hamilton LSD: 7 22. Lancaster CSD: 7 23. Newark CSD: 7 24. Pickerington LSD: 7 25. Upper Arlington CSD: 7 26. Whitehall: 7 27. Beechwold/Clintonville: 8 28. Gahanna: 8 29. Delaware CSD: 9 30. South Western CSD: 9 31. Blacklick: 10 32. Columbus: 10 33. Johnstown-Monroe LSD: 10 34. Gahanna Jefferson LSD: 12 35. Dublin CSD: 13 36. Grove City: 13
The “Top 10” became the Top 36 just given that most of the local markets are selling so similarly quickly. There is relatively little spread between the fastest and slowest-selling markets, with some obvious exceptions.
Top 10 Slowest-Selling Locations by # of Days Homes Remain on the Market Before Sale in May 2022 1. Northridge LSD: 84 2. Downtown: 75 3. New Albany: 29 4. Buckeye Valley LSD: 28 5. Granville CSD: 27 6. Teays Valley LSD: 27 7. London CSD: 26 8. Short North: 25 9. Jonathan Alder LSD: 22 10. Big Walnut LSD: 20 11. New Albany LSD: 19 12. Obetz: 19 13. Pataskala: 19
Top 10 Locations with the Greatest % Decline of # of Days on the Market Before Sale May 2022 vs. May 2021 1. Bexley: -76.0% 2. Jefferson LSD: -73.9% 3. Lancaster CSD: -72.0% 4. Dublin: -68.4% 5. Johnstown-Monroe LSD: -64.3% 6. Grandview Heights: -62.5% 7. Reynoldsburg CSD: -58.3% 8. Short North: -51.0% 9. Hamilton LSD: -50.0% 10. Hilliard: -50.0% 11. Westerville: -50.0% 12. Hilliard CSD: -44.4%
Top 10 Locations with the Lowest % Decline of # of Days on the Market Before Sale May 2022 vs. May 2021 1. Northridge LSD: +1,300.0% 2. Jonathan Alder LSD: +633.3% 3. Valleyview: +400.0% 4. London CSD: +188.9% 5. New Albany: +141.7% 6. New Albany LSD: +111.1% 7. Downtown: +92.3% 8. Granville CSD: +80.0% 9. Circleville CSD: +77.8% 10. Teays Valley LSD: +68.8%
% Change for the # of Days Homes Remain on the Market Before Sale Across the Metro Overall: 15.6 Overall Metro Days on Market % Change May 2022 vs May 2021: -1.3%
Columbus Realtors offers monthly housing reports and other data back several years.
One of the big factors in determining both relocations and local quality of life is crime rates by city. These rates give people an idea, or at least the perception, of which cities are safe and which are not. In this first part of a series, we take a look at violent and property crime rates for all US cities with populations at or above 250,000.
To make the comparison, I used the FBI’s Uniform Crime data, which generally goes back to the 1980s. I won’t be going back quite that far, but I will compare 3 different more recent years for each city and rank them.
Some caveats with the data: UCI collects voluntary data, so cities provide the data themselves to the FBI rather than the FBI collecting it directly. This means that cities can potentially fudge the data if they want to by reporting fewer crimes than actually occurred. Cities, especially those in high tourism states, have some incentive to do this given perceived safety is extremely important to economic outcomes. That said, it’s not exactly a free-for-all reporting system, either. There are certain standards that have to be met for data to be accepted, and reported numbers are occasionally rejected and not included in the UCI data.
In any case, this is going to be a big post, so bear with me!
In the above ranking, red cities were those that saw their violent crime rankings worsen vs. the previous decade, while blue cities have seen their rankings improve vs. the previous decade. Black cities are those that saw no ranking change. Keep in mind that although rankings may have changed for the better or worse, their actual violent crime rates may have moved in the opposite direction.
Top 25 Best Violent Crime Rate Changes By Period 2000-2010————————-2010-2020————————-2000-2020 1. Tampa: -1456.4—————–1. Atlanta: -1099.3—————–1. Atlanta: -2511.7 2. Atlanta: -1412.40—————2. Philadelphia: -851.2————2. Miami: -1575 3. Orlando: -1031.1—————3. Las Vegas: -774.9————–3. Tampa: -1552.4 4. Baltimore: -957.3—————4. Miami: -623.3——————–4. Orlando: -1290.7 5. Miami: -951.7——————–5. Newark: -562.1——————5. Philadelphia: -1139.8 6. Los Angeles: -793.3————6. Buffalo: -446.1——————-6. Baltimore: -997.5 7. Charlotte: -721——————7. Pittsburgh: -440.9—————7. St. Petersburg: -937.1 8. Dallas: -584.9——————–8. St. Petersburg: -440.8——–8. Jersey City: -790.7 9. Portland: -554.3—————–9. Jersey City: -340.1————-9. Chicago: -638.5 10. Chicago: -552.8————–10. N. Las Vegas: -337.9———10. Los Angeles: -619 11. Nashville: -514.4————-11. Cincinnati: -336.4————–11. Boston: -598.4 12. St. Petersburg: -496.3——12. Oakland: -321——————12. Portland: -545.9 13. Newark: -454.9—————13. Indianapolis: -302————-13. N. Las Vegas: -527.2 14. Jersey City: -450.6———-14. Boston: -297.8——————14. Washington DC: -517 15. Jacksonville: -450.3———15. Orlando: -259.6—————–15. Pittsburgh: -498.2 16. Kansas City: -399————16. Lexington: -259.5————–16. Nashville: -492.6 17. Lubbock: -385.1————–17. Washington DC: -250.9——17. Charlotte: -473.3 18. Albuquerque: -358.8——–18. Oklahoma City: -207.1——–18. Dallas: -467 19. New York: -352.1————19. Sacramento: -205.8————19. El Paso: -460.7 20. El Paso: -339.2————–20. San Francisco: -164.9———-20. Jacksonville: -439.3 21. St. Louis: -335.8————-21. Laredo: -157.9——————-21. Lexington: -401.4 22. Raleigh: -311.3—————22. Lincoln: -142.7——————22. New York: -400.5 23. Riverside: -309.7————23. Columbus: -136.1————–23. Raleigh: -337.8 24. New Orleans: -309.4——-24. Detroit: -129.5——————-24. Buffalo: -318.4 25. Boston: -300.6—————25. Stockton: -128.6—————-25. Riverside: -312.9
It’s somewhat surprising just how dangerous many Sun Belt cities were in the early 2000s- and still are in some cases- despite never earning nearly any negative reputation that cities like Chicago, New York, Philly and others had. Even today, cities like Chicago are constantly mentioned for being a violent city, but yet Las Vegas, Miami, Houston, Orlando, Indianapolis and many other cites all have higher violent crime rates. It’s a classic example of both how perception is often not supported by the evidence, and how media can push skewed narratives. Looking at Ohio cities, specifically, the picture overall is not great. Both Cleveland and Toledo are in the top 25 cities with the highest violent crime rates, and both rates increasing. Cincinnati was somewhat all over the place, with its rate skyrocketing 2000-2010, but then plummeting 2010-2020 to fall out of the top 25. Columbus, meanwhile, has been in a consistent- if not slower- decline that put it outside of the top 50 by 2020.
Overall, the majority of cities saw their violent crime rates fall between 2000-2020. This, again, goes contrary to the existing narrative that cities are becoming more dangerous. The pandemic and its economic effects have caused some spikes in some places, but long-term, it remains to be seen if these trends continue or abate.
In upcoming posts, we will examine cities by both homicide rates and property crime rates. Stay tuned!
These Columbus Christmases past photos give a short walk down memory lane of one of the most popular and favorite holidays.
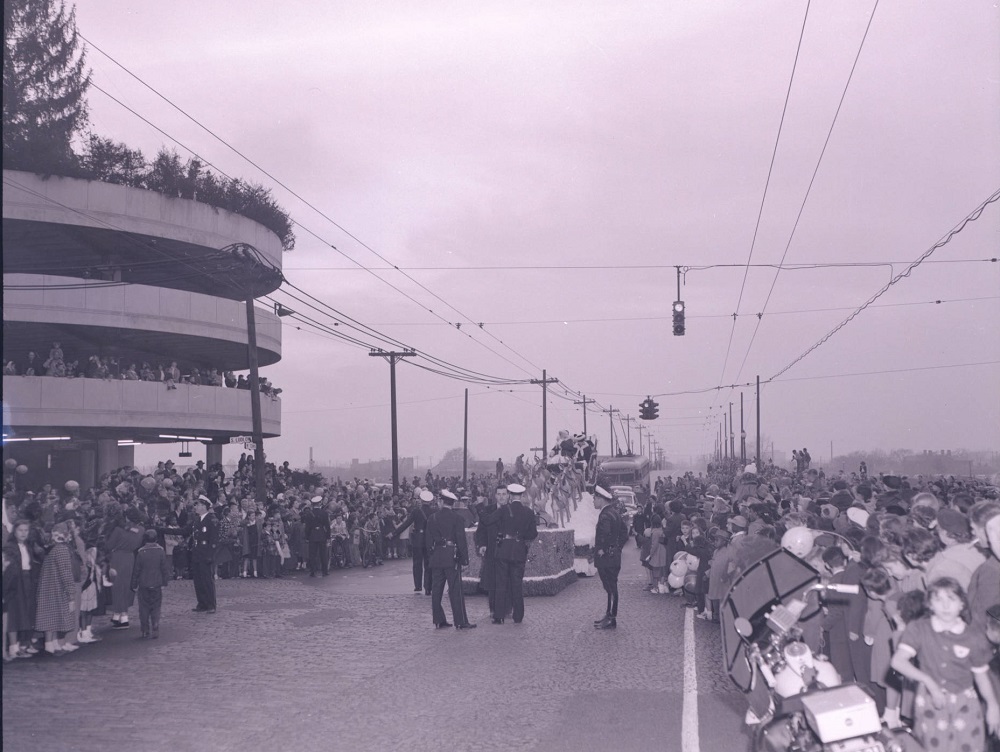
Date: 1952 Location: Corner of W. Town Street and S. Ludlow Street along the Scioto River. Santa and Mrs. Claus ride on a float in the annual Lazarus Christmas parade.
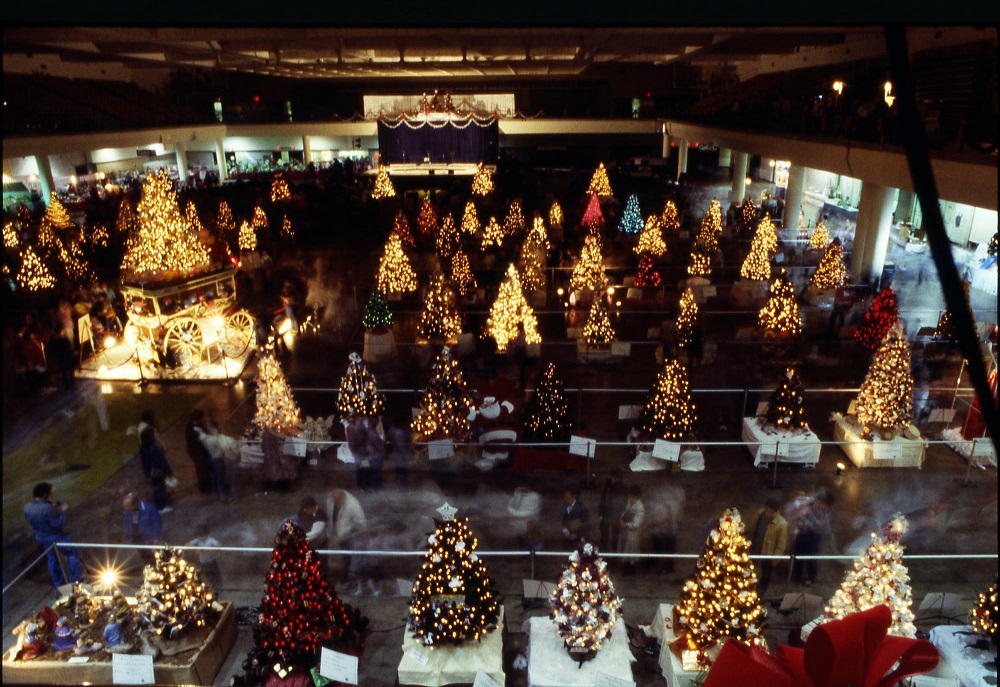
Date: 1980 Location: Ohio Expo Center Multipurpose Building at 717 E. 17th Avenue. The Festival of Trees was an annual event sponsored by Children’s Hospital and Nationwide for charities. In 1980, there were 82 themed Christmas trees on display, which people could buy for at prices up to $1,000 each.
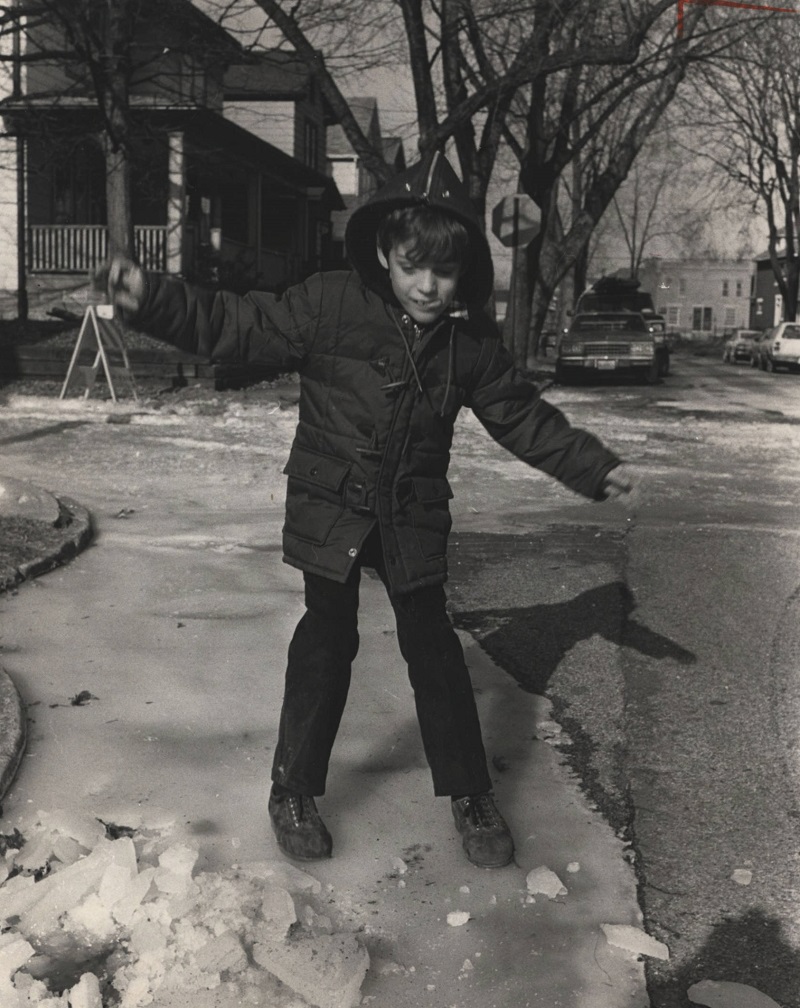
Date: Christmas Day, 1983 Location: Corner of Ebner and Columbus Street, German Village Christmas 1983 was one of the coldest on record, with a high of just 1 degree above zero and an average temperature of -6. The cold caused water mains to burst in several locations, including in German Village, which some children took advantage of for a little fun.
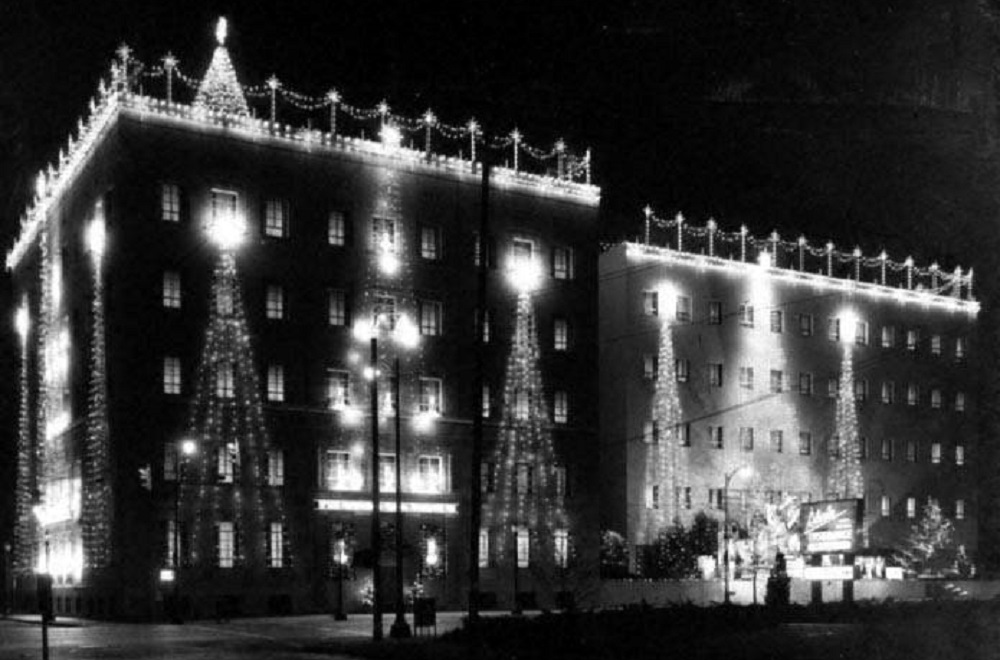
Date: 1965 Location: 518 E. Broad Street State Auto Mutual Insurance began holding a Christmas lighting event every year beginning in 1931.
Date: Around 1955 Location: Lazarus Department Store, South High Street Lazarus was famous for its window Christmas displays for well over 100 years, with many being very elaborate. The Christmas displays continued until the 2000s.
Date: 1992 Location: Scioto Riverfront, Downtown The replica of Christopher Columbus’ Santa Maria, decorated for Christmas in the photo, sat in Battelle Riverfront Park from 1991 until it was permanently dismantled during construction of Scioto Greenways in 2014.
This link is continuously being updated because there are thousands and thousands of historic buildings in the Columbus area. I am focusing on just those within I-270. Information includes the address or name of the building, the year or approximate time built, height in stories, original and current uses, as well as whether or not it is on the National Register of Historic Buildings. If so, I included the year that it was added to the Register.
The buildings on the map go all the way back to 1804 and run through 1925.
Because this map is a work in progress, the link will be permanent under the City Resources links on the home page. Keep checking back to see more places being added over time.