It’s hard to imagine Columbus without its flagship university. While today Ohio State is one of the nation’s largest universities and a powerful influence in and out of Columbus in many ways, it got its start as just a humble agricultural college in 1870. Let’s go back to a time and look at these Ohio State campus aerials from 1919, and compare them to the same views today.
Before
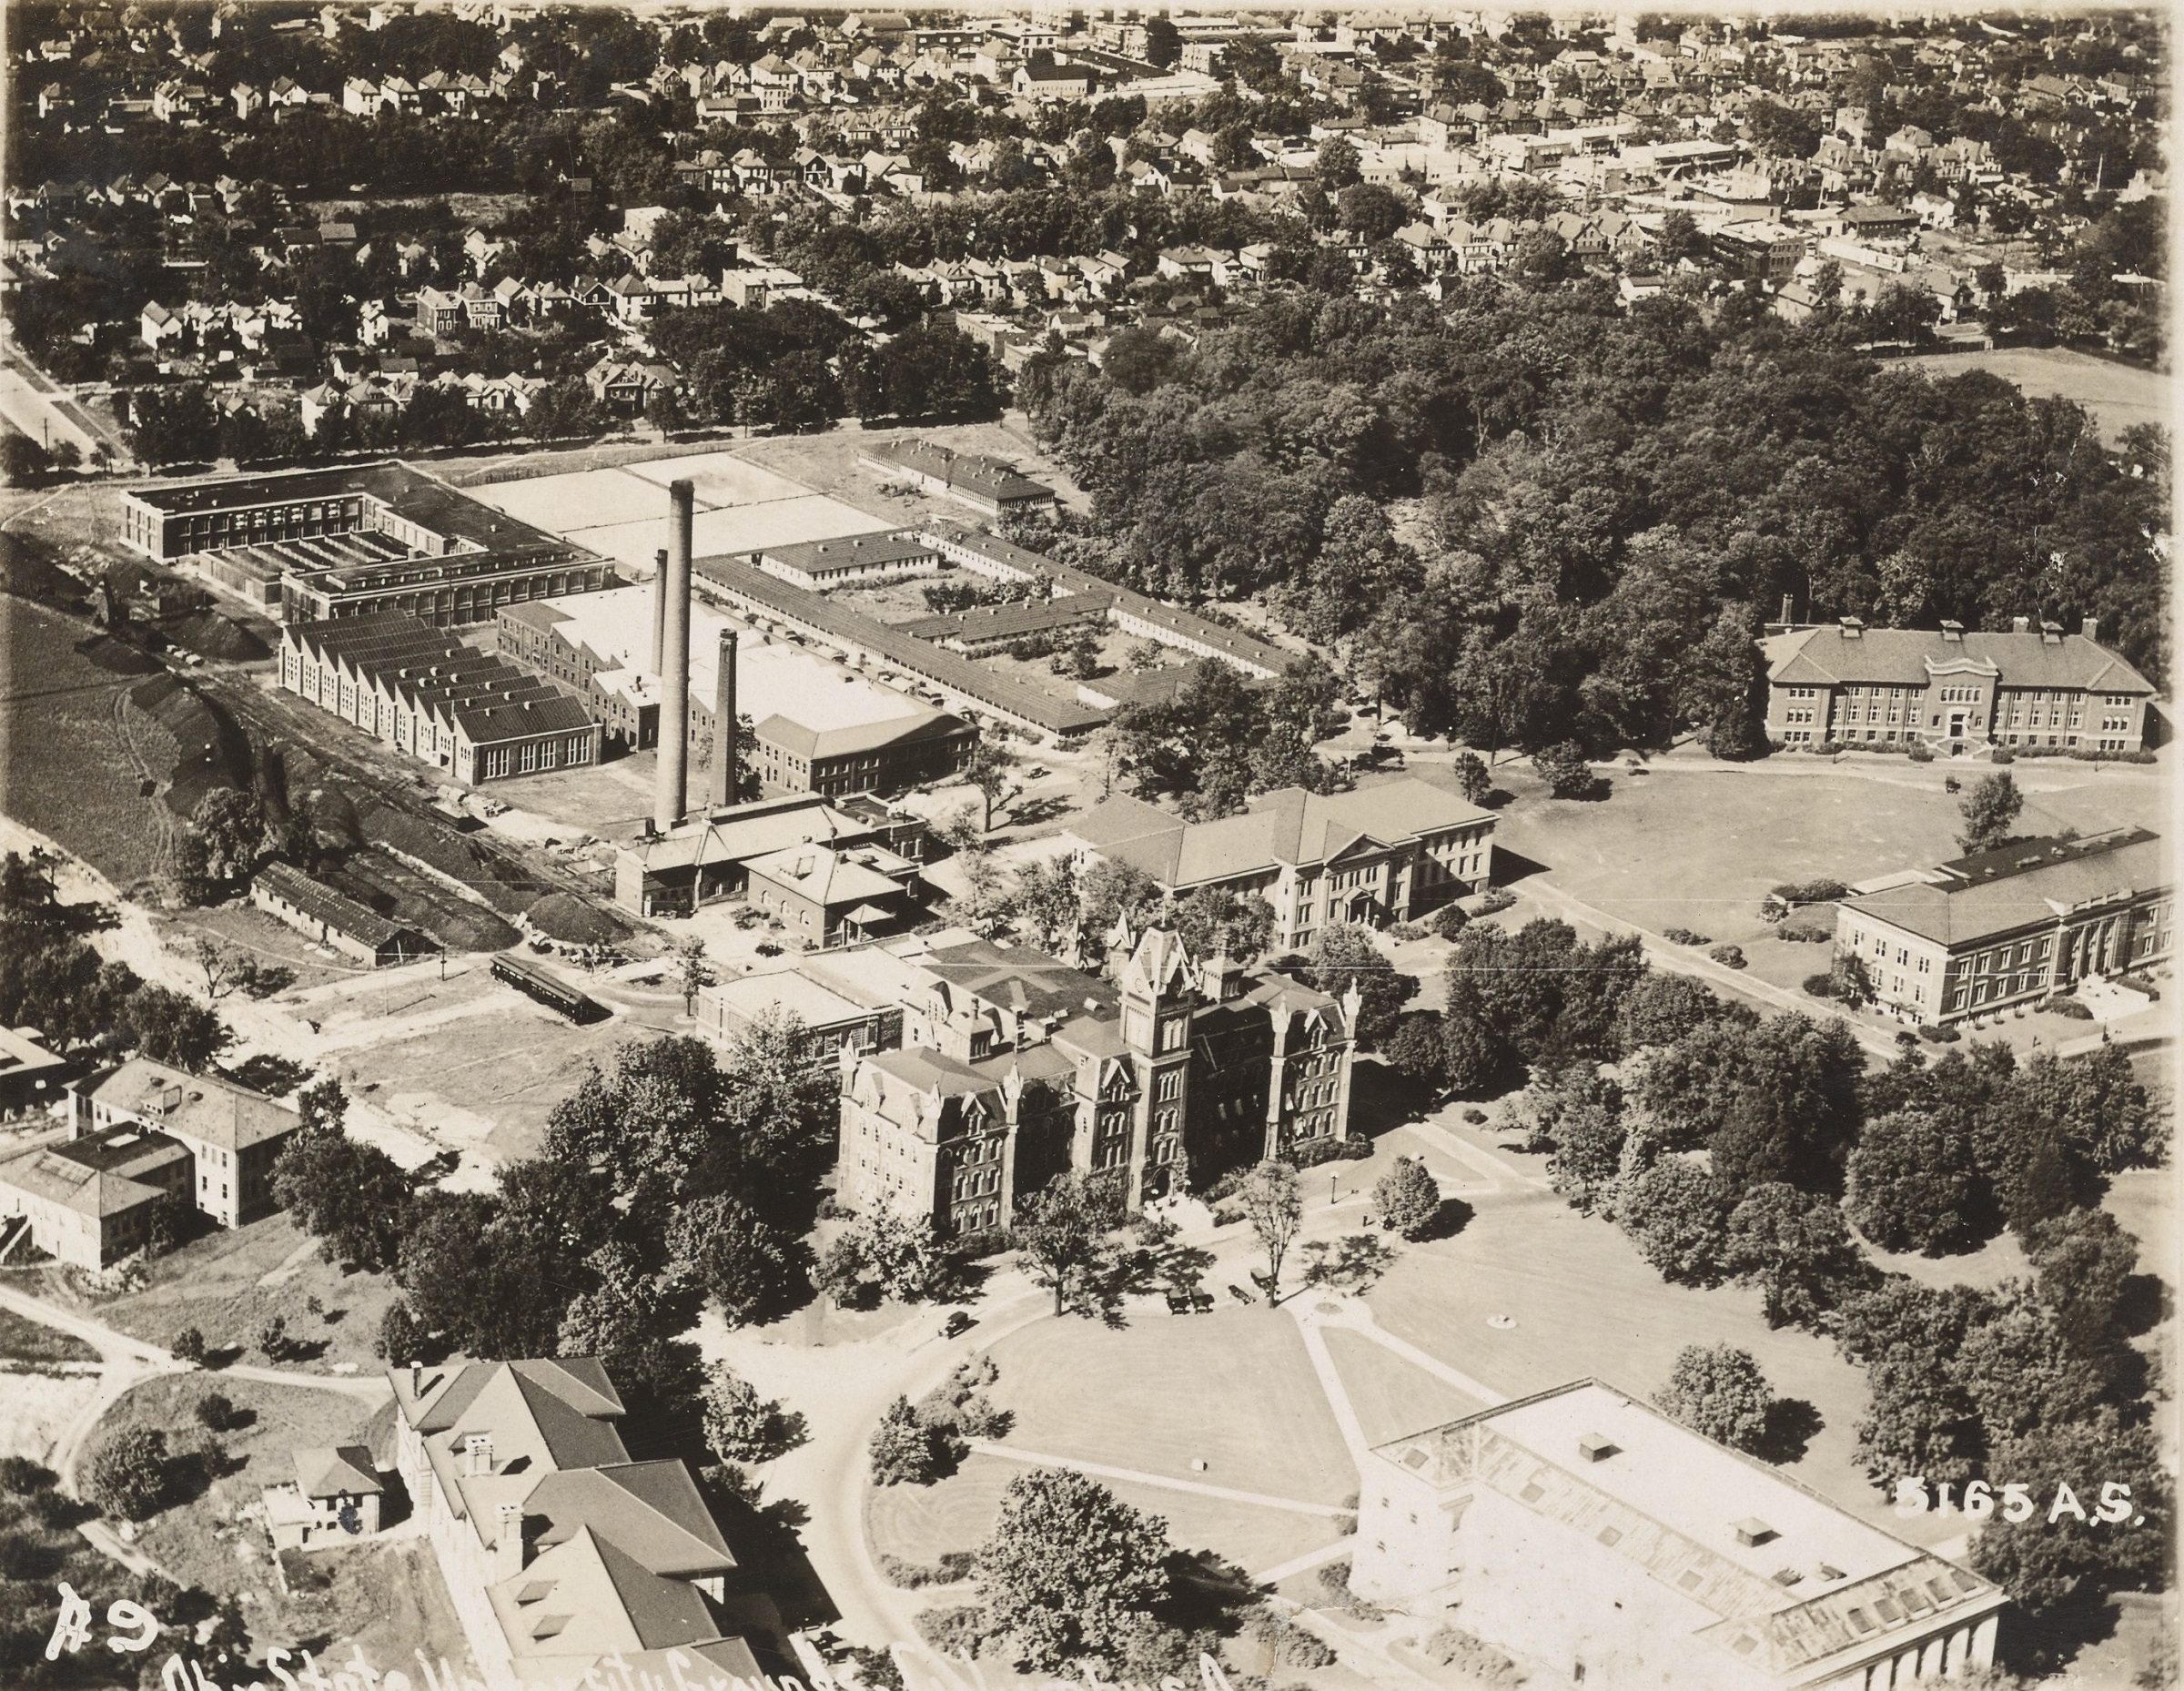
Photo taken in 1919.
This 1919 photo of the Oval and the surrounding neighborhood shows just how small the campus was back then. Residential areas began just to the north of of the Oval. Over the years, almost every single building in this photo would be demolished in OSU’s never-ending quest to expand and modernize. After
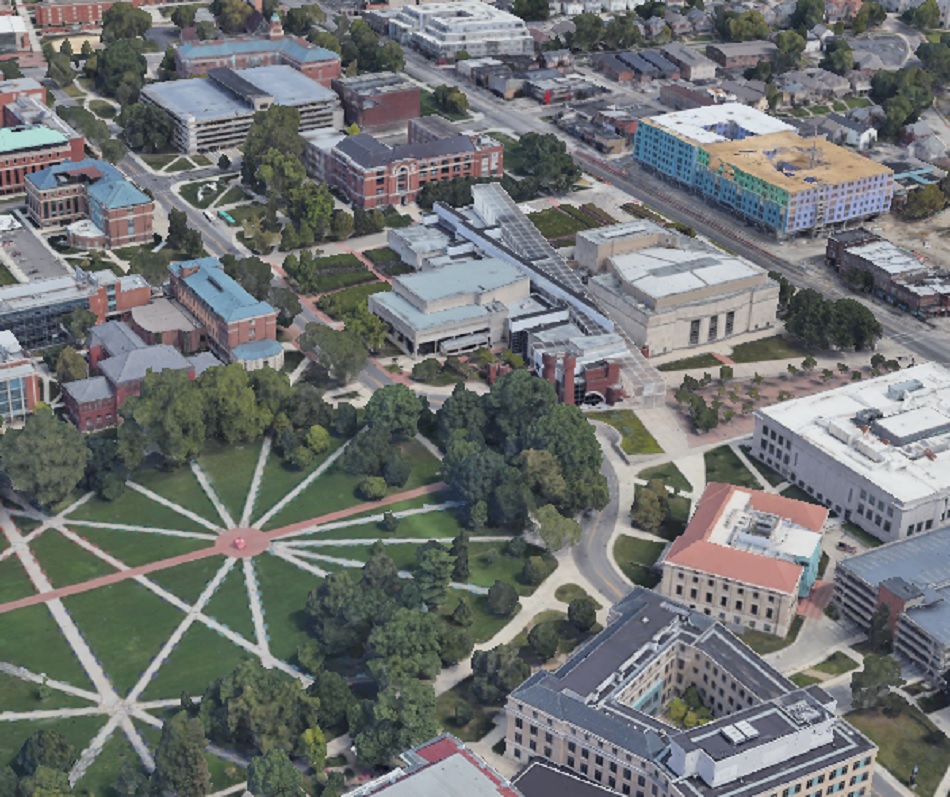
Photo taken in 2019.
The residential neighborhood is long gone, replaced with new student residences, offices and educational buildings. Almost nothing remains the same- even the street grid itself has been dramatically altered. Before
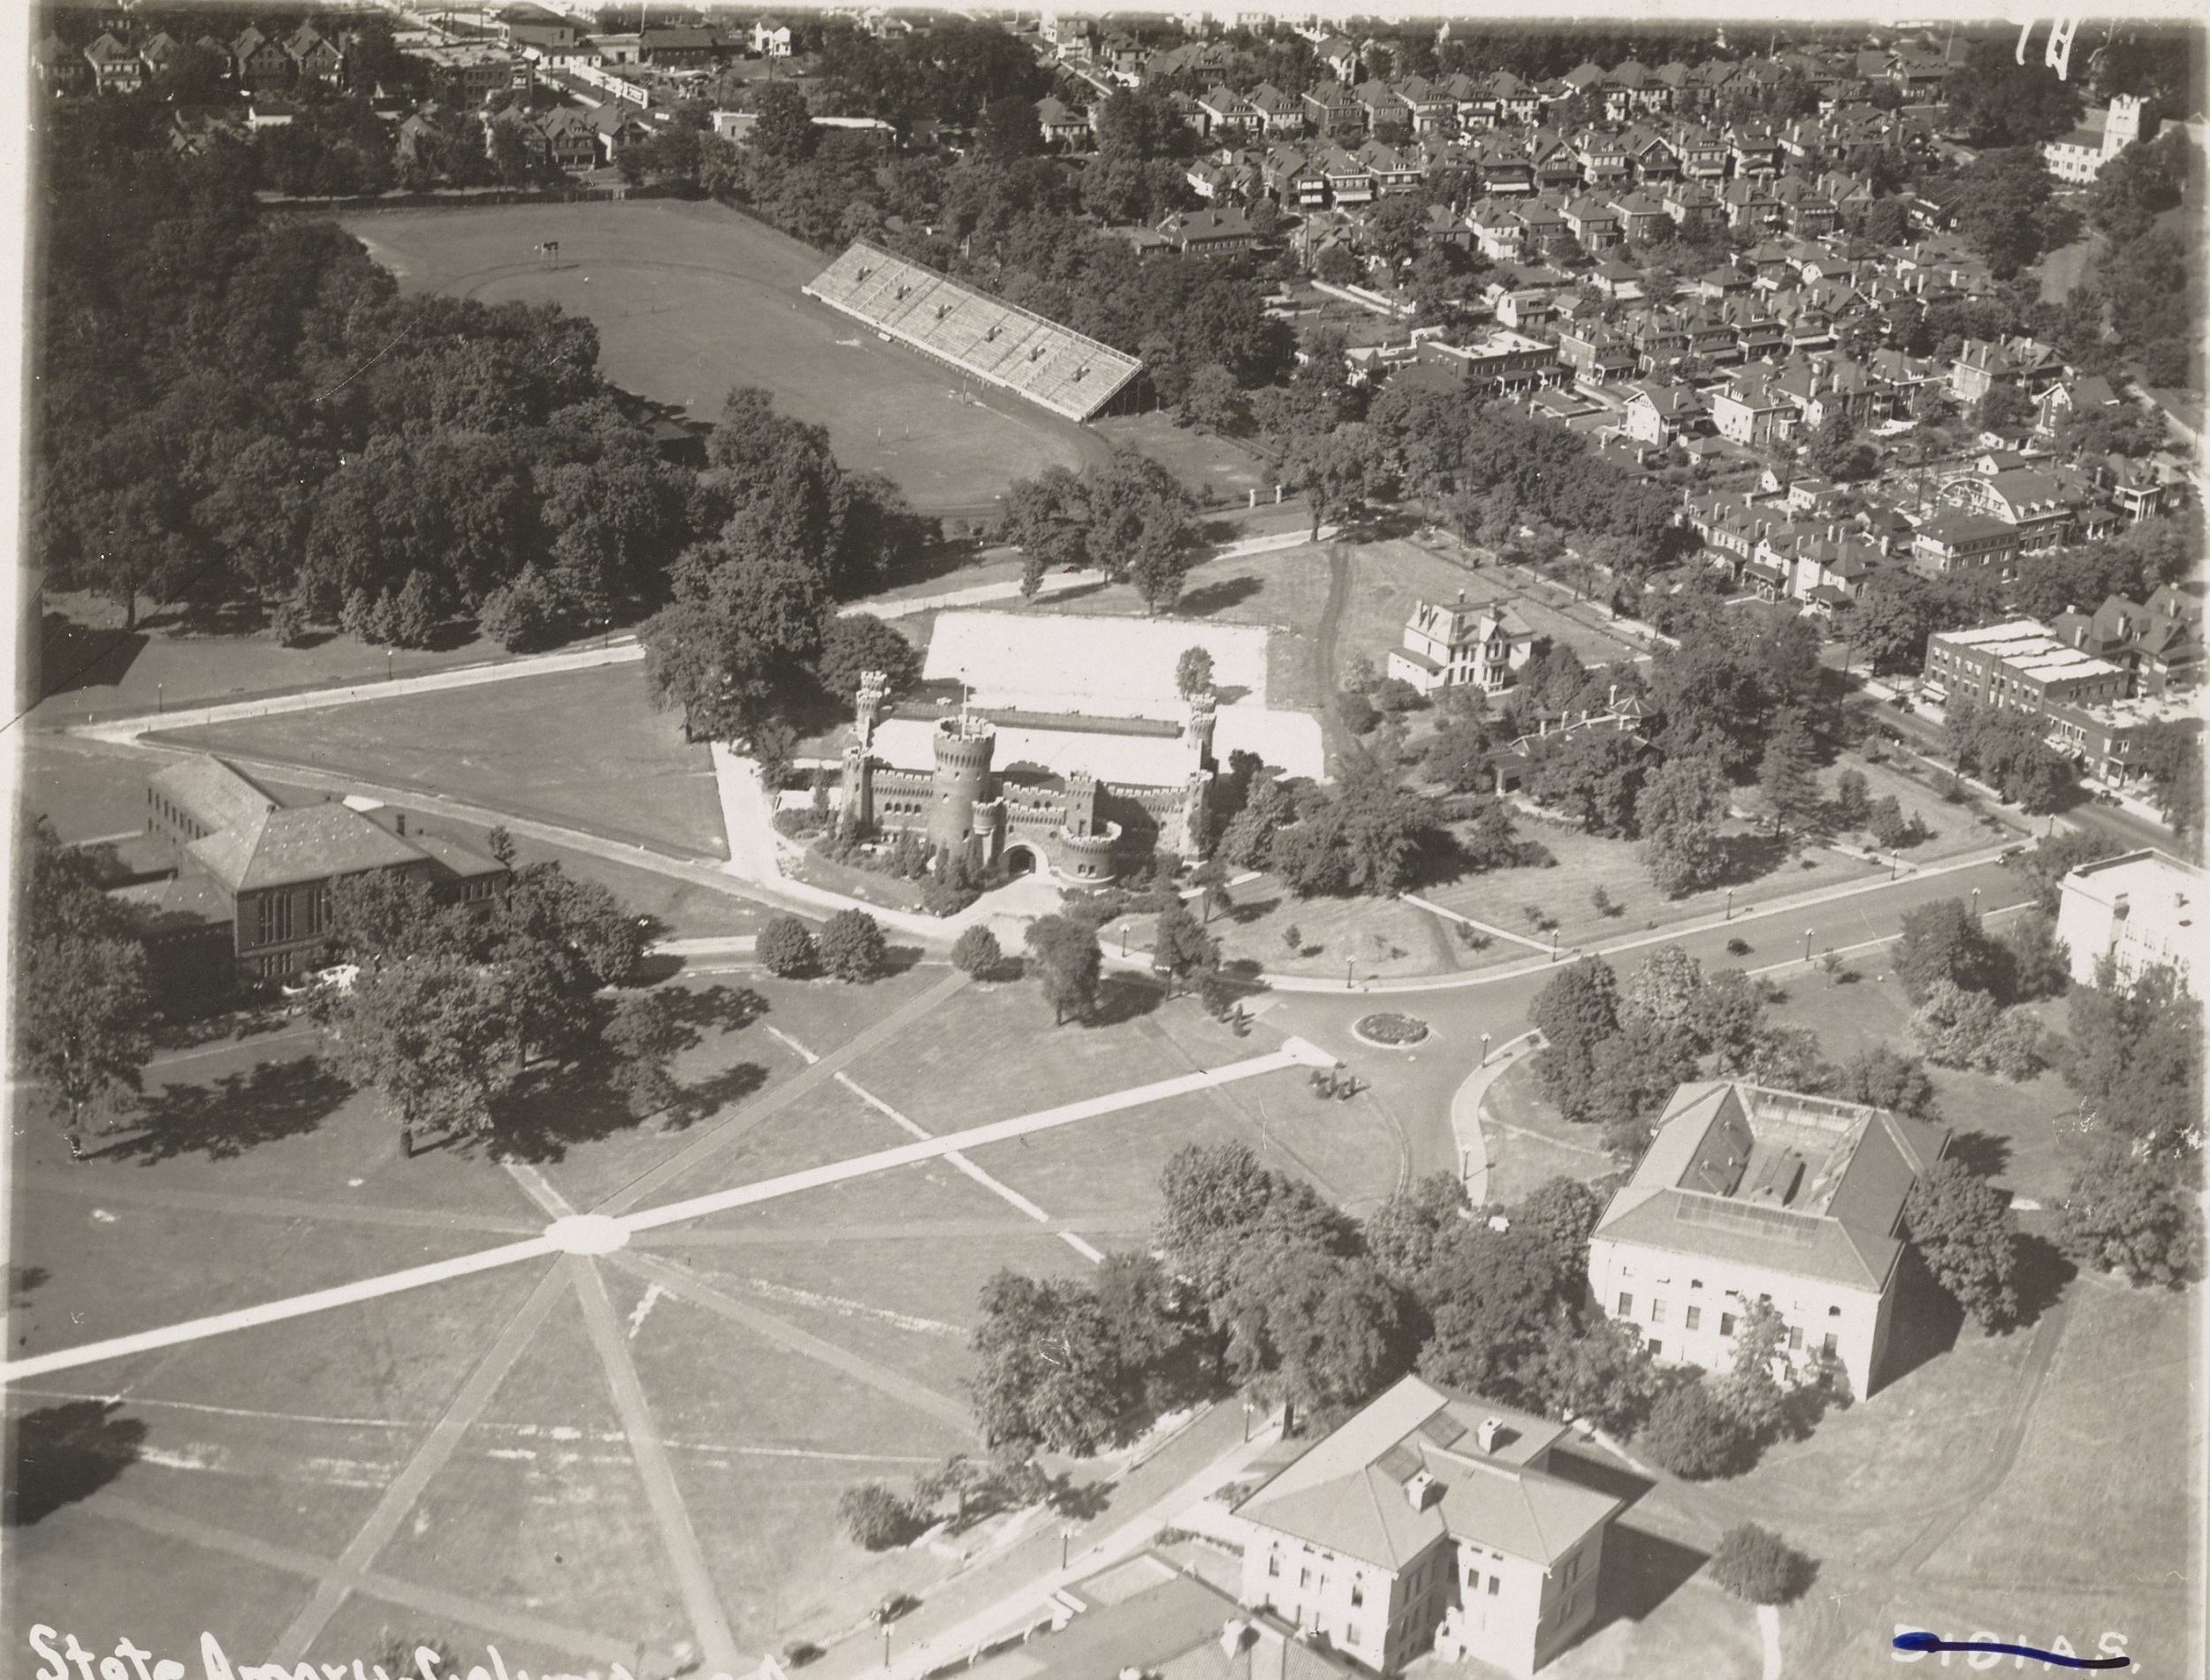
Photo taken in 1919.
This photo of Campus further east show the famous castle-looking Armory, along with an athletic field and part of High Street. After Some buildings remain recognizable, but not many. The athletic field disappeared by the 1930s, and the Armory burned down in disastrous fire in the early 1950s. It iconic castle towers were recreated somewhat in the Wexner Center for the Arts, which occupies the former Armory location.
Clearly, Ohio State’s campus has changed drastically over the last century. No doubt a century from now, it will be equally as unrecognizable to us as the current iteration would be to students from long ago.
The local housing market update May 2021 is finally out, and the trends continue to show a strong sellers market. Prices continued to accelerate upward and supply continued to lag way behind, pushing home sales to occur even faster than they have been in recent months.
Note: LSD= Local School District, CSD= City School District. In both cases, school district boundaries differ from city boundaries.
Top 15 Most Expensive Locations By Median Sales Price in May 2021 1. New Albany: $810,000 2. German Village: $630,000 3. New Albany Plain LSD: $570,000 4. Dublin: $528,750 5. Bexley: $497,500 6. Upper Arlington CSD: $495,000 7. Worthington: $461,420 8. Powell: $460,000 9. Dublin CSD: $450,000 10. Olentangy LSD: $445,000 11. Buckeye Valley LSD: $406,790 12. Granville CSD: $402,500 13. Short North: $400,450 14. Grandview Heights: $394,000 15. Jonathan Alder LSD: $390,000
New Albany proper posted an astronomical median price in May, reaching unprecedented numbers for a Columbus suburb.
Top 15 Least Expensive Locations by Median Sales Price in May 2021 1. Whitehall: $138,000 2. Valleyview: $157,500 3. Groveport Madison LSD: $175,825 4. Lancaster CSD: $176,000 5. Circleville CSD: $182,000 6. Newark CSD: $184,250 7. Jefferson LSD: $207,500 8. Columbus CSD: $220,000 9. London CSD: $225,000 10. Hamilton LSD: $237,000 11. Columbus: $240,000 12. Reynoldsburg CSD: $245,500 13. South-Western CSD: $249,900 14. Canal Winchester CSD: $260,000 15. Teays Valley LSD: $268,894
In general, the further out the place from Columbus, the cheaper the location, but there are some exceptions. Whitehall and Columbus proper remain relatively affordable compared to most locations in the metro.
Overall Market Median Sales Price in May 2021: $227,088 The overall market is defined by Columbus Metro Area counties.
Top 15 Locations with the Highest Median Sales Price % Growth Between May 2020 and May 2021 1. German Village: +59.5% 2. Worthington: +54.6% 3. Obetz: +52.2% 4. New Albany Plain LSD: +40.7% 5. Hamilton LSD: +39.4% 6. Dublin CSD: +32.0% 7. Delaware CSD: +32.0% 8. Dublin: +31.4% 9. Pickerington: +30.3% 10. New Albany: +29.7% 11. Newark CSD: +29.4% 12. Worthington CSD: +29.1% 13. Westerville CSd: +28.6% 14. Pataskala: +27.0% 15. Jonathan Alder LSD: +25.8%
Top 15 Locations with the Lowest Median Sales Price % Growth Between May 2020 and May 2021 1. Lancaster CSD: -7.3% 2. Jefferson LSD: -5.5% 3. Downtown Columbus: -4.2% 4. Hilliard: -0.5% 5. Teays Valley LSD: +3.5% 6. Powell: +5.1% 7. Big Walnut LSD: +6.2% 8. Grandview Heights: +6.8% 9. Granville CSD: +7.6% 10. Short North: +7.6% 11. Canal Winchester CSD: +8.3% 12. Minerva Park: +8.4% 13. London CSD: +10.3% 14. Circleville CSD: +11.3% 15. Buckeye Valley LSD: +11.4%
There were fewer locations down year-over-year in May than in previous months, though urban areas generally saw lower increases.
Overall Market Median Sales Price % Change May 2021 vs. May 2020: +18.6%
Top 10 Locations with the Most New Listings in May 2021 1. Columbus: 1,467 2. Columbus CSD: 972 3. South-Western CSD: 217 4. Hilliard CSD: 171 5. Westerville CSD: 168 6. Olentangy LSD: 166 7. Dublin CSD: 166 8. Worthington CSD: 118 9. Pickerington LSD: 115 10. Upper Arlington CSD: 101
Top 10 Locations with the Fewest New Listings in May 2021 1. Valleyview: 2 2. Lithopolis: 5 3. Minerva Park: 5 4. Jefferson LSD: 6 5. Obetz: 8 6. Sunbury: 8 7. Grandview Heights: 10 8. Johnstown-Monroe LSD: 11 9. Whitehall: 12 10. Circleville CSD: 14
Urban areas and major suburbs saw increases in supply versus previous months, but because sales were also stronger, it didn’t help with actual supply or prices.
Total New Listings in the Columbus Metro in May 2021: +3,468 Overall Metro New Listings % Change May 2021 vs May 2020: +14.3%
Top 10 Fastest-Selling Locations by # of Days Homes Remain on the Market Before Sale in May 2021 1. Jonathan Alder LSD: 3 2. Valleyview: 3 3. Canal Winchester CSD: 4 4. Groveport Madison LSD: 4 5. Lithopolis: 4 6. German Village: 5 7. Worthington: 5 8. Worthington CSD: 5 9. Beechwold/Clintonville: 6 10. Blacklick: 6 11. Gahanna: 6 12. Marysville CSD: 6 13. Pickerington LSD: 6 14. Powell: 6 15. Westerville CSD: 6 16. Whitehall: 6
Top 10 Slowest-Selling Locations by # of Days Homes Remain on the Market Before Sale in May 2021 1. Short North: 51 2. Downtown Columbus: 39 3. Johnstown-Monroe LSD: 28 4. Bexley: 25 5. Lancaster CSD: 25 6. Jefferson LSD: 23 7. Obetz: 22 8. Buckeye Valley LSD: 21 9. Dublin: 19 10. Olentangy LSD: 18
Top 10 Locations with the Greatest % Decline of # of Days on the Market Before Sale May 2021 vs May 2020 1. Powell: -91.2% 2. Jonathan Alder LSD: -90.6% 3. Minerva Park: -85.7% 4. Circleville CSD: -84.2% 5. Whitehall: -82.9% 6. London CSD: -80.0% 7. Sunbury: -78.9% 8. Newark CSD: -78.0% 9. Upper Arlington CSD: -76.5% 10. Granville CSD: -75.8%
Top 10 Locations with the Lowest % Decline of # of Days on the Market Before Sale May 2021 vs May 2020 1. Short North: +264.3% 2. Valleyview: +50.0% 3. Bexley: +13.6% 4. Downtown Columbus: +11.4% 5. Lancaster CSD: -3.8% 6. Teays Valley LSD: -11.1% 7. Dublin: -26.9% 8. Reynoldsburg CSD: -29.4% 9. Westerville: -33.3% 10. Pataskala: -38.5%
% Change for the # of Days Homes Remain on the Market Before Sale Across the Metro Overall: 14
The market’s sales pace only increased further in May, with the entire metro’s supply of homes selling in an average of just 2 weeks. Many locations were selling at far faster rates, however.
A handy link is the Columbus Realtors website, which most of this data is derived from.
Today’s Spring 2021 weather review shows that the season represented a significant departure from other recent years in that it was drier than average. In fact, there were fewer measurable precipitation days during the season than any other spring since 1879. Snowfall was also well below normal aside from a rare late April event. Temperatures swung wildly, with highs generally well above normal and lows slightly below normal.
1991-2020 Spring Normals Average High: 63.1 Average Low: 42.2 Mean: 52.7 Precipitation: 11.46″ Snowfall: 4.6″
2021 March-May Average High: 65.2 9th Warmest Average Low: 42.0 Tied for 29th Warmest Mean: 53.6 +0.9 20th Warmest Precipitation: 9.59″ 62nd Driest Snowfall: 1.2″ Ties for 12th Least Snowiest Average Daily Snow Depth: 0.0″ Largest Snowstorm: 1.2″ on April 21st # of 32 or Below Highs: 0 Tied for 1st Fewest # of 32 or Below Lows: 20 Tied for 12th Fewest # of 80 or Above Highs: 14 Tied for 12th Most # of 70 or Above Lows: 0 Tied for 1st Fewest # of Measurable Precipitation Days: 27 1st Fewest on Record # of Measurable Snowfall Days: 1 Tied for 2nd Fewest
Average High By Month March 2021: 59.0 7th Warmest April 2021: 64.4 Tied for 29th Warmest May 2021: 72.1 Tied for 44th Coldest
Average Low By Month March 2021: 34.7 27th Warmest April 2021: 42.0 Tied for 35th Warmest May 2021: 49.2 27th Coldest
Mean By Month March 2021: 46.9 12th Warmest April 2021: 53.2 Tied for 28th Warmest May 2021: 60.6 Tied for 32nd Coldest
Precipitation By Month March 2021: 2.85″ 54th Driest April 2021: 3.28″ 60th Wettest May 2021: 3.46″ 61st Driest
Snowfall By Month March 2021: 0.0″ Tied for Least Snowy April 2021: 1.2″ 14th Least Snowy May 2021: 0.0″ Tied for Least Snowy- Only a handful of years have had a trace or more of snow in May.
Average Snow Depth By Month March 2021: 0.0″ April 2021: 0.0″ May 2021: 0.0″
Maximum High By Month March 2021: 75 on the 24th April 2021: 83 on the 27th May 2021: 91 on the 25th
Minimum High By Month March 2021: 40 on the 15th April 2021: 37 o the 1st Mays 2021: 51 on the 9th
Maximum Low By Month March 2021: 56 on the 11th April 2021: 65 on the 28th May 2021: 69 on the 24th
Maximum Low Records -The 65 on April 28th tied the record for the date with 1914.
Minimum Low By Month March 2021: 19 on the 5th April 2021: 21 on the 2nd May 2021: 34 on the 1st
Highest Daily Precipitation By Month March 2021: 1.12″ on the 18th April 2021: 1.88″ on the 29th May 2021: 1.43″ on the 9th
Precipitation Records -The 1.88″ on April 29th was a record for the date, beating the old record of 1.82″ set in 1996. -The 1.43″ on May 9th was a record for the date, beating the old record of 1.12″ set in 1909.
Highest Daily Snowfall By Month March 2021: 0.0″ April 2021: 1.2″ on the 21st May 2021: 0.0″
Deepest Snow Depth By Month March 2021: 0.0″ April 2021: 1″ on the 21st May 2021: 0.0″
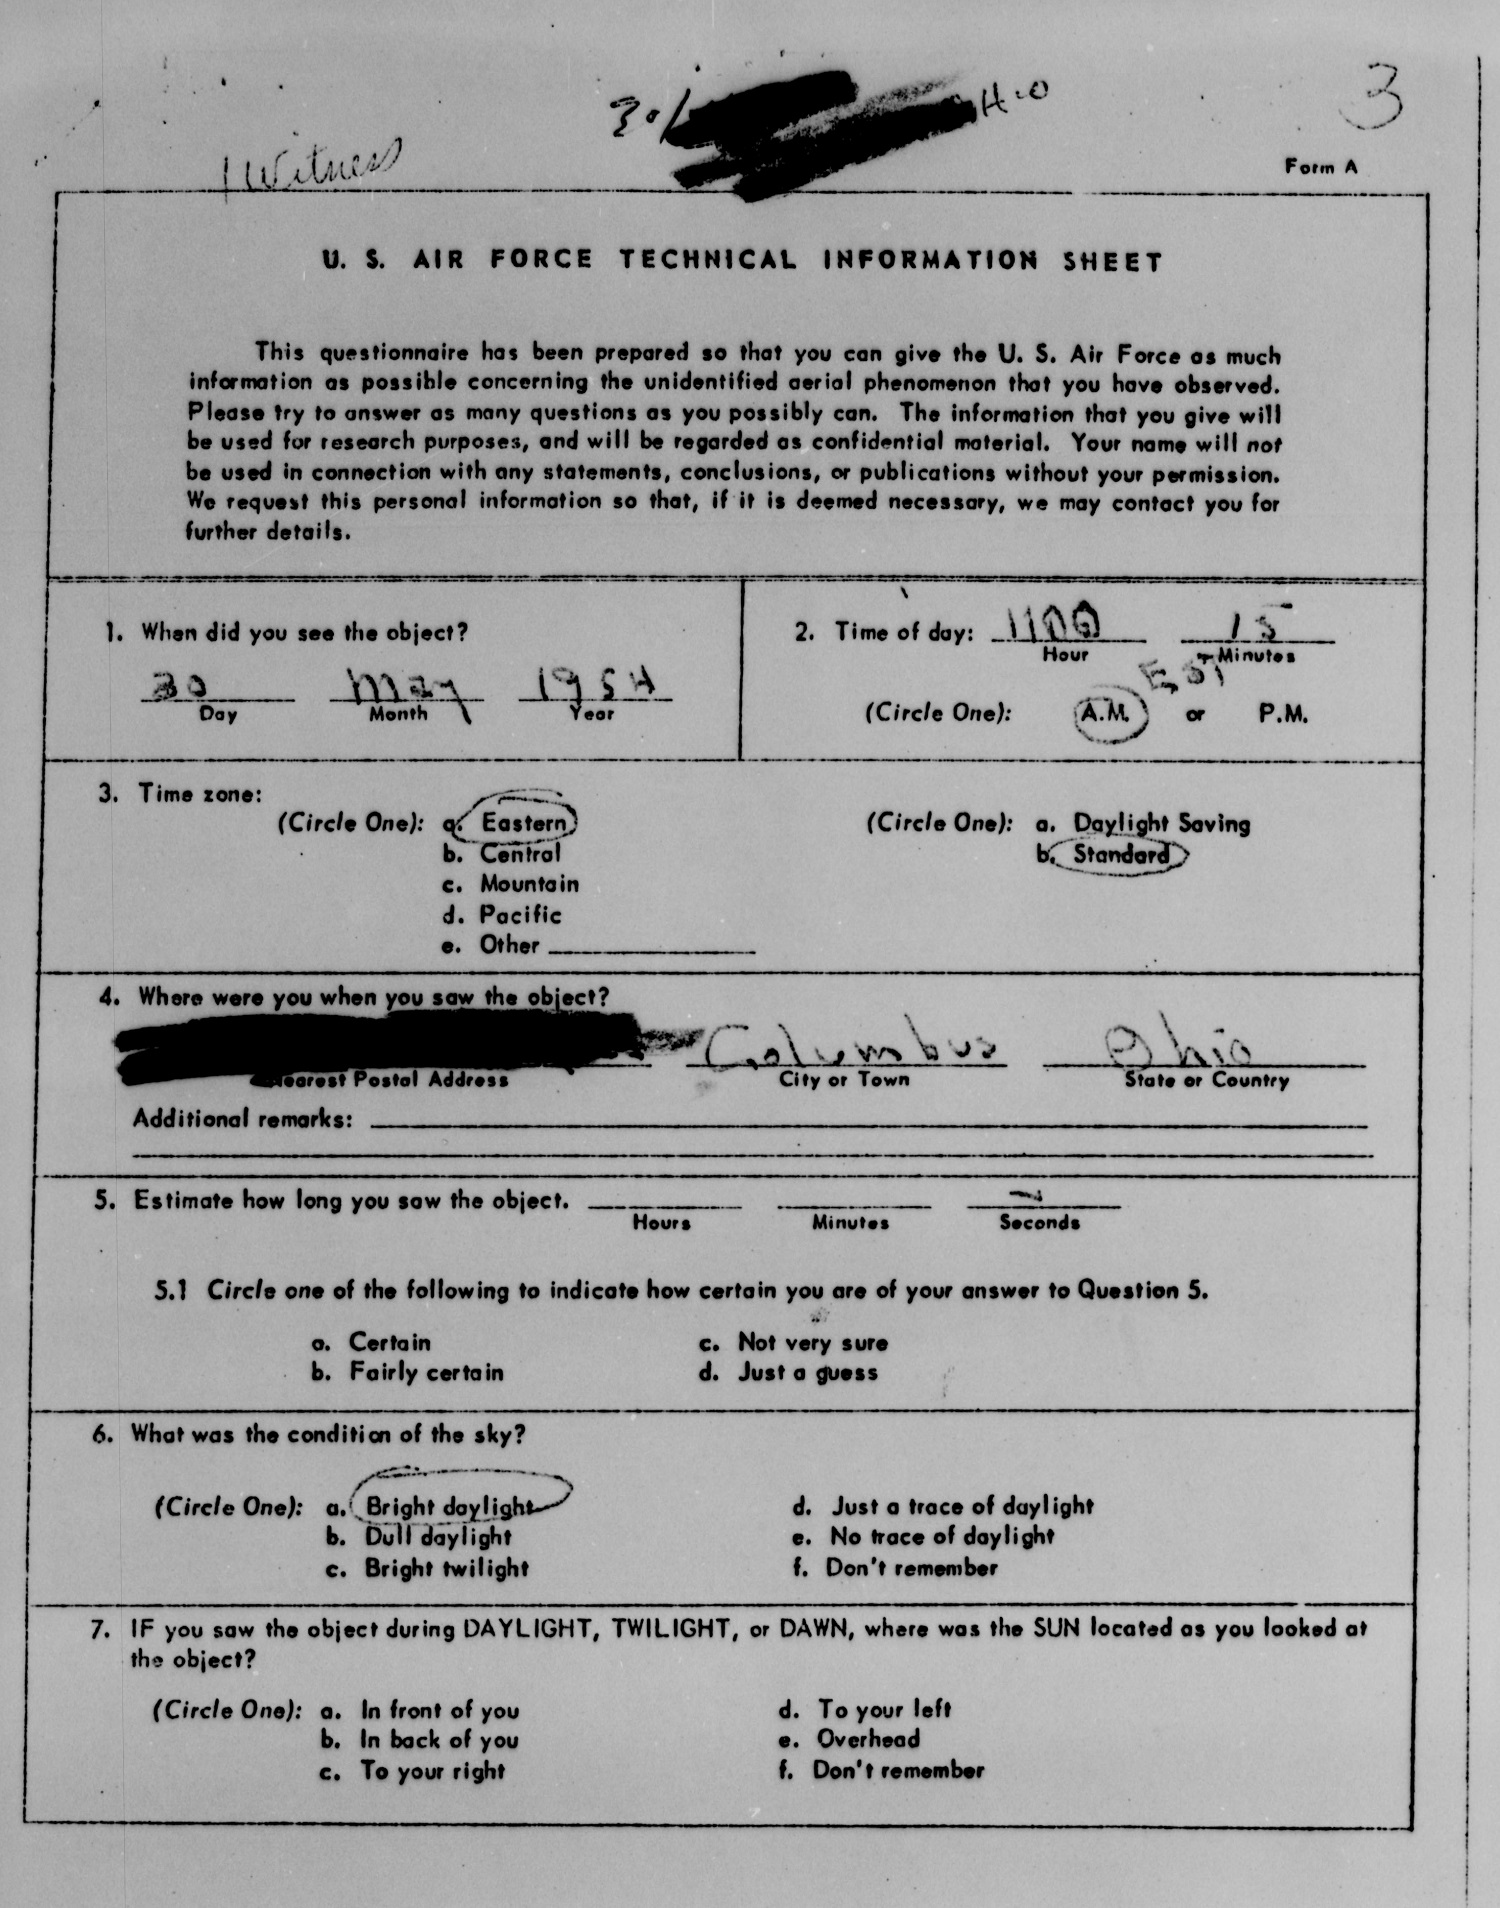
UFOs are kind of a hot topic right now. The US government has recently been releasing videos and documentation on what they acknowledge they can’t explain. The releases have begun to gain mainstream media attention, including a recent 60 Minutes report. The Pentagon is currently preparing a report to release to Congress sometime in June on these events, the contents of which could either be mundane or extraordinary. Is it a new technology from a foreign adversary? Optical illusions or natural events? Or something altogether far weirder? In the spirit of these recent news events, I thought it’d be interesting to go over some of the UFO sightings in and around Columbus over the years. This new series, Strange Columbus Things, will also highlight other types of weird local phenomenon throughout history. I hope to give a new post in this series 1-2 times per month.
The UFO events come from declassified files of the infamous Project Blue Book, which ran from the late 1940s to 1969. For the most part, the Blue Book files will just be scanned photos of the actual reports, with only occasional commentary.
This event was never explained due to a lack of information.
To view other information on global incidents, go here. UFO Database
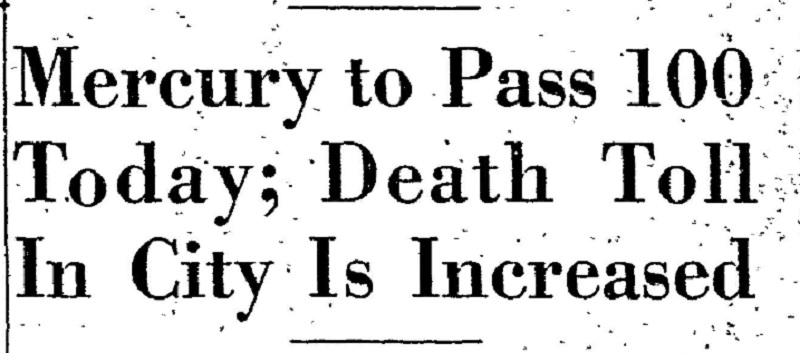
What are the worst heat waves in history? The climate in Ohio is gradually getting warmer and wetter, and persistent record heat is becoming ever more common, but do recent heatwaves compare to those of the past? Let’s find out.
To find out what the worst heatwaves were, I looked at average temperatures for different consecutive time periods- 2 days, 3 days, 7 days, 10 days, 14 days and 30 days. Unsurprisingly, some historically hot summers popped up, particularly from the 1930s.
Top 10 2-Day Periods with the Warmest Average High Temperature 1. 7/21-7/22/1934: 104.5 2. 7/20-7/21/1934, 7/8-7/9/1936, 7/11-7/12/1936, 7/13-7/14/1936: 103.5 3. 7/24-7/25/1934, 7/25-7/26/1934, 7/9-7/10/1936: 103.0 4. 7/3-7/4/1911, 8/5-8/6/1918, 7/10-7/11/1936: 102.5 5. 7/9-7/10/1881, 7/12-7/13/1936: 102.0 6. 7/3-7/4/1897, 7/21-7/22/1901, 6/27-6/28/1944: 101.5 7. 7/6-7/7/2012: 101.0 8. 7/8-7/9/1881, 7/4-7/5/1911, 6/28-6/29/1934, 7/14-7/15/1936: 100.5 9. 7/7-7/8/1881, 8/6-8/7/1918, 7/20-7/21/1930, 7/26-7/27/1941, 7/7-7/8/1988, 7/8-7/9/1988, 7/15-7/16/1988: 100.0 10. 7/10-7/11/1881, 7/17-7/18/1887, 7/2-7/3/1911, 8/4-8/5/1918, 7/19-7/20/1930, 7/26-7/27/1936, 9/1-9/2/1953, 9/2-9/3/1953, 7/13-7/14/1954, 8/3-8/4/1955, 7/5-7/6/2012: 99.5
Top 10 3-Day Periods with the Warmest Average High Temperature 1. 7/20-7/22/1934, 7/9-7/11/1936, 7/12-7/14/1936: 103.3 2. 7/24-7/26/1934, 7/8-7/10/1936, 7/10-7/12/1936, 7/11-7/13/1936: 102.7 3. 7/8-7/10/1881: 101.3 4. 7/2-7/4/1911, 8/5-8/7/1918, 7/21-7/23/1934, 7/7-7/9/1936: 101.0 5. 7/3-7/5/1911, 7/13-7/15/1936: 100.7 6. 7/7-7/9/1881, 7/10-7/12/1881, 8/4-8/6/1918: 100.3 7. 7/9-7/11/1881, 7/23-7/25/1934, 7/7-7/9/1988, 7/5-7/7/2012: 100.0 8. 7/3-7/5/1897, 7/19-7/21/1934, 7/22-7/24/1934, 7/4-7/6/2012: 99.7 9. 7/6-7/8/1881, 7/19-7/21/1930, 9/1-9/3/1953: 99.3 10. 7/26-7/28/1941, 6/26-6/28/1944, 8/30-9/1/1953, 8/31-9/2/1953, 8/2-8/4/1955, 7/6-7/8/1988: 99.0
Top 10 7-Day Periods with the Warmest Average High Temperature 1. 7/8-7/14/1936: 103.1 2. 7/9-7/15/1936: 102.1 3. 7/20-7/26/1934, 7/7-7/13/1936: 101.7 4. 7/10-7/16/1936: 100.7 5. 7/19-7/25/1934, 7/11-7/17/1936: 100.3 6. 7/6-7/12/1881, 7/6-7/12/1936: 100.0 7. 7/21-7/27/1934: 99.4 8. 7/7-7/13/1881: 99.1 9. 7/5-7/11/1881: 99.0 10. 7/4-7/10/1881, 8/28-9/3/1953: 98.6
Top 10 10-Day Periods with the Warmest Average High Temperature 1. 7/8-7/17/1936: 101.0 2. 7/7-7/16/1936: 100.8 3. 7/6-7/15/1936: 100.2 4. 7/9-7/18/196: 99.8 5. 7/5-7/14/1936: 99.2 6. 7/4-7/13/1881: 98.0 7. 7/10-7/19/1936: 97.9 8. 7/3-7/12/1881: 97.8 9. 7/5-7/14/1881, 7/17-7/26/1934, 7/18-7/27/1934, 7/19-7/28/1934: 97.7 10. 7/6-7/15/1881: 97.4
Top 10 14-Day Periods with the Warmest Average High Temperature 1. 7/5-7/18/1936, 7/6-7/19/1936: 97.9 2. 7/4-7/17/1936: 97.6 3. 7/7-7/20/1936: 97.5 4. 7/3-7/16/1936: 97.1 5. 7/8-7/21/1936: 96.5 6. 7/2-7/15/1936: 96.0 7. 7/2-7/15/1881, 7/4-7/17/1881, 7/9-7/22/1936: 95.6 8. 7/13-7/26/1934: 95.5 9. 7/14-7/27/1934, 7/15-7/28/1934, 7/1-7/14/1936: 95.4 10. 7/16-7/29/1901, 7/17-7/30/1901: 95.1
Top 10 30-Day Periods with the Warmest Average High Temperature 1. 6/29-7/28/1936: 92.7 2. 6/28-7/27/1936: 92.6 3. 6/27-7/26/1934: 92.5 4. 6/26-7/25/1934, 6/30-7/29/1936: 92.3 5. 6/28-7/27/1934: 92.2 6. 7/6-8/4/1936, 7/13-8/11/1955: 92.1 7. 7/10-8/8/1955, 6/28-7/27/2012: 92.0 8. 6/25-7/24/1934, 6/27-7/26/1936, 7/1-7/30/1936, 7/2-7/31/1936, 7/5-8/3/1936, 7/7-8/5/1936, 7/14-8/12/1955, 6/27-7/26/2012: 91.9 9. 6/29-7/28/1934, 6/26-7/25/1936, 7/3-8/1/1936, 7/4-8/2/1936, 7/8-8/6/1955, 7/9-8/7/1955, 6/18-7/17/2012, 6/20-7/19/2012: 91.8 1. 6/25-7/24/1936, 7/23-8/21/1955: 91.7
The heat waves in 1934 and 1936 dominated for high temperatures, and for the most part, nothing before or since has really come close. 1881, 1901, 1918, 1955 and 2012, among others, all make appearances.
Now that we’ve see the worst periods for high temperature, let’s look at the worst for the mean temperature, which is the average between the high and low. Because this measurement includes the low temperatures, it could be considered the definitive look at what the absolute hottest heat waves in history really were.
Top 10 2-Day Periods with the Warmest Average Temperature 1. 7/21-7/22/1934: 92.0 2. 7/9-7/10/1881: 91.5 3. 7/9-7/10/1936: 90.5 4. 7/20-7/21/1934: 90.3 5. 7/25-7/26/1934, 7/13-7/14/1936: 90.0 6. 7/10-7/11/1881, 7/3-7/4/1911: 89.8 7. 8/5-8/6/1918, 7/20-7/21/1930: 89.3 8. 7/10-7/11/1936: 89.0 9. 7/4-7/5/1911, 7/24-7/25/1934, 7/12-7/13/1936, 7/30-7/31/1999: 88.8 10. 7/11-7/12/1881, 8/6-8/7/1918, 7/8-7/9/1936, 7/11-7/12/1936: 88.5
Top 10 3-Days Periods with the Warmest Average Temperature 1. 7/20-7/22/1934: 90.5 2. 7/8-7/10/1881: 90.3 3. 7/9-7/11/1881: 90.0 4. 7/10-7/12/1881, 7/9-7/11/1936: 89.8 5. 7/12-7/14/1936: 89.5 6. 7/21-7/23/1934: 89.3 7. 7/7-7/9/1881: 89.0 8. 8/5-8/7/1918, 7/24-7/26/1934, 7/8-7/10/1936, 7/10-7/12/1936: 88.8 9. 7/11-7/13/1936: 88.7 10. 7/3-7/5/1911, 7/13-7/15/1936: 88.5
Top 10 7-Day Periods with the Warmest Average Temperature 1. 7/8-7/14/1936, 7/9-7/15/1936: 89.1 2. 7/6-7/12/1881: 89.0 3. 7/20-7/26/1934: 88.9 4. 7/7-7/13/1881: 88.6 5. 7/5-7/11/1881, 7/10-7/16/1936: 87.9 6. 7/19-7/25/1934: 87.7 7. 7/8-7/14/1881: 87.6 8. 7/21-7/27/1934: 87.5 9. 7/7-7/13/1936: 87.4 10. 7/4-7/10/1881: 86.9
Top 10 10-Day Periods with the Warmest Average Temperature 1. 7/8-7/17/1936: 87.4 2. 7/7-7/16/1936: 87.2 3. 7/5-7/14/1881, 7/6-7/15/1881, 7/9-7/18/1936: 87.1 4. 7/4-7/13/1881: 86.9 5. 7/6-7/15/1936, 7/7-7/16/1881: 86.6 6. 7/3-7/12/1881: 86.2 7. 7/19-7/28/1934: 86.0 8. 7/18-7/27/1934, 7/10-7/19/1936: 85.7 9. 7/20-7/29/1934, 7/5-7/14/1936: 85.6 10. 7/8-7/17/1881, 7/17-7/26/1934: 85.4
Top 10 14-Day Periods with the Warmest Average Temperature 1. 7/3-7/16/1881, 7/4-7/17/1881: 85.1 2. 7/6-7/19/1936: 85.0 3. 7/5-7/18/1936: 84.9 4. 7/7-7/20/1936: 84.6 5. 7/2-7/15/1881, 7/5-7/18/1881, 7/4-7/17/1936: 84.5 6. 7/3-7/16/1936: 84.3 7. 7/6-7/19/1881, 7/8-7/21/1936, 7/18-7/31/1940: 83.9 8. 7/13-7/26/1934, 7/14-7/27/1934, 7/15-7/28/1934: 83.8 9. 7/2-7/15/1936: 83.7 10. 7/1-7/14/1881: 83.6
1934 and 1936 still dominate, but other years show up more often as well. Only 2012 shows up with anything in the last 60 years, though. That year also saw one of the worst wind events in Ohio history, partially fueled by the heat of that summer: North American Derecho of 2012
Finally, let’s look at periods that featured consecutive days with highs of 90 degrees or higher. What are the longest?
# of Consecutive Days with Highs 90 or Above 1. 7/3-7/16/1881: 14 2. 7/18-7/30/1940: 13 3. 6/24-7/5/1934, 7/7-7/18/1936, 6/28-7/9/1949, 7/21-8/1/1999, 6/29-7/10/2020: 12 4. 7/20-7/30/1901, 8/4-8/14/1918, 8/25-9/4/1953, 8/8-8/18/1988, 6/28-7/8/2012: 11 5. 7/27-8/5/1887, 9/7-9/16/1897, 7/29-8/7/1955, 6/13-6/22/1994: 10
A short video and article from 2016 about the 1936 heatwave, still the hottest in history. 1936 Heat Wave