Cool Link Columbus Ghost Tours


Do you enjoy a good scare combined with learning about local history? This Columbus Ghost Tours link may be for you. Now that Halloween is just around the corner, it’s as good a time as any to go on a guided tour through some of Columbus’ best haunts and hear creepy stories about people and events from days gone by.

Columbus Ghost Tours

Strange Columbus September 24, 1960 UFO


Strange Columbus September 24, 1960 UFO Columbus, Ohio

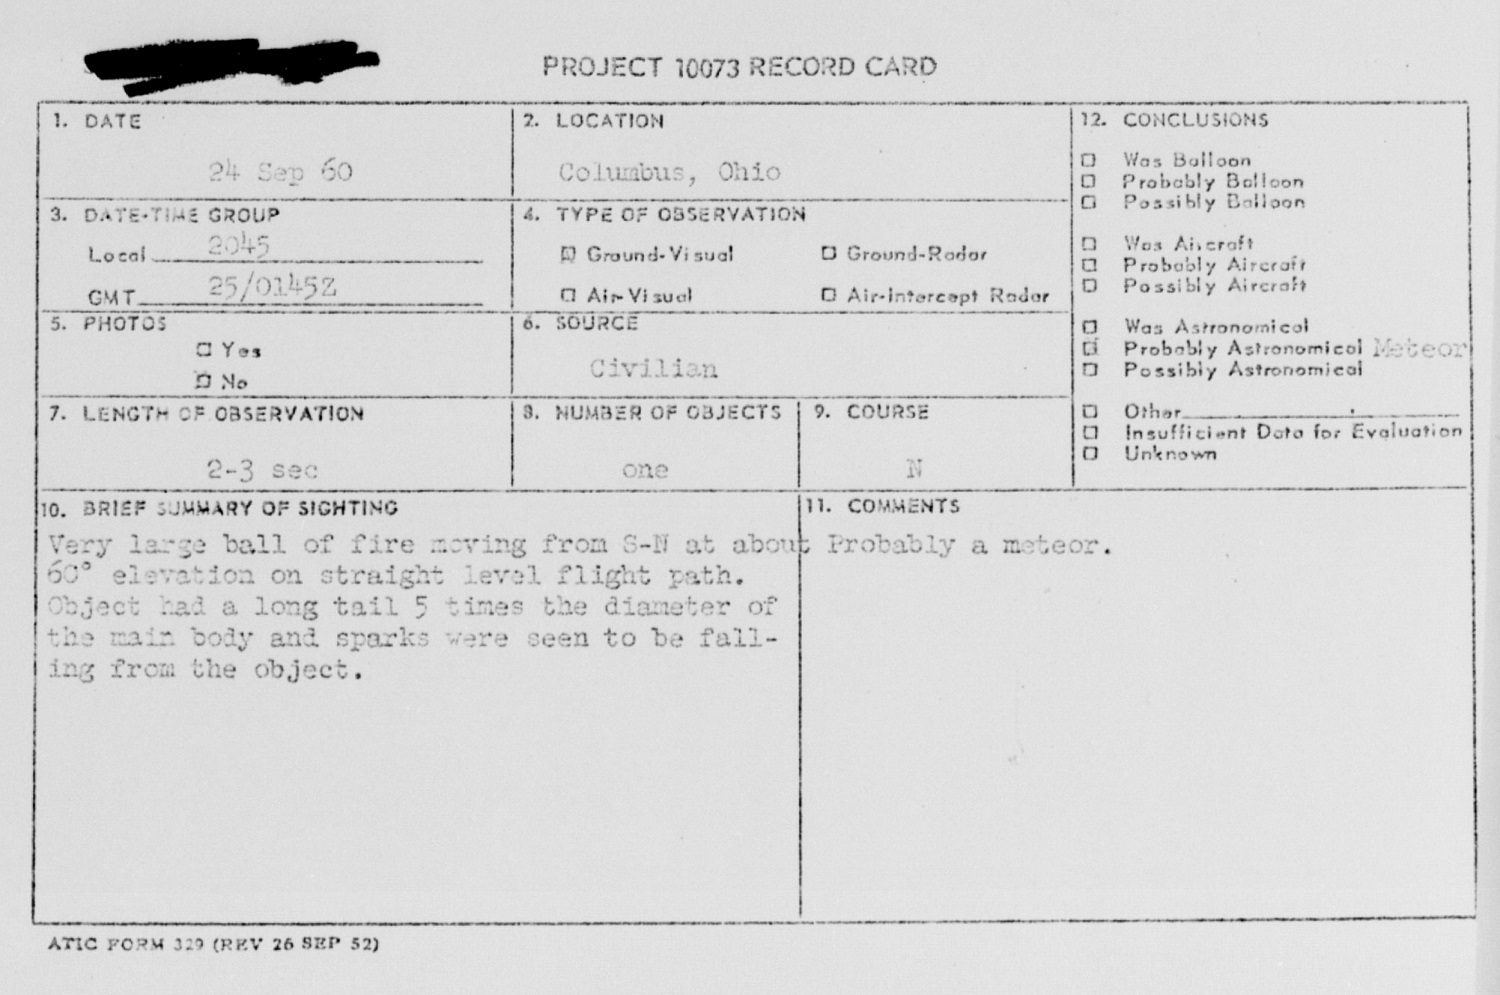
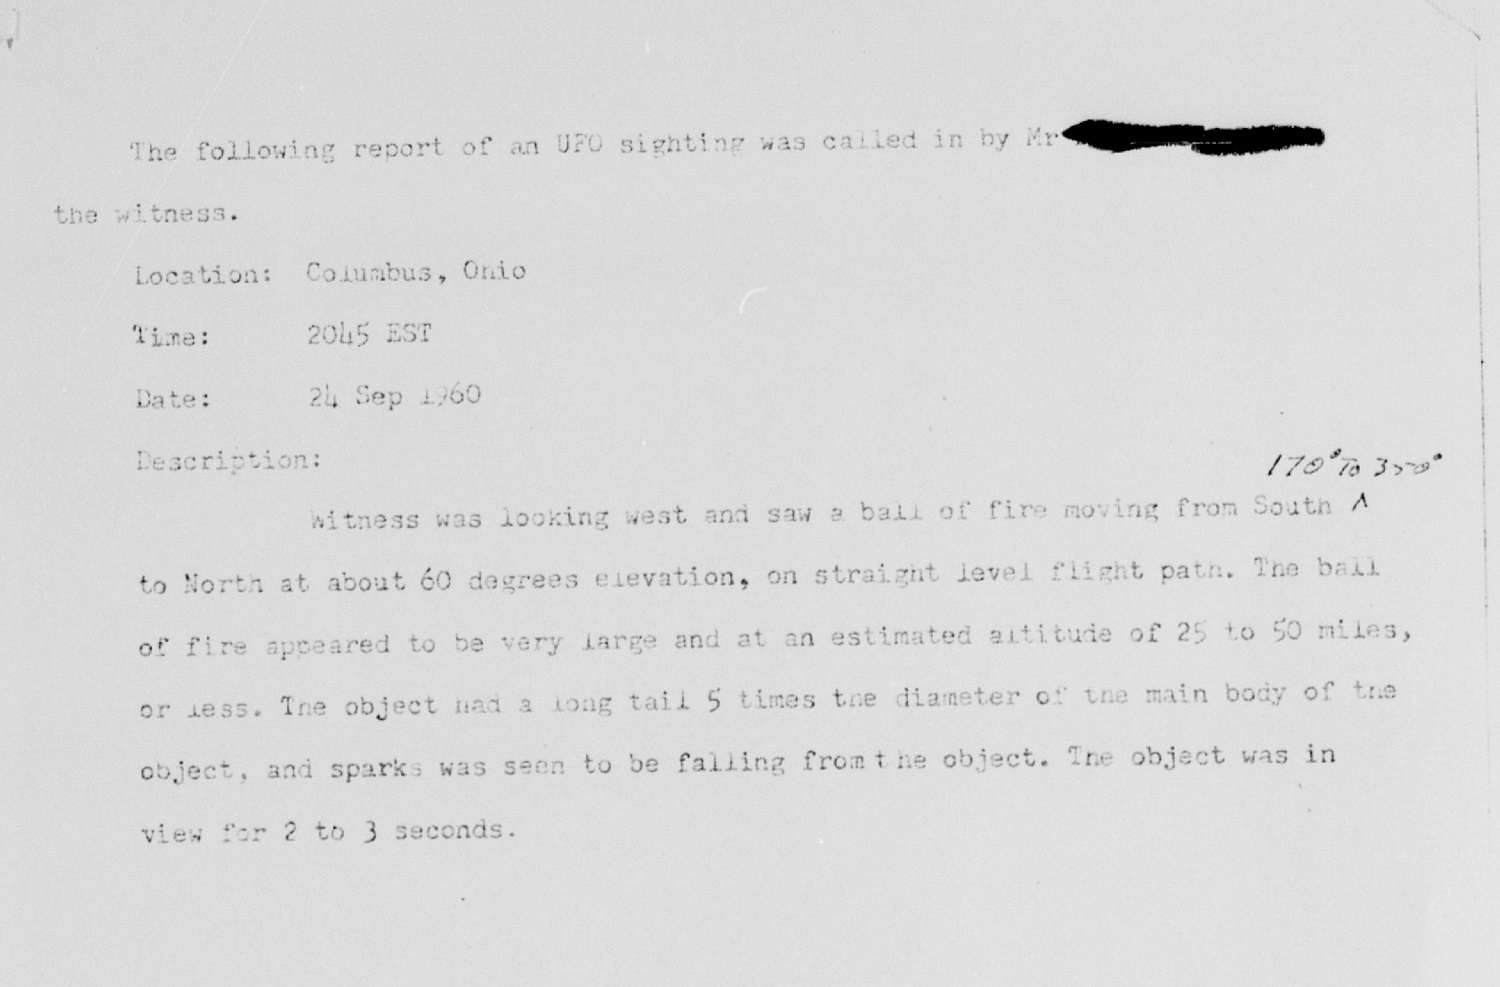
In this episode of Strange Columbus Things, we have the September 24, 1960 UFO case that involved a reported fireball. Investigators concluded that was a probable meteor.

To view more incidents around the world, visit this link.
UFO Database


Before and After: How Columbus Changed in 10 Years


How Columbus changed in 10 years

Part 2 is now available for more great before and after comparisons.

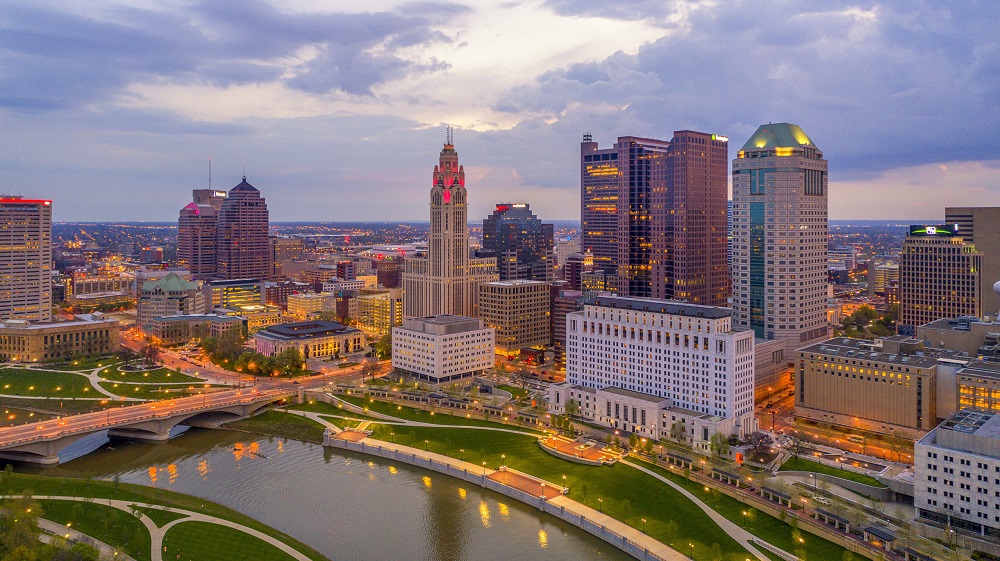
How Columbus has changed in 10 years is not always easily quantifiable. Columbus added more people in the past decade than during any previous similar period in its history. I’ve posted a lot about the 2020 Census data and updated many pages worth of information to the site. However, examining only population change through numbers is just one part of the story. How has that population growth manifested in terms of how the city appears in its built environment? This before and after look shows how the city has been transformed on a visual scale, and shows how some of the hottest neighborhoods have been radically altered in a short time.

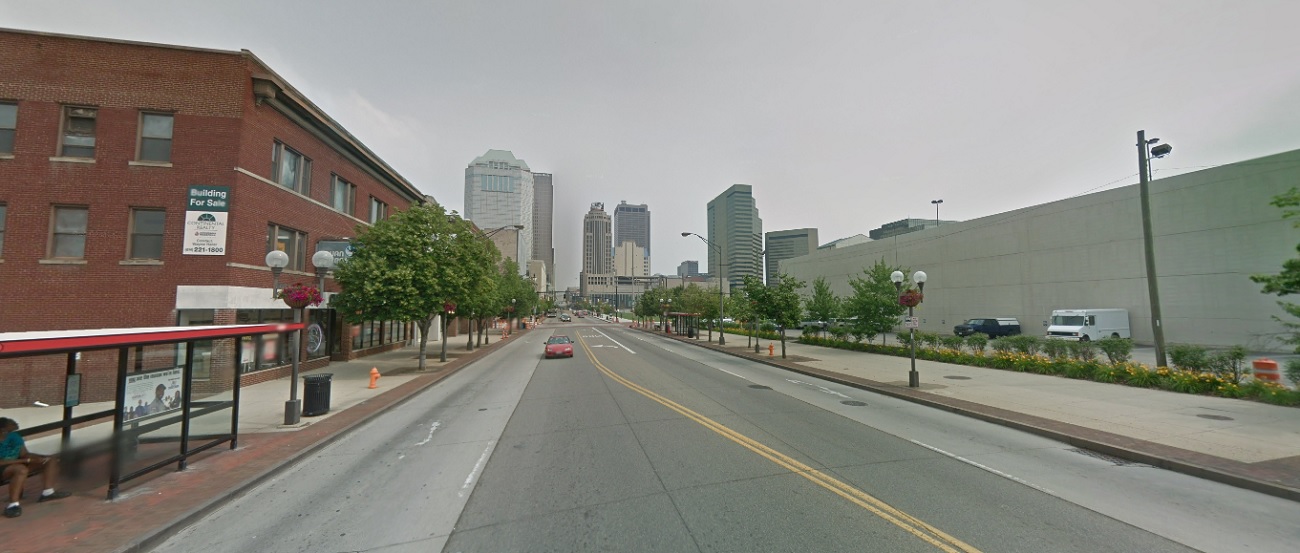
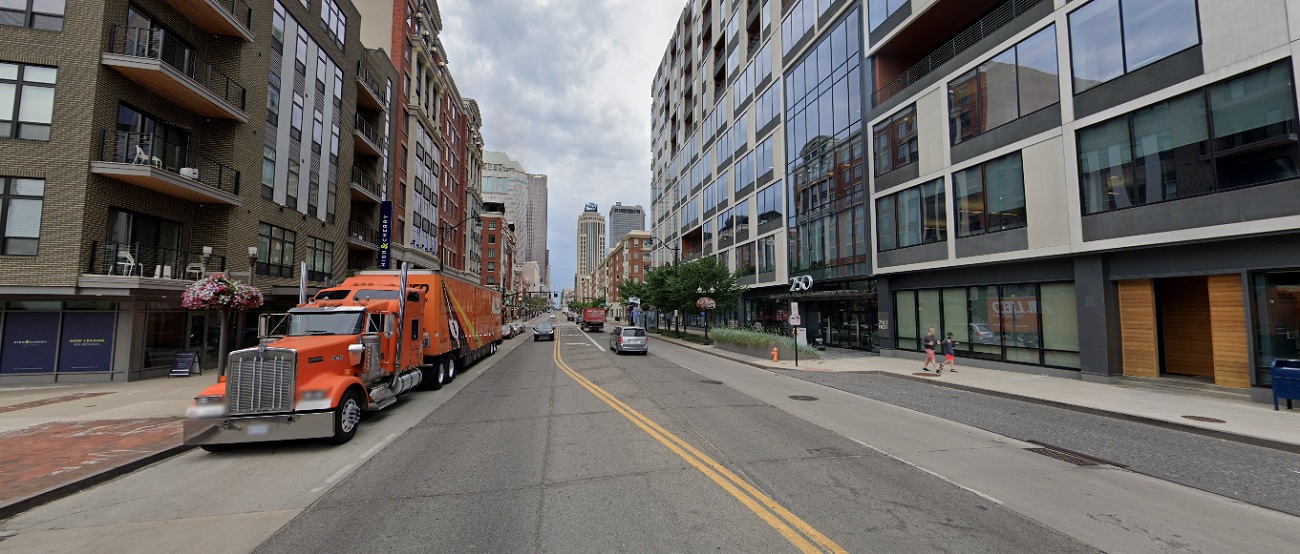
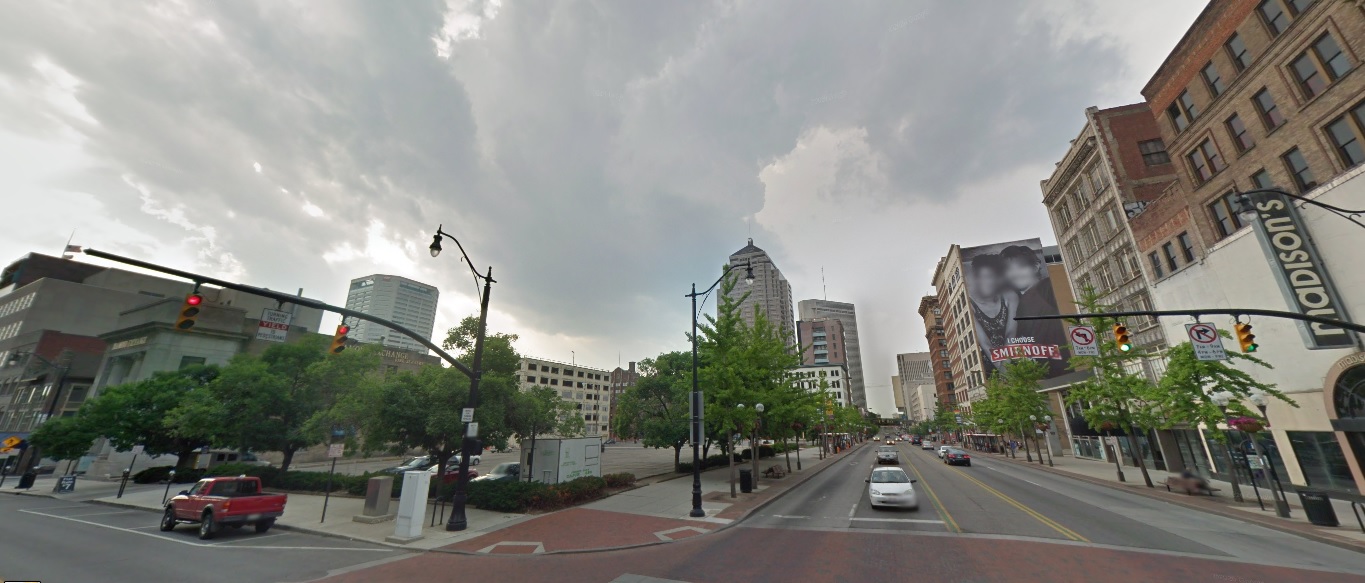
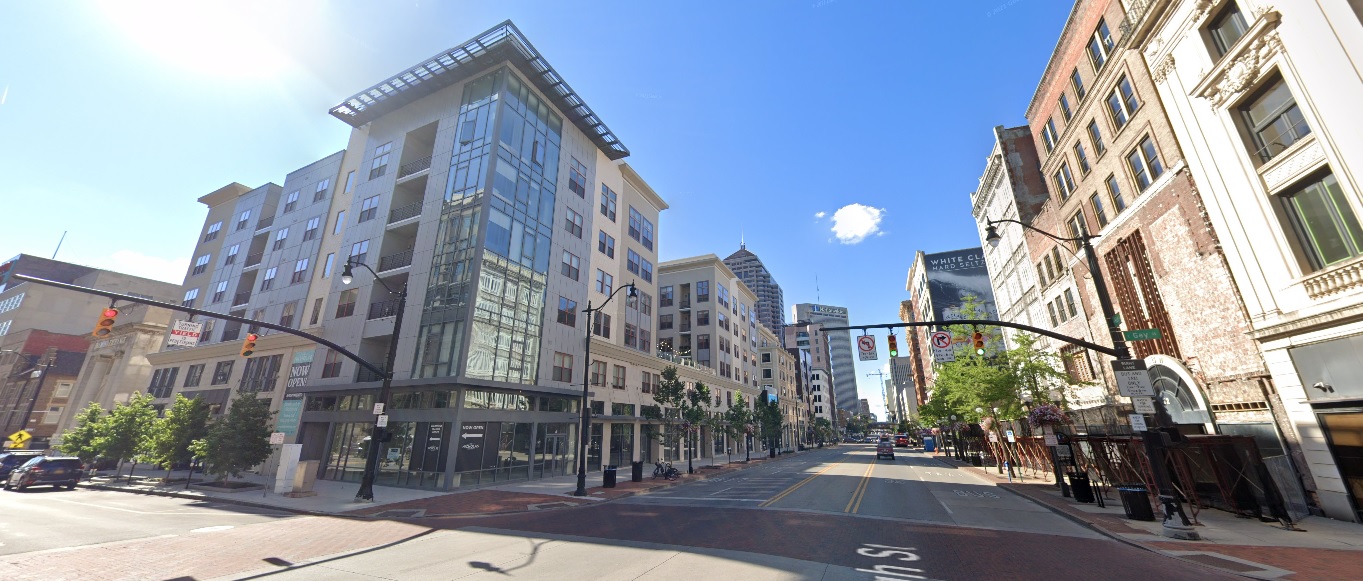
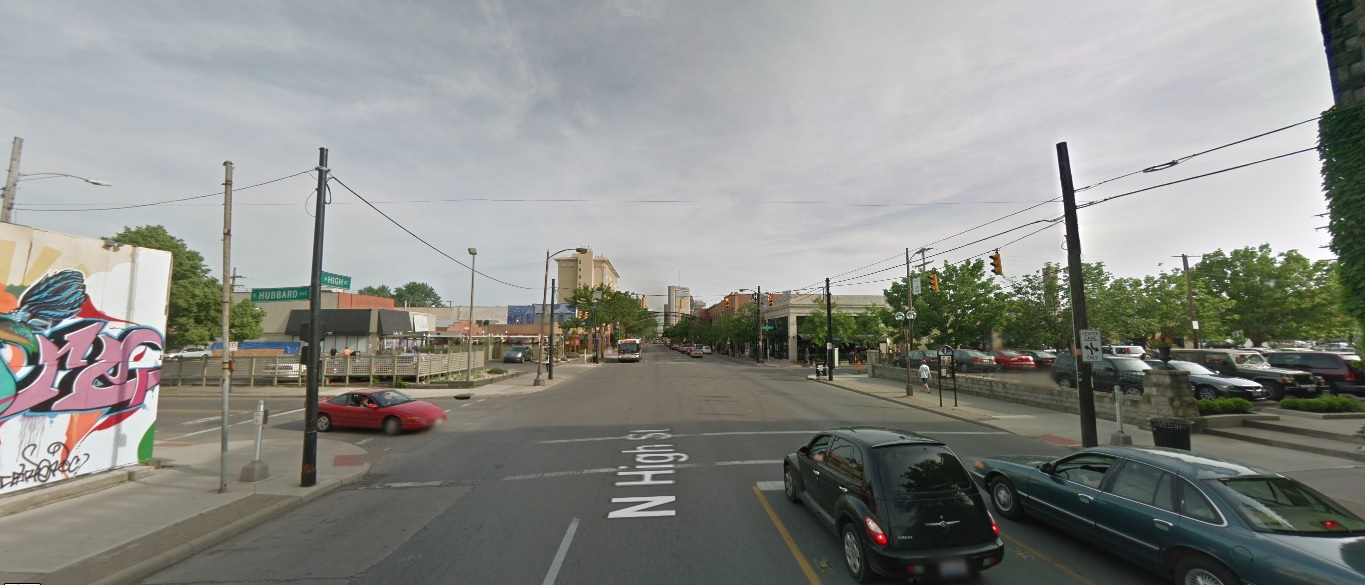
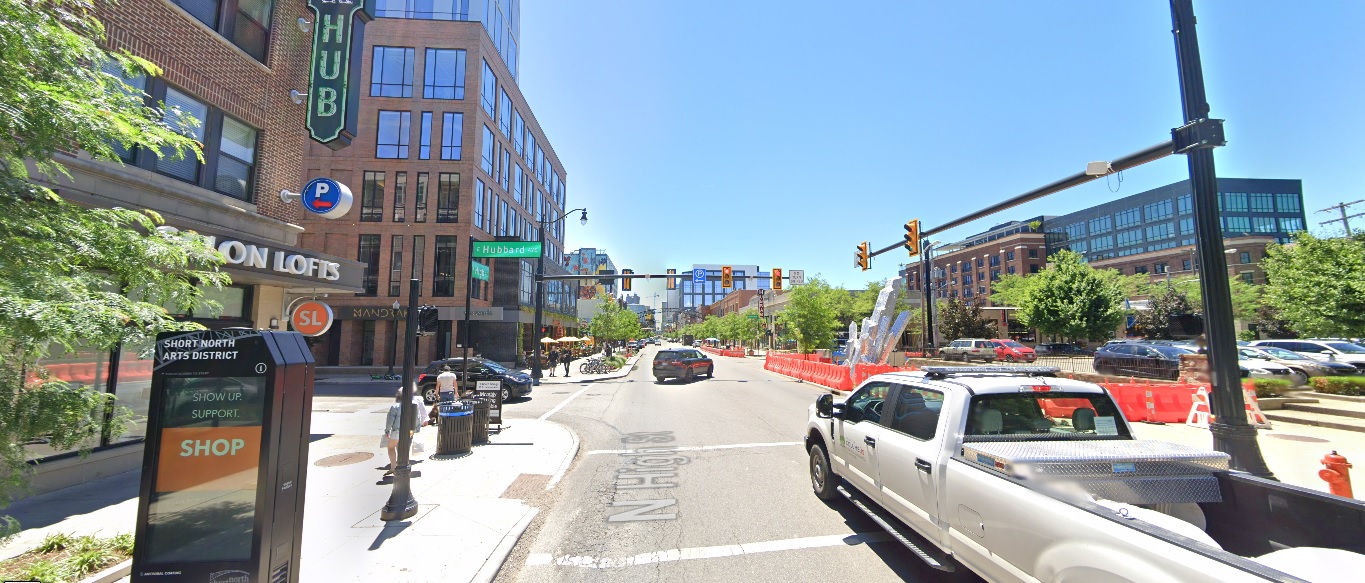
Downtown
High Street, looking north from Rich Street
Before: 2011

After: 2021

High Street, looking north from Gay Street
Before: 2011

After: 2021

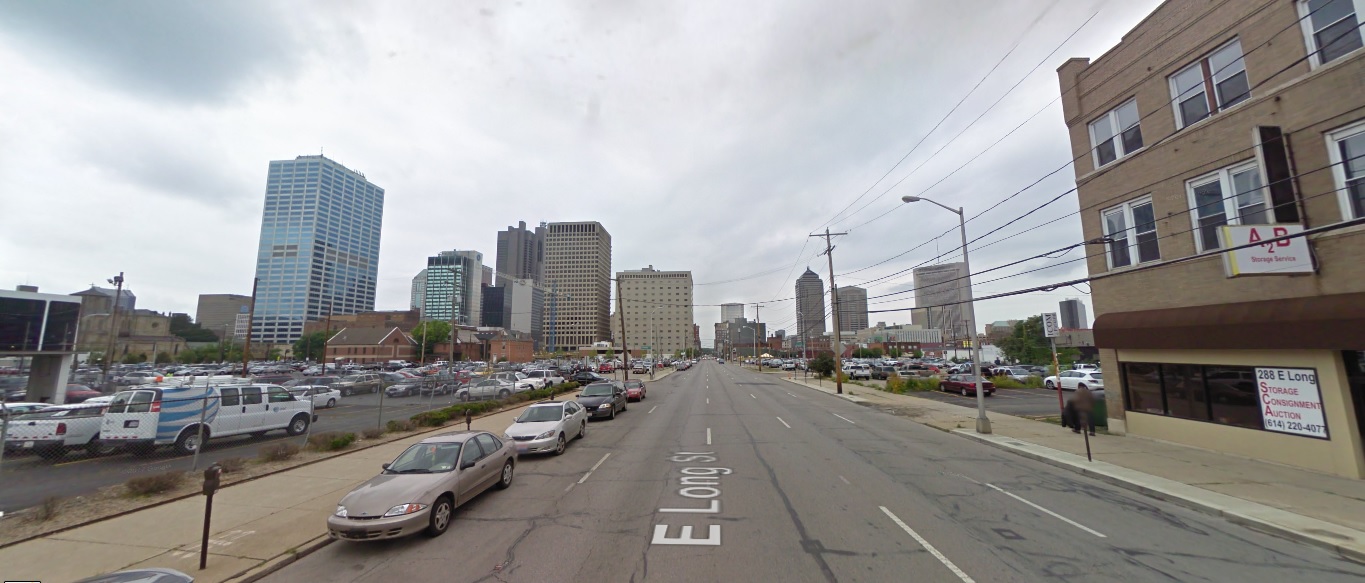
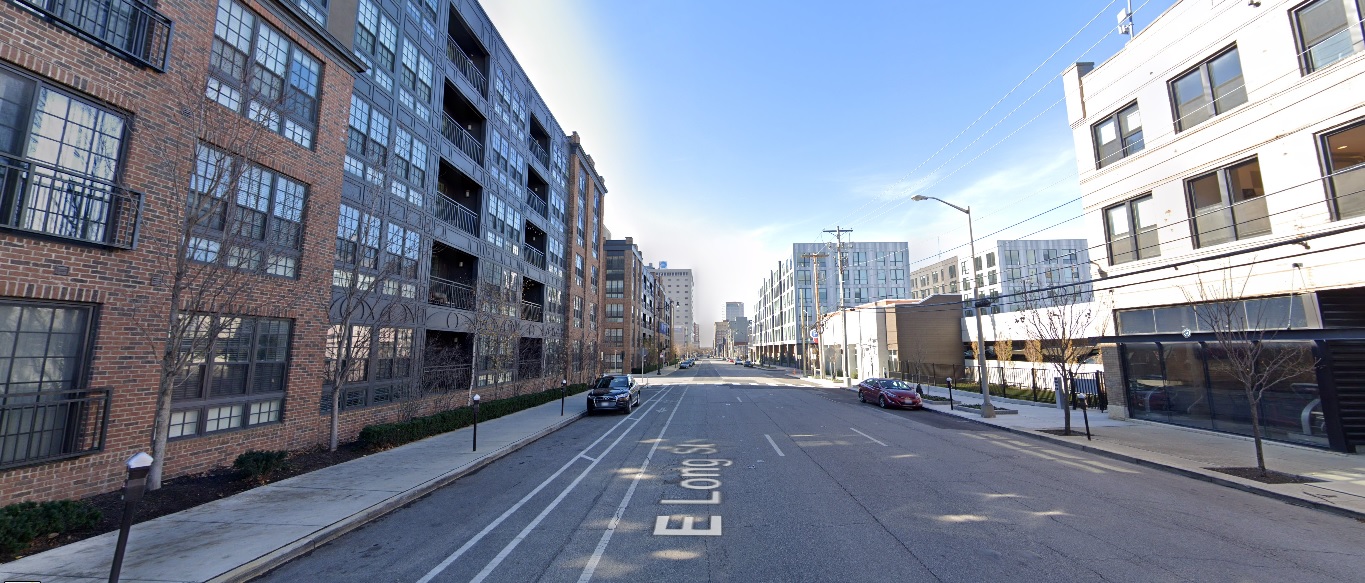
Long Street, looking east from 6th Street
Before: 2011

After: 2020

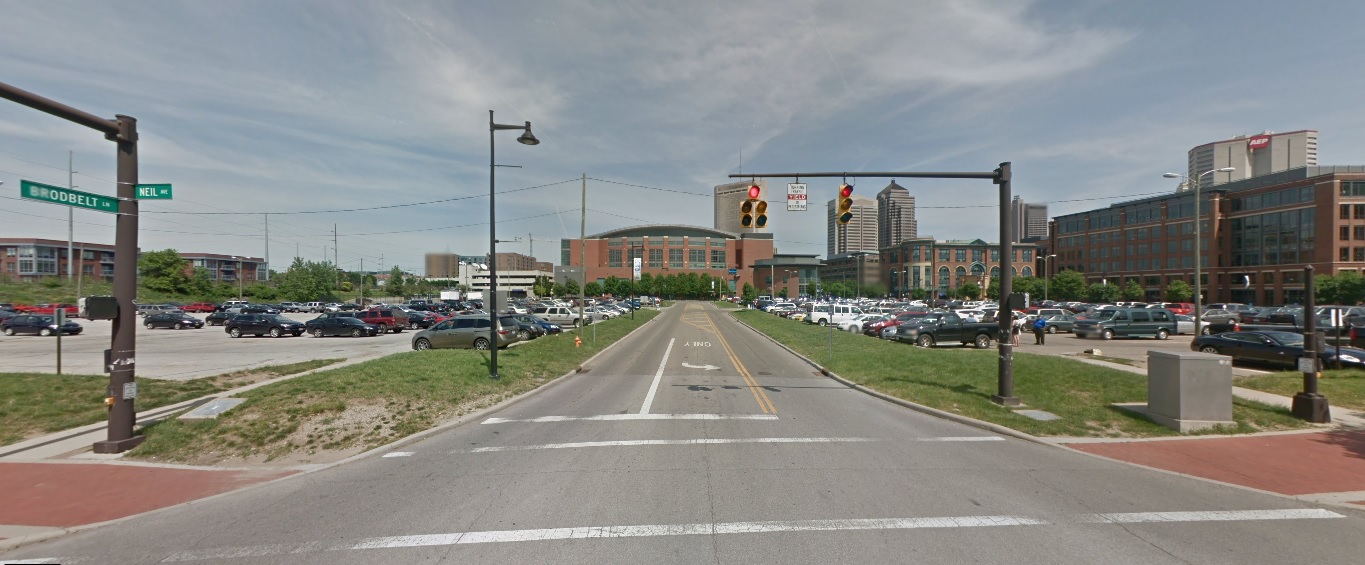
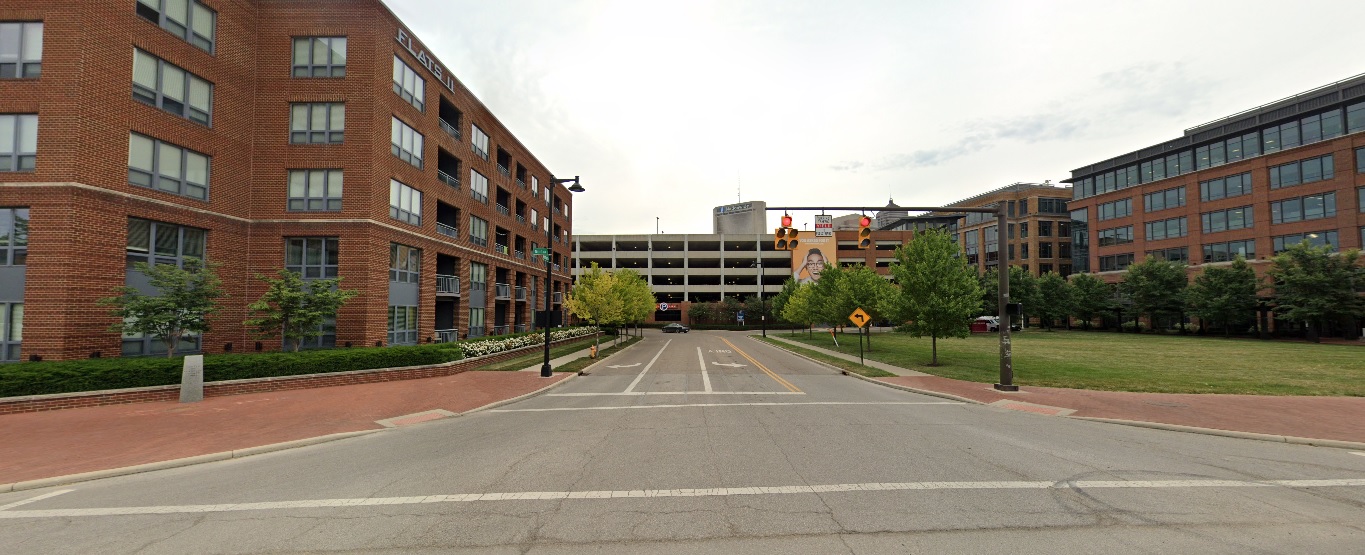
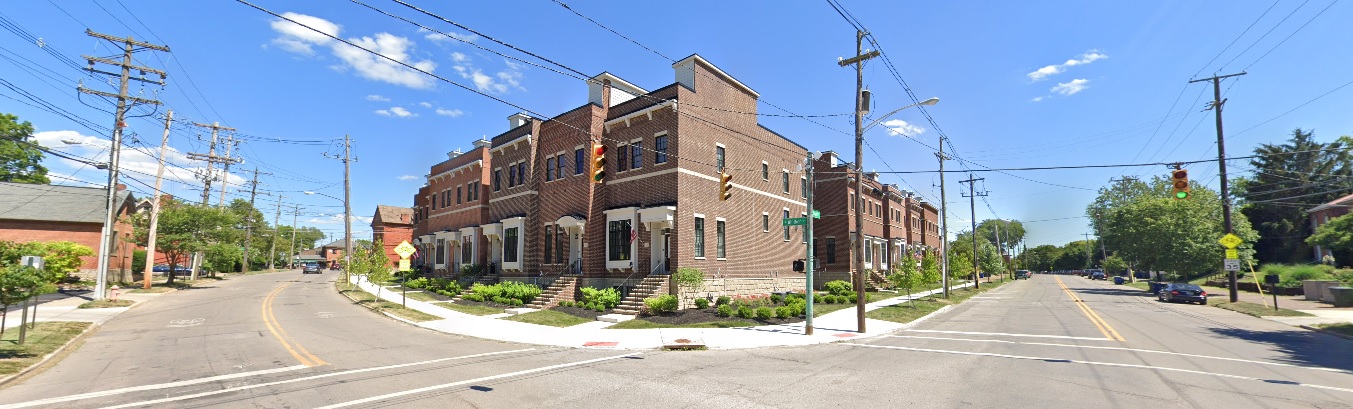
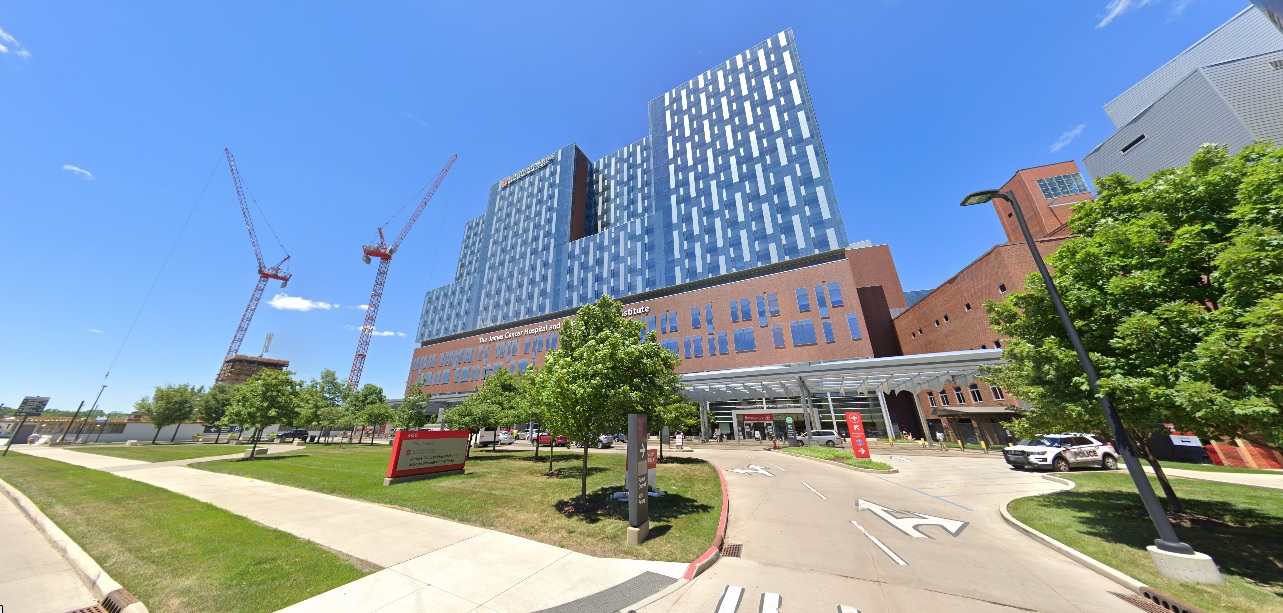
Neil Avenue, looking east at Broadbelt Lane
Before: 2011

After: 2021

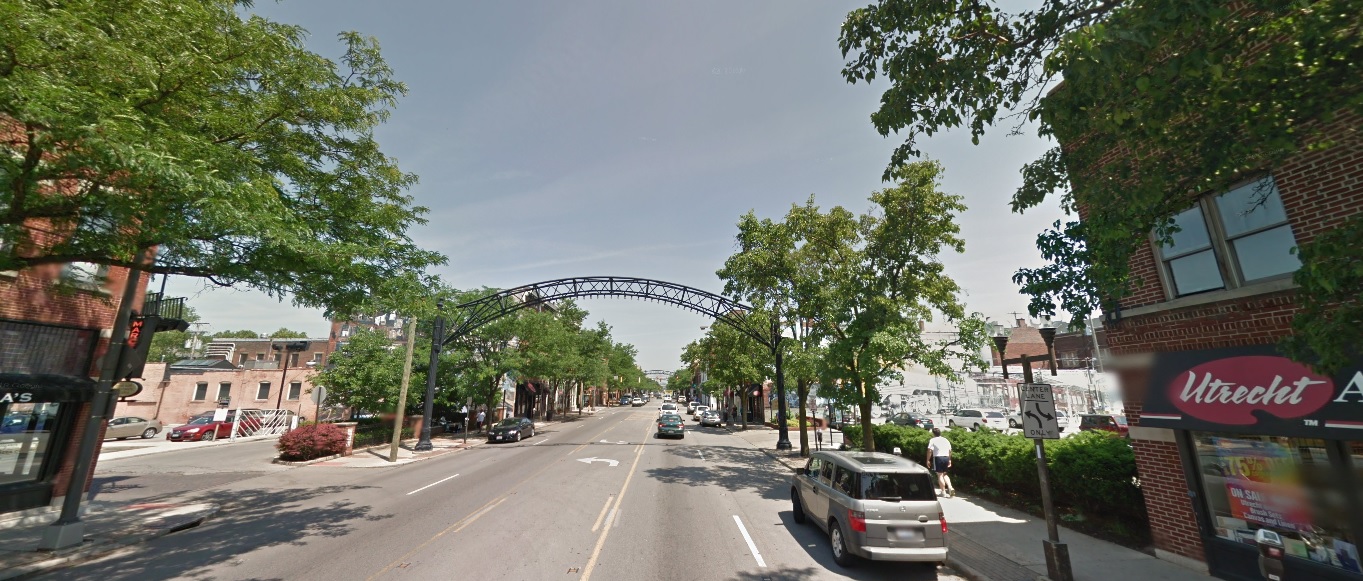
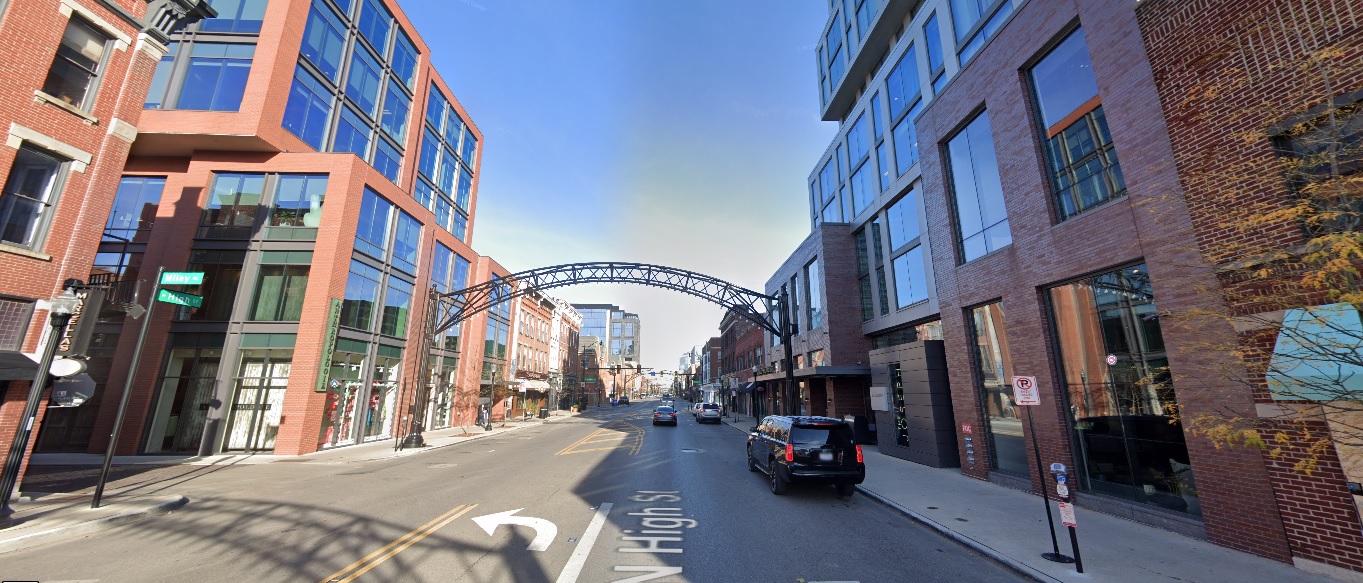
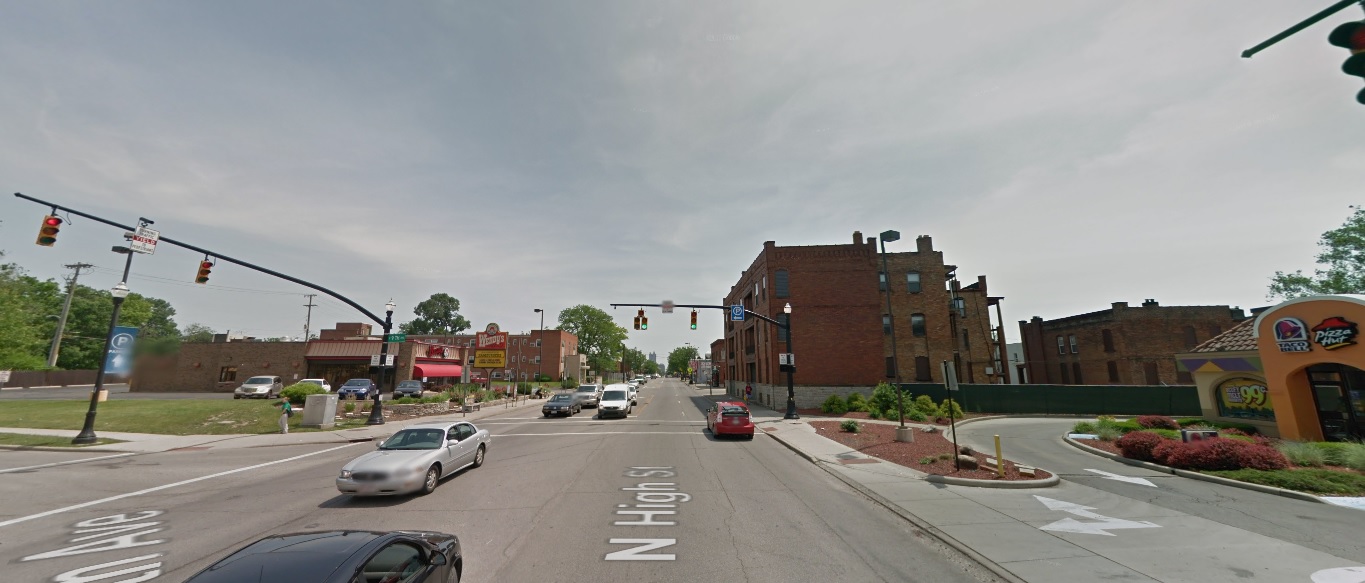
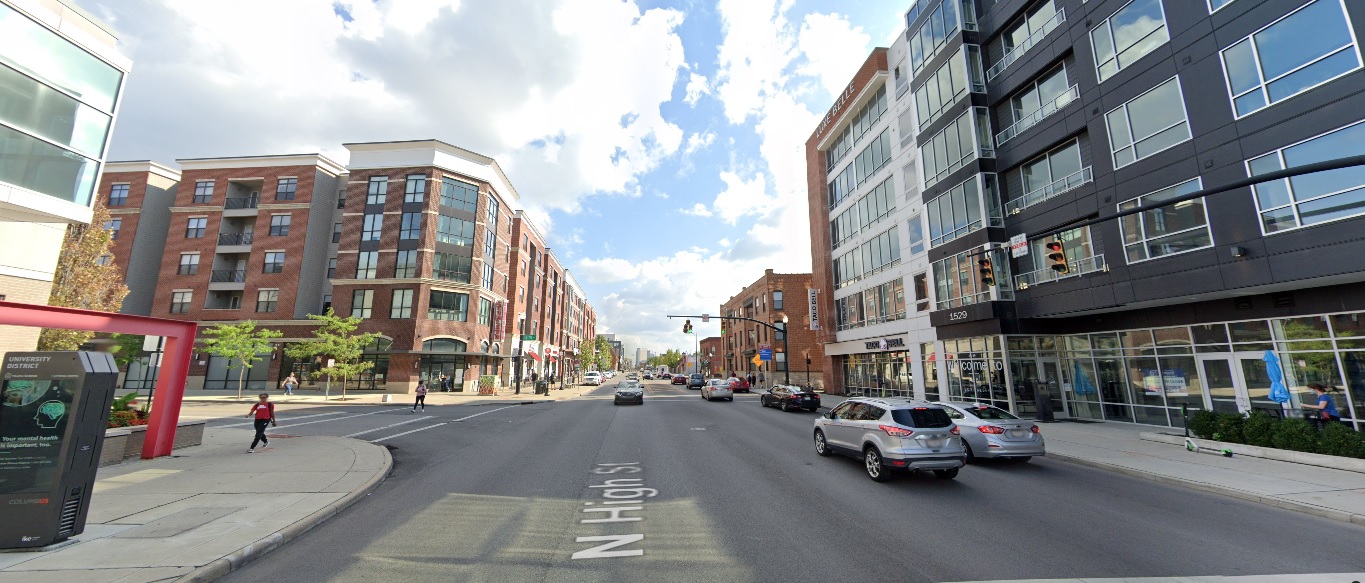
The Short North
High Street, looking north from Milay Alley
Before: 2011

After: 2020

High Street, looking south from Buttles Avenue
Before: 2011

After: 2021

Fourth Street, looking east at Auden Avenue
Before: 2011

Before: 2021

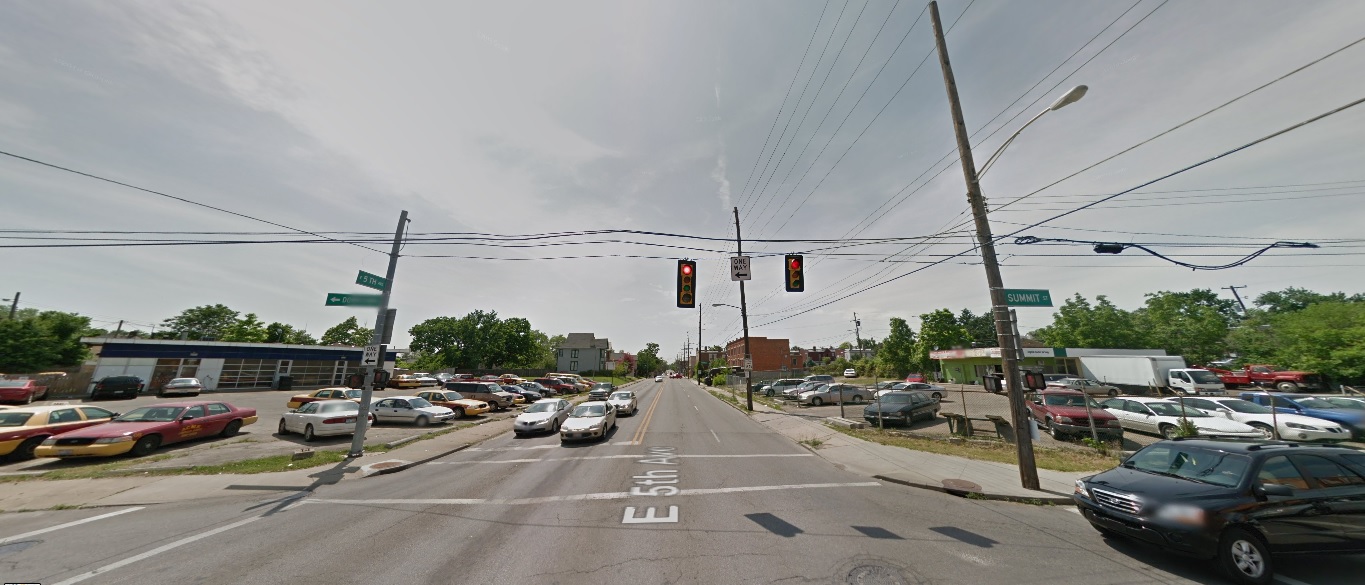
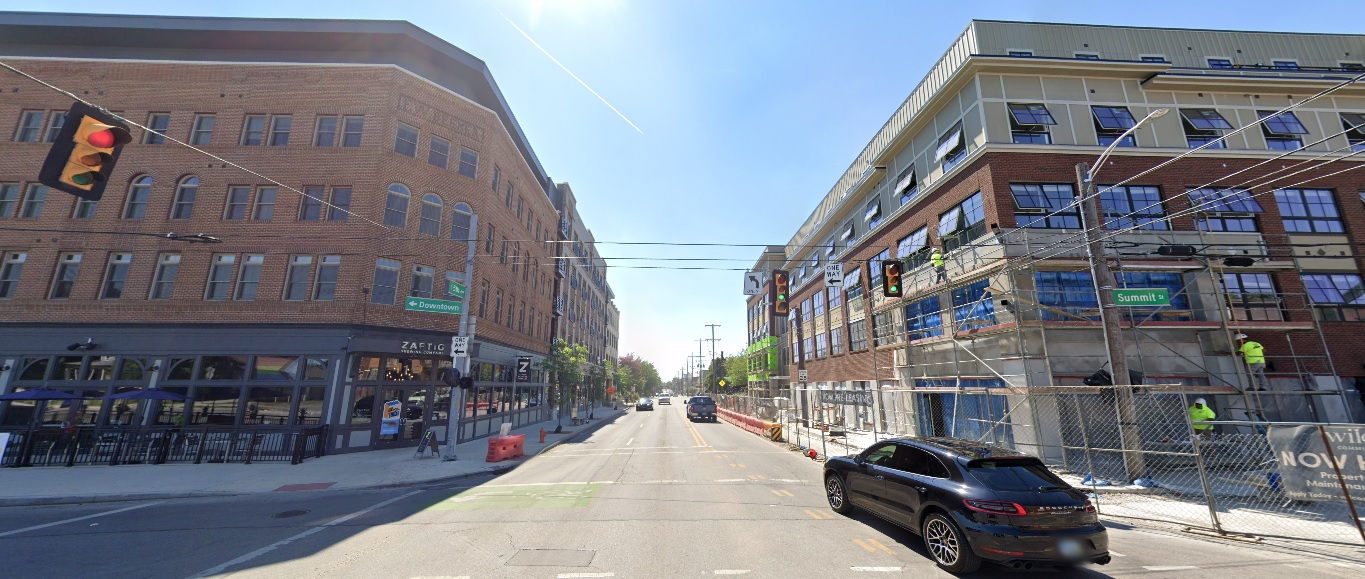
Summit Street, looking west at 5th Avenue
Before: 2011

After: 2021

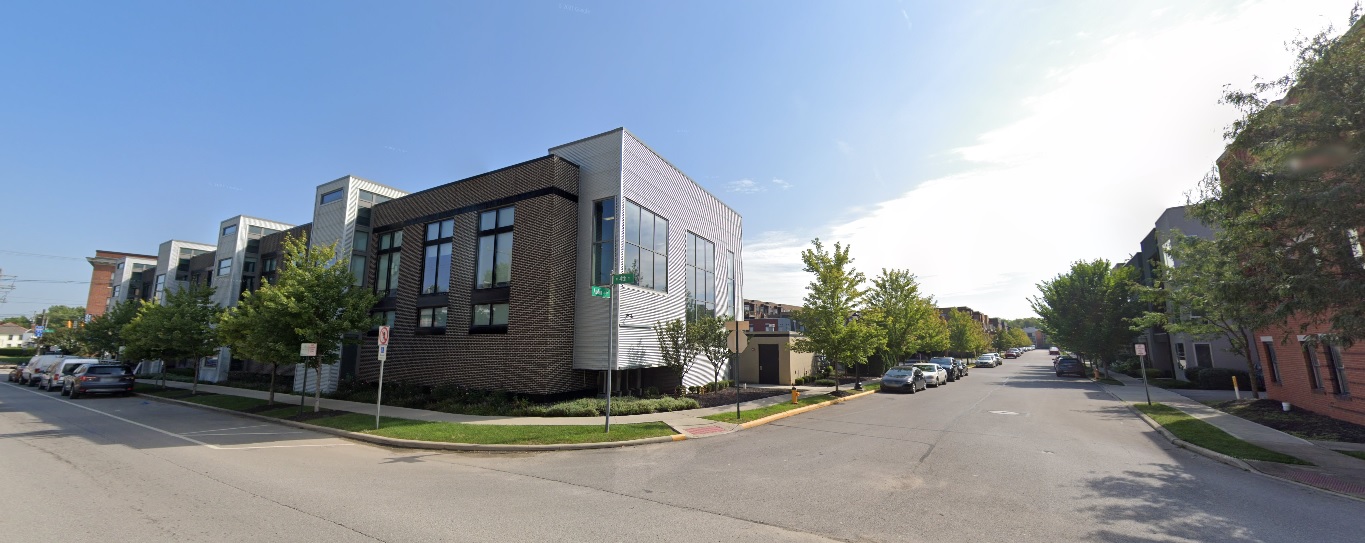
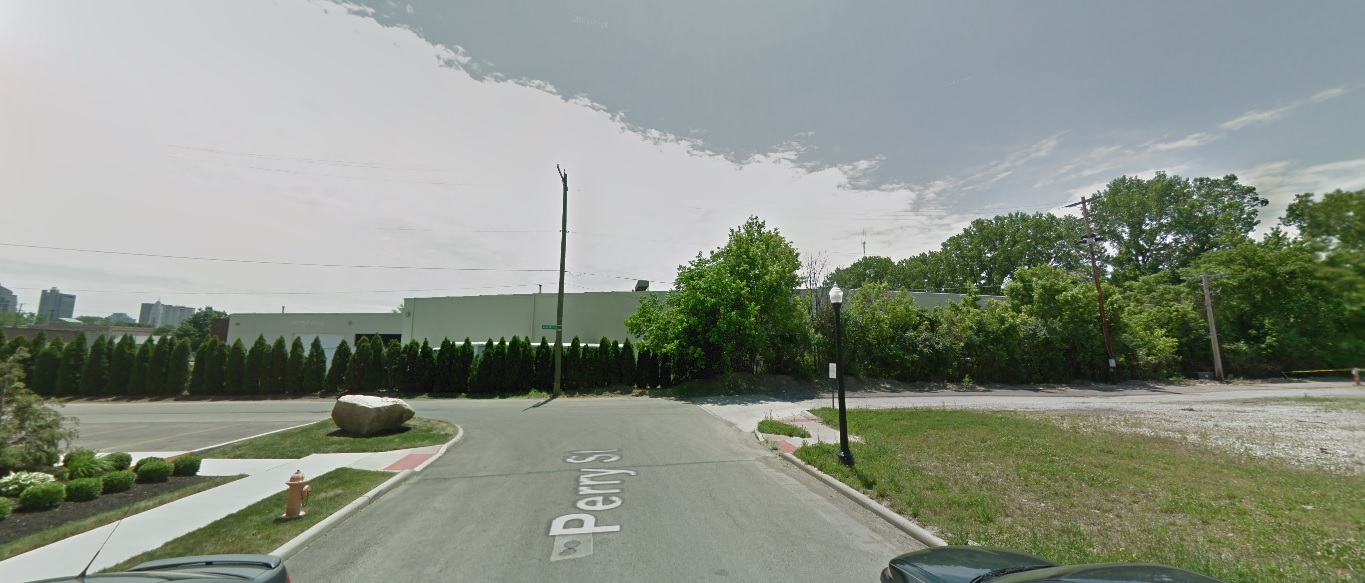
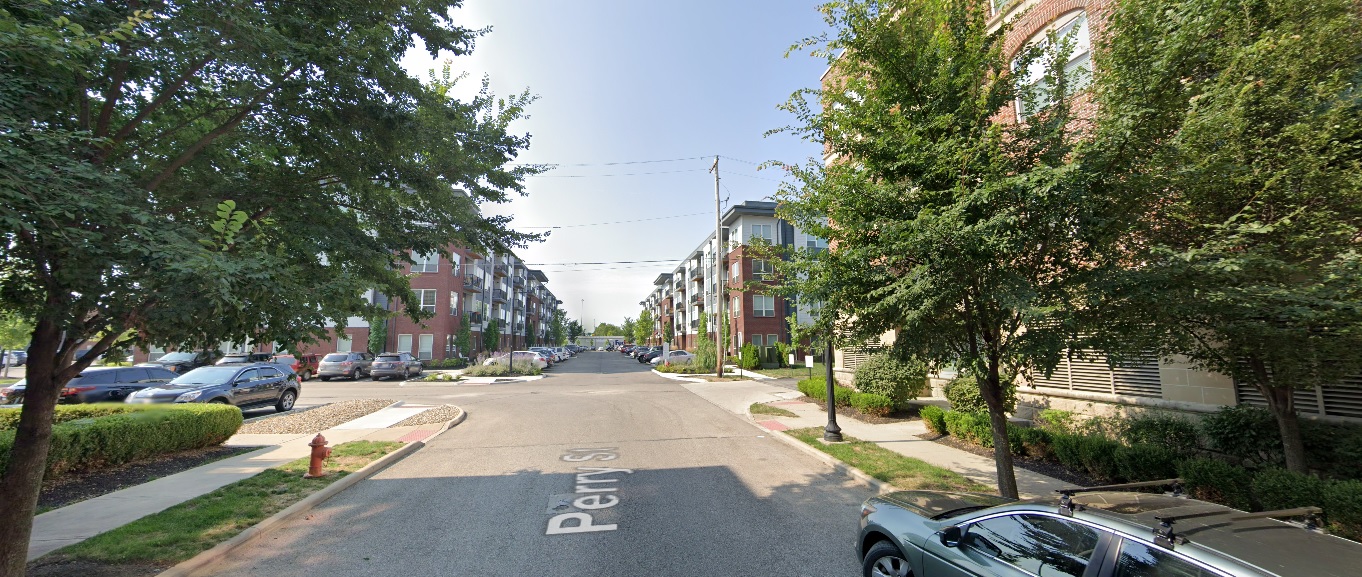
Perry Street, looking south at Quality Place
Before: 2011

After: 2021

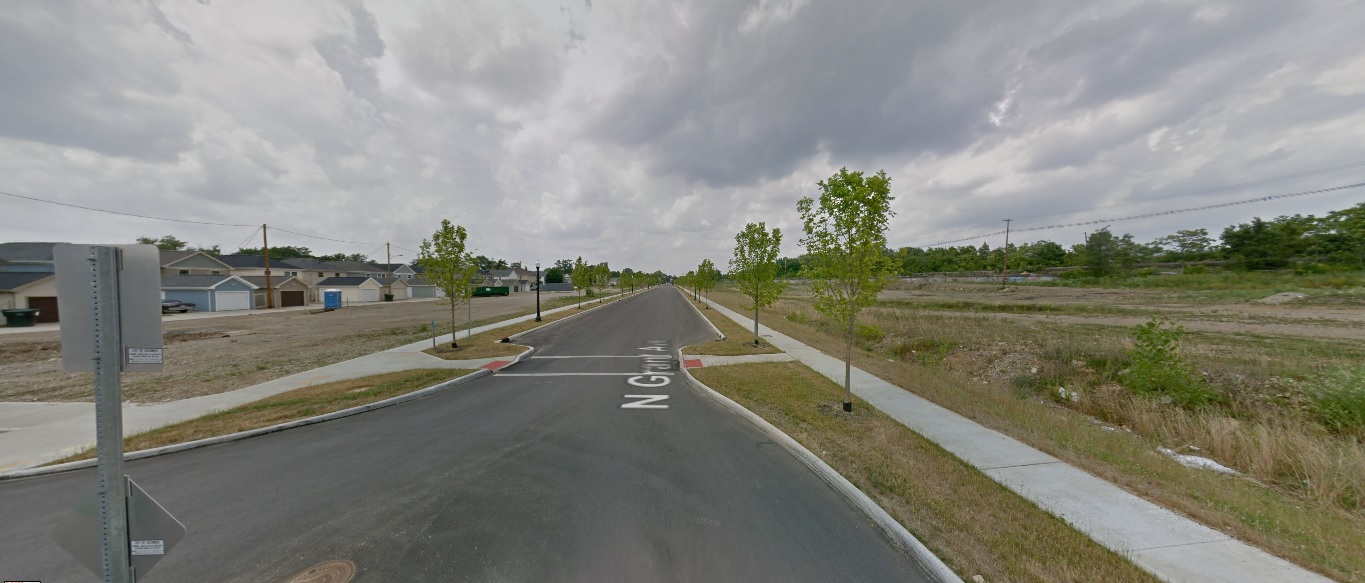
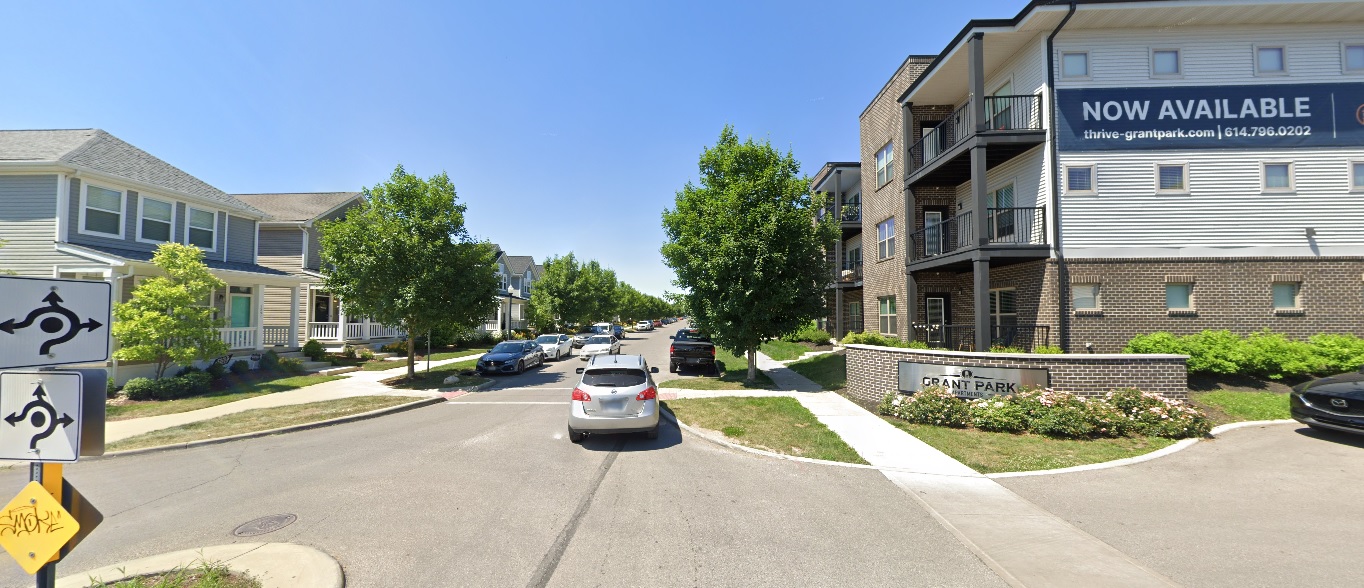
Weinland Park
Grant Avenue, looking north from 7th Avenue
Before: 2012

After: 2021

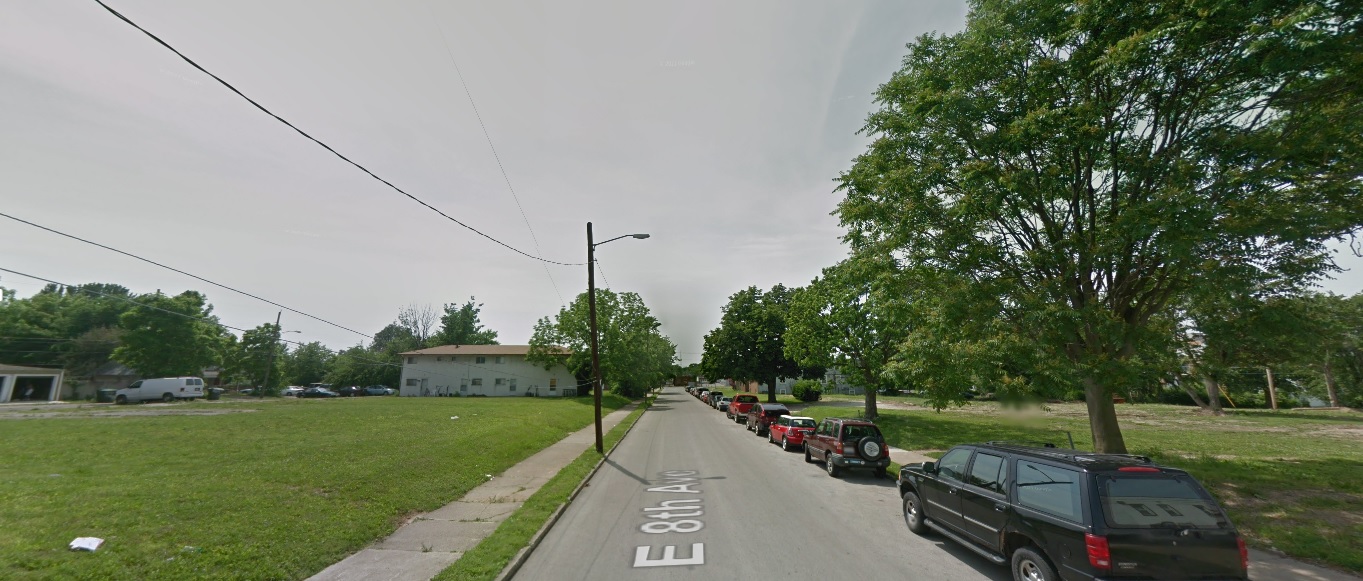
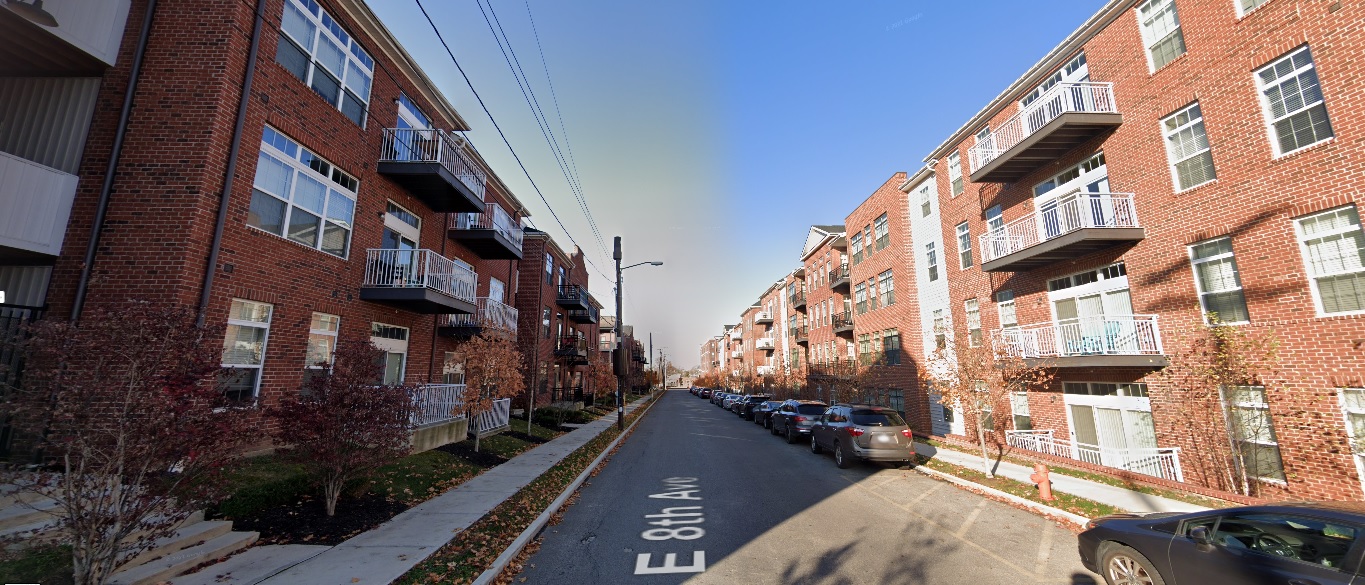
Eighth Avenue, looking west from Section Alley
Before: 2011

After: 2020

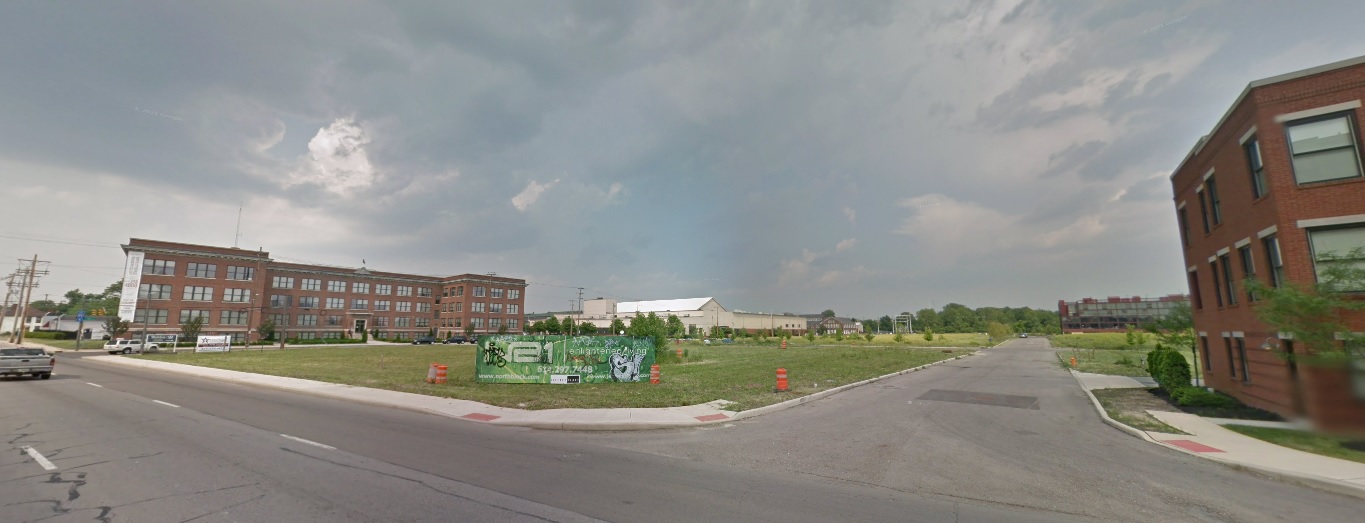
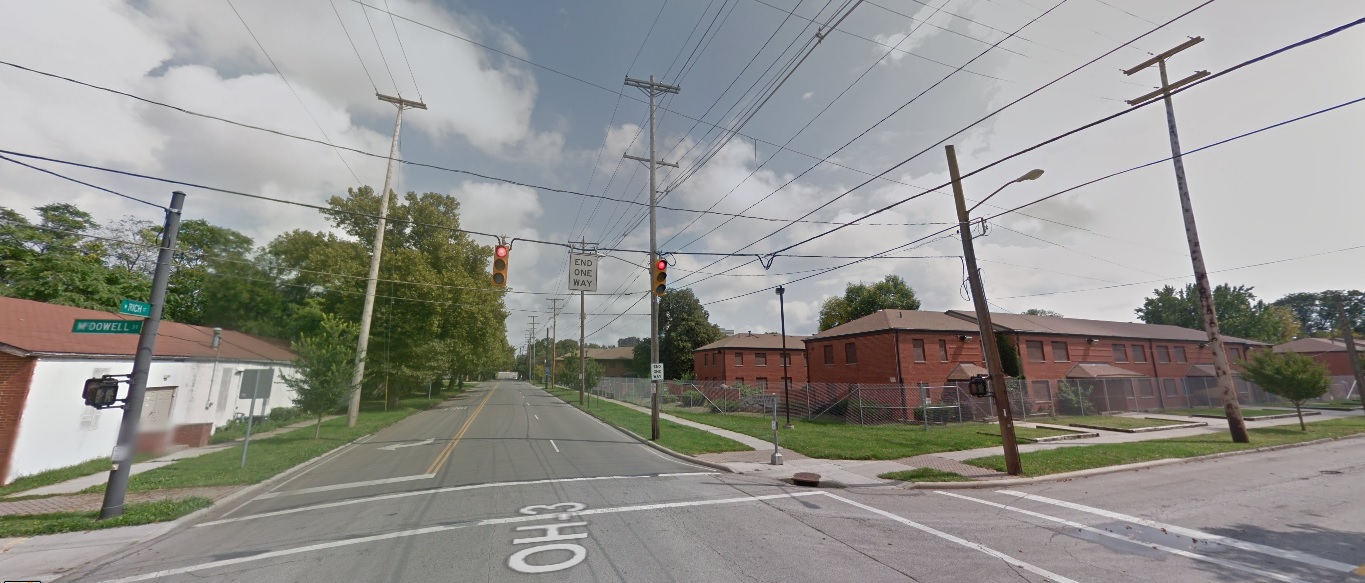
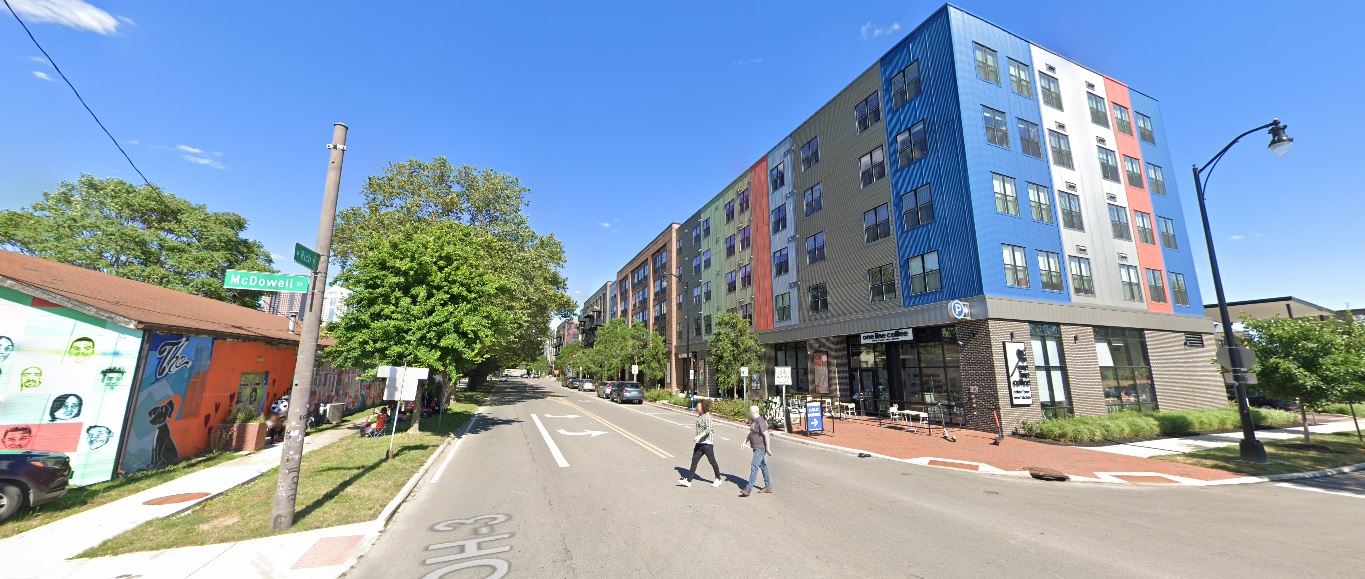
Franklinton
Rich Street, looking east from McDowell Street
Before: 2011

After: 2021

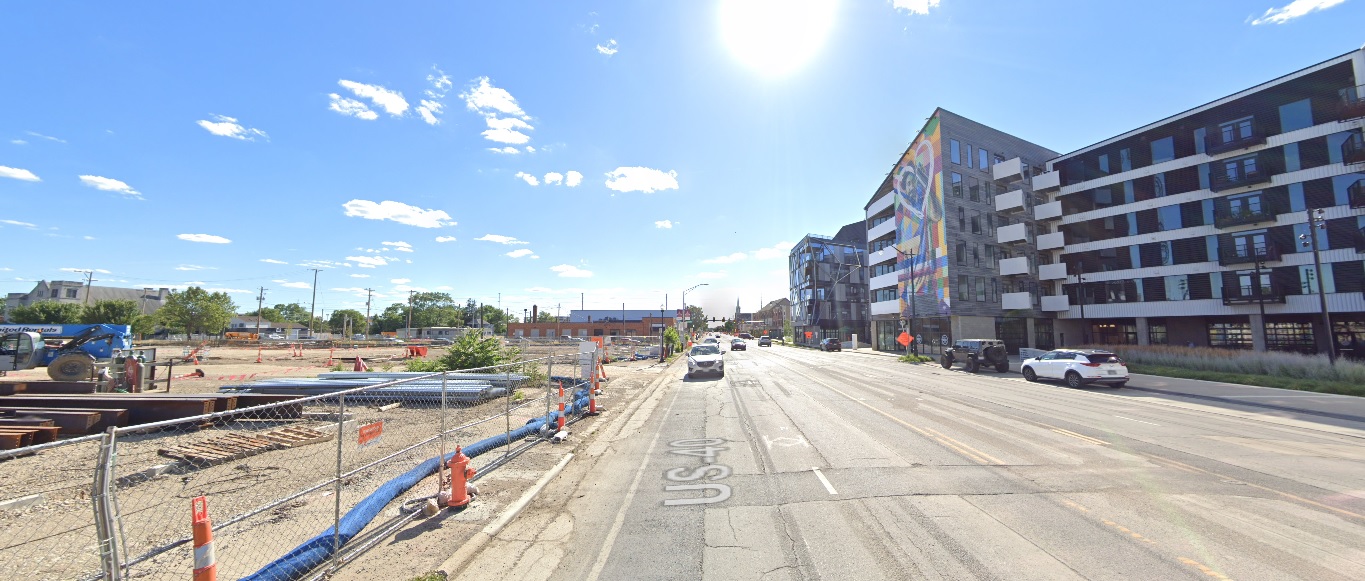
Broad Street, looking west from the railroad tracks.
Before: 2011

After: 2021

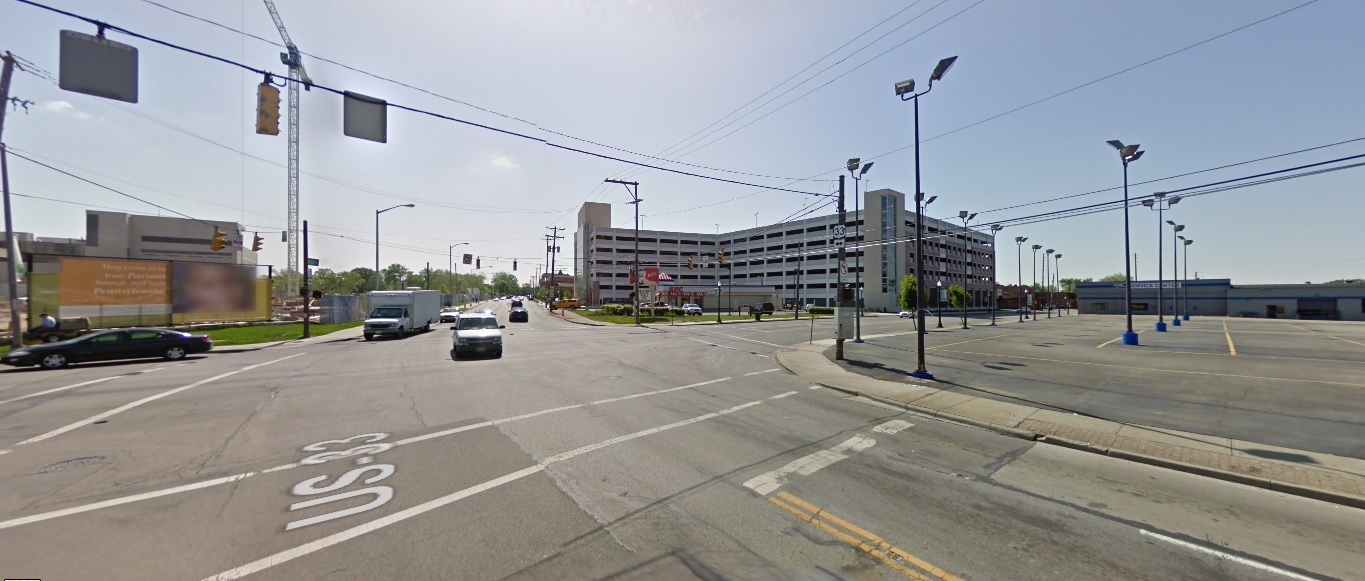
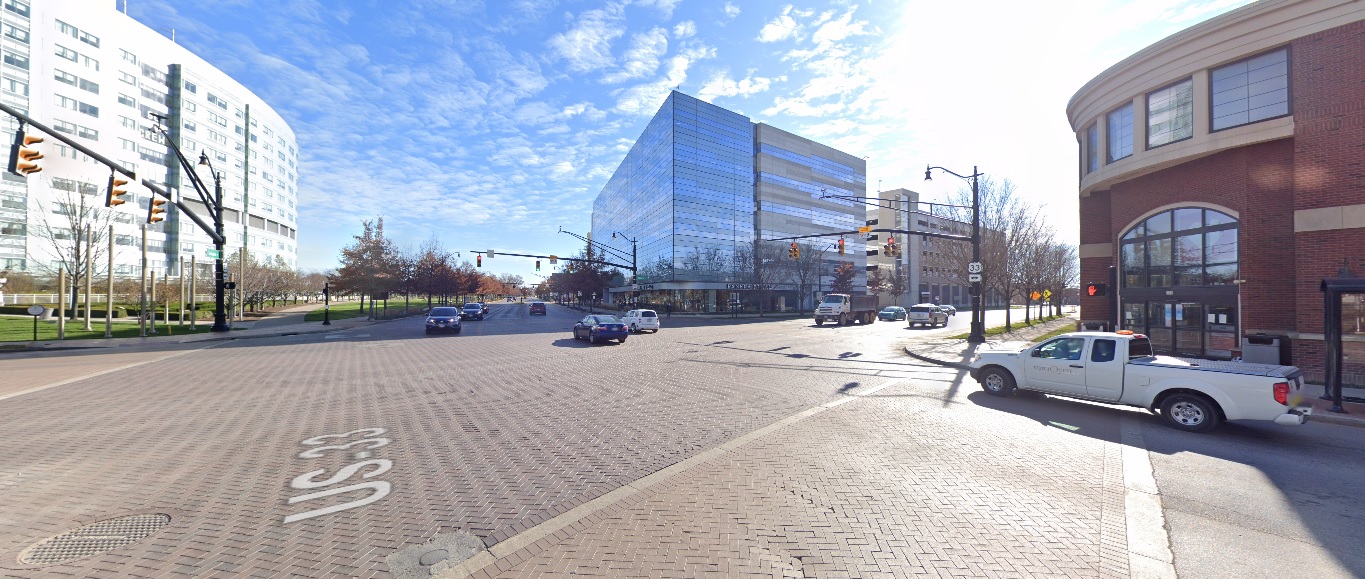
South Side
Livingston Avenue, looking east at Parsons Avenue
Before: 2009

After: 2020

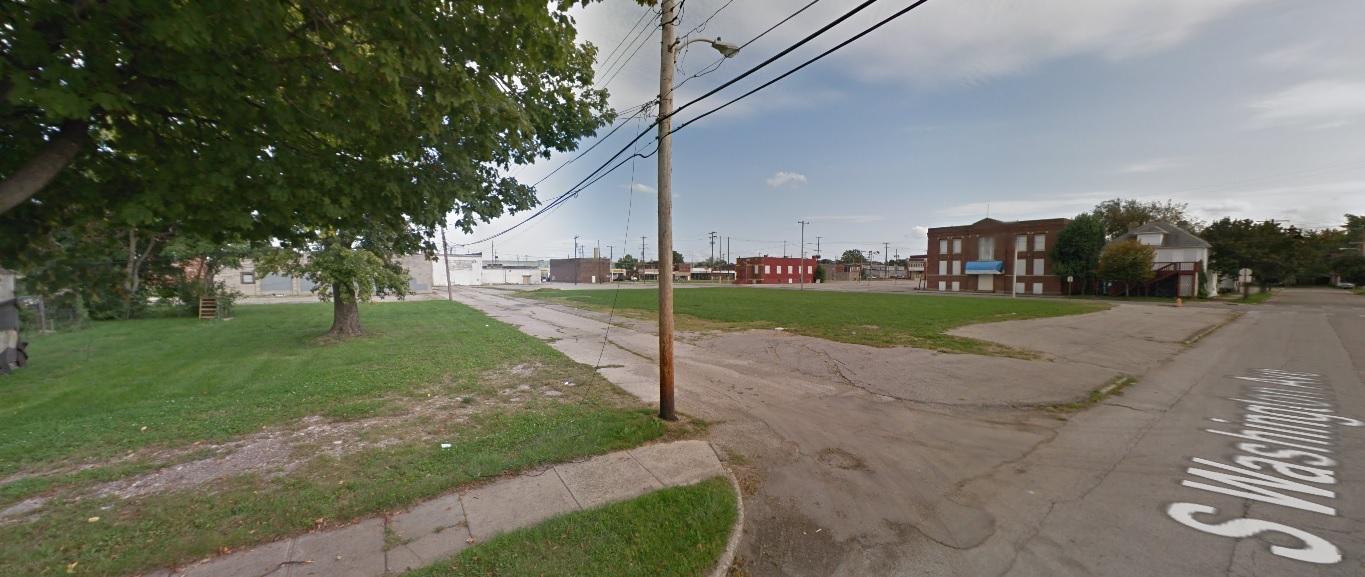
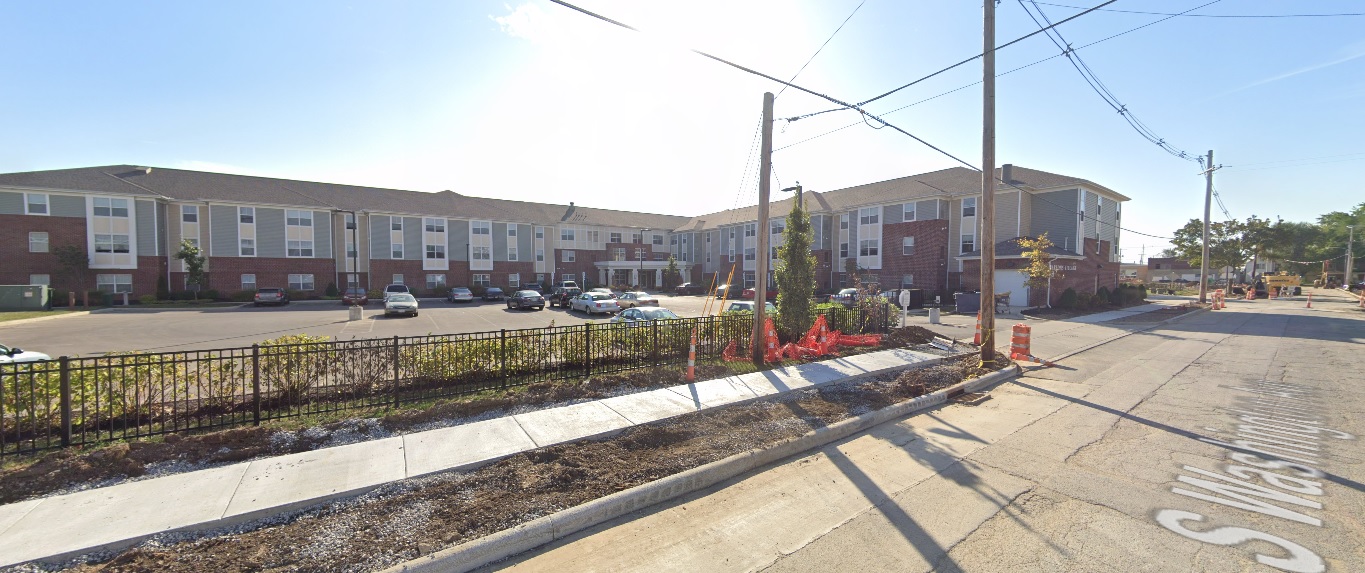
Washington Avenue, looking southeast from Innis Avenue
Before: 2011

After: 2020

Front Street, looking south at Whittier Street
Before: 2011

After: 2021


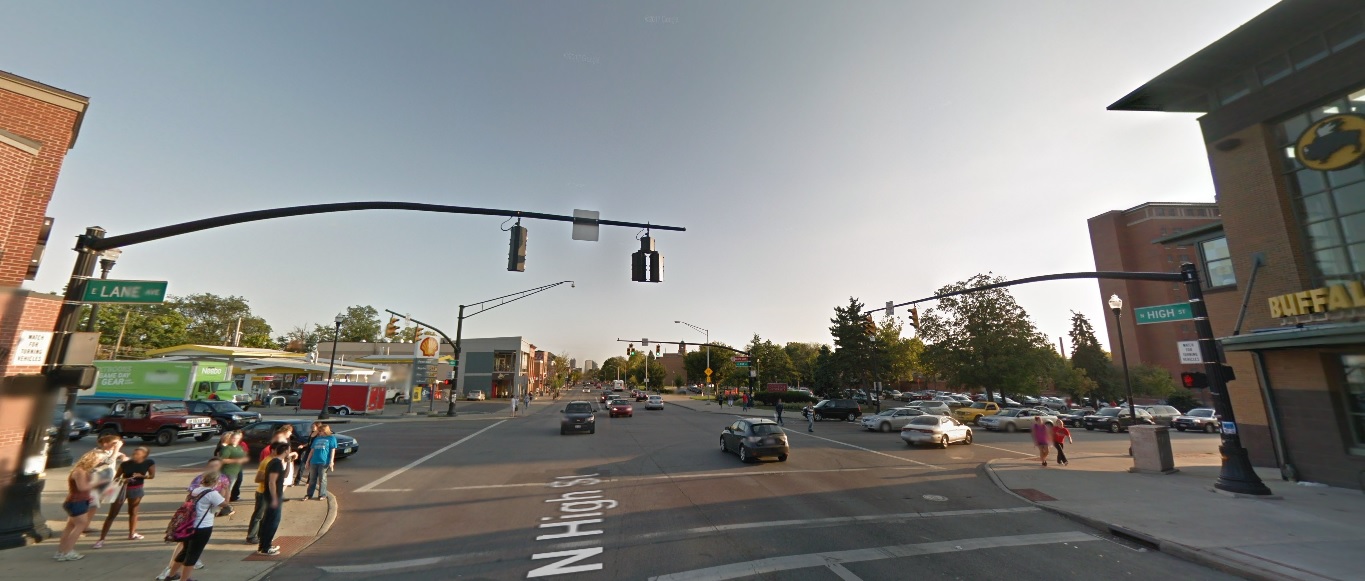
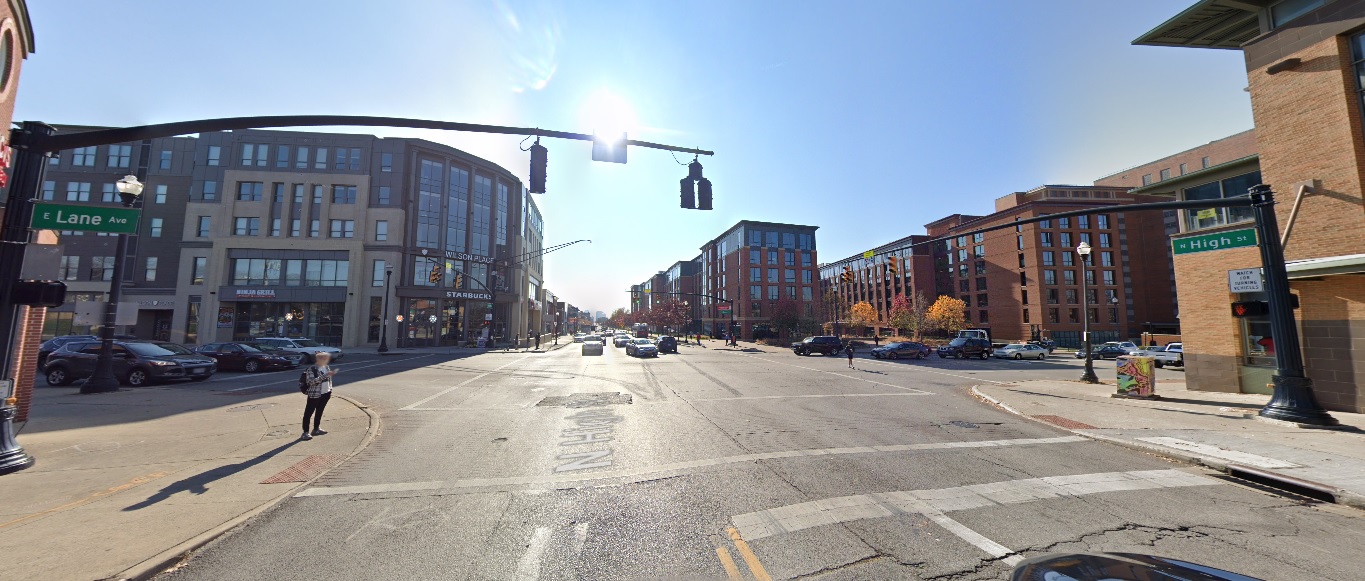
Campus
High Street, looking south from Lane Avenue
Before: 2011

After: 2020

10th Avenue near Dodd Drive, looking northwest.
Before: 2011

After: 2021

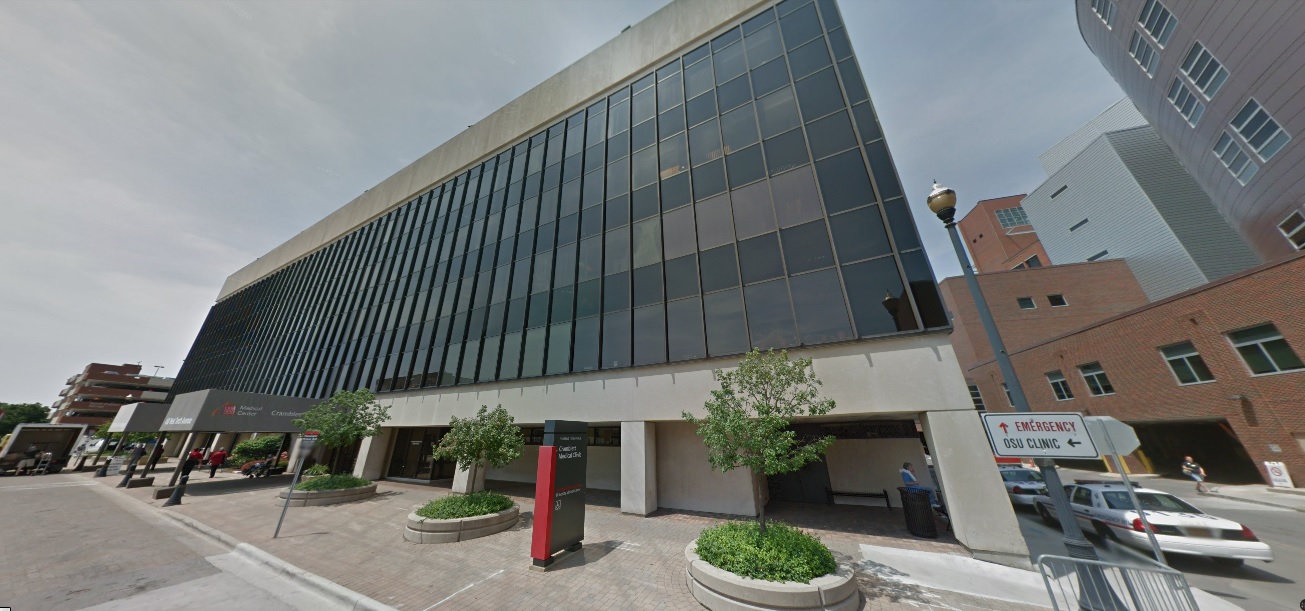
High Street, looking south from 8th Avenue
Before: 2011

After: 2021

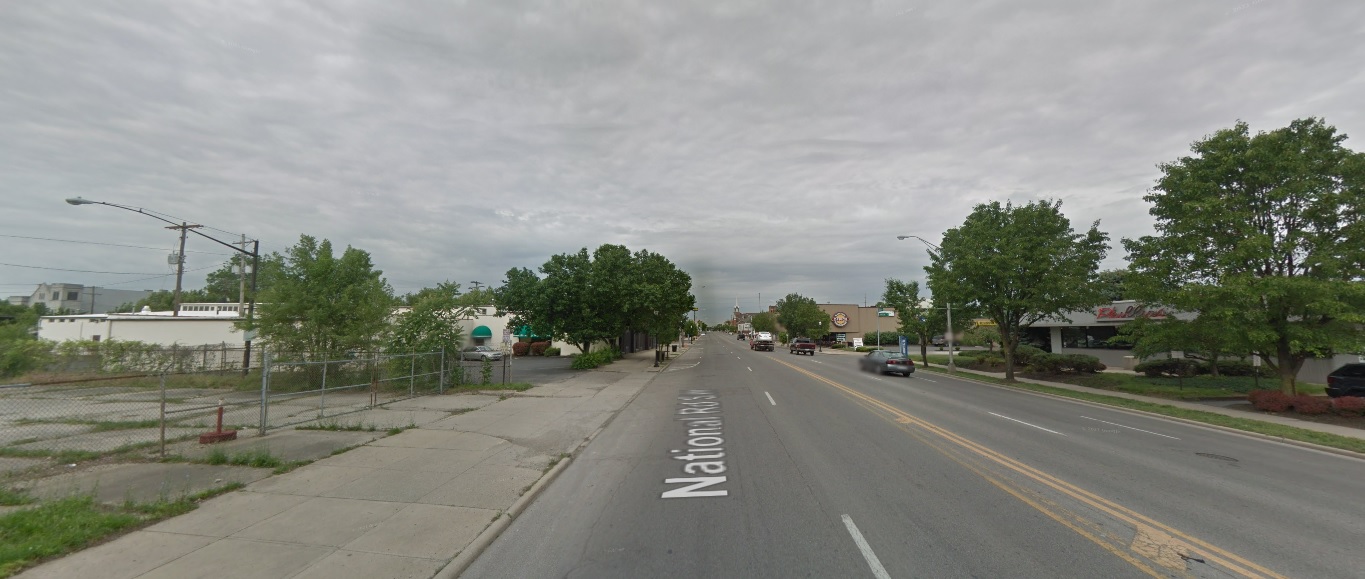
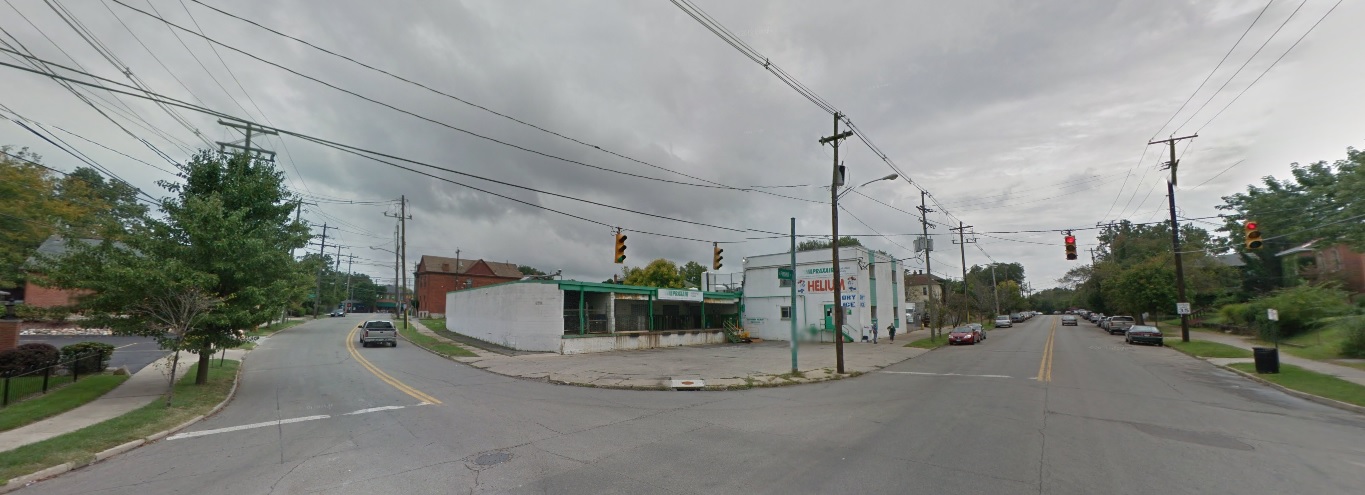
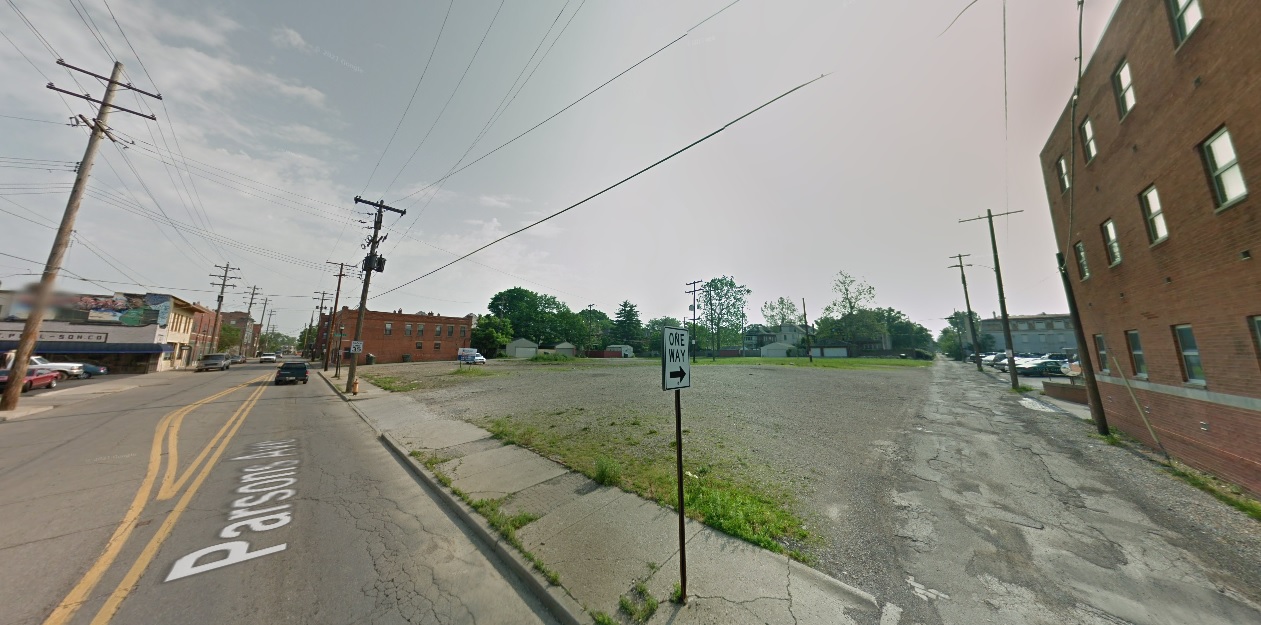
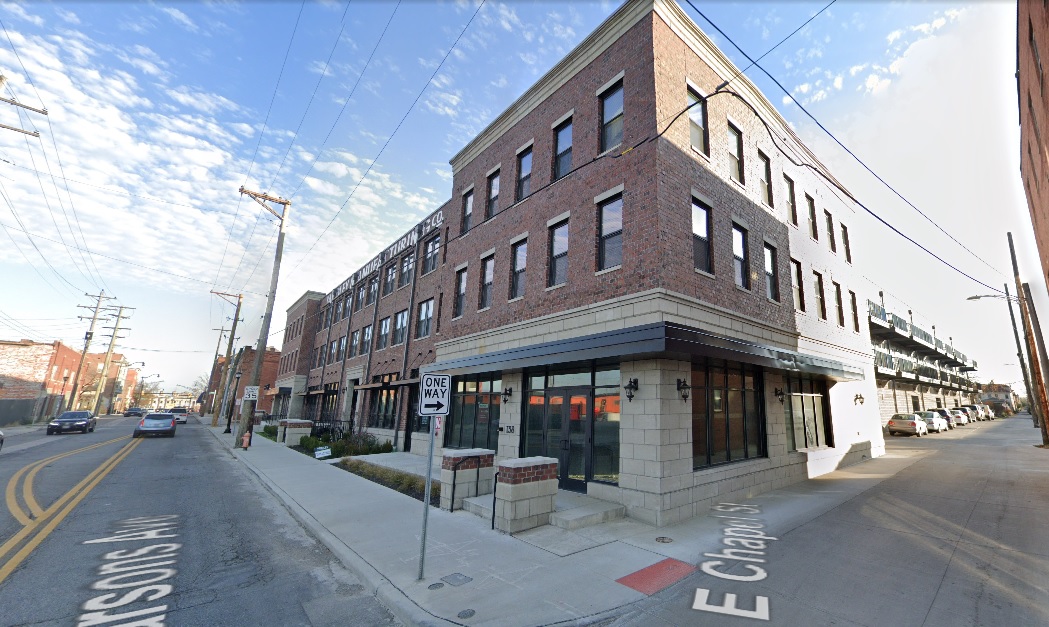
West Side
Parsons Avenue, looking northeast from Chapel Street
Before: 2011

After: 2020

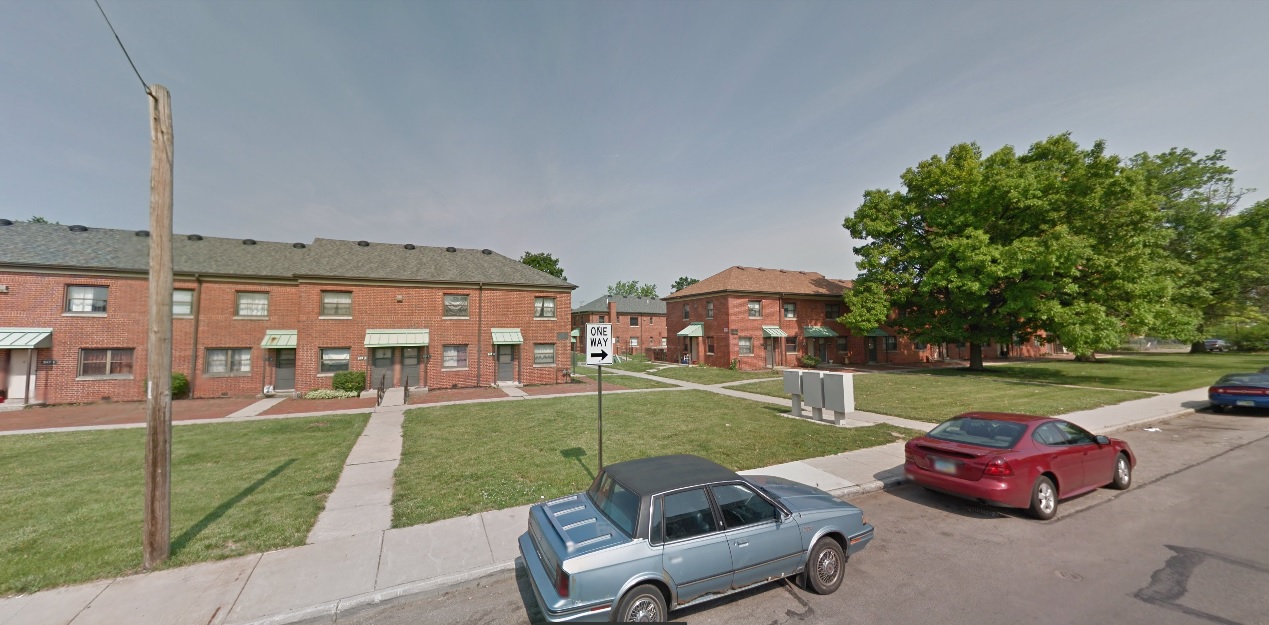
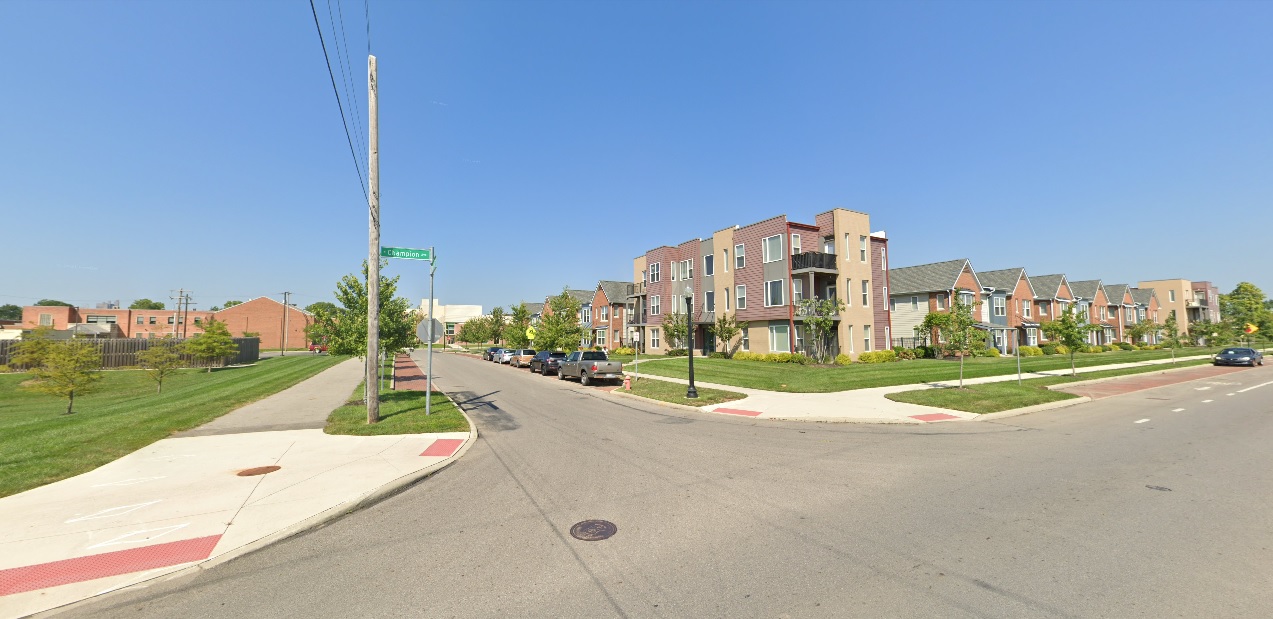
Champion Avenue, looking northwest at Phale D. Hale Drive
Before: 2011

After: 2021

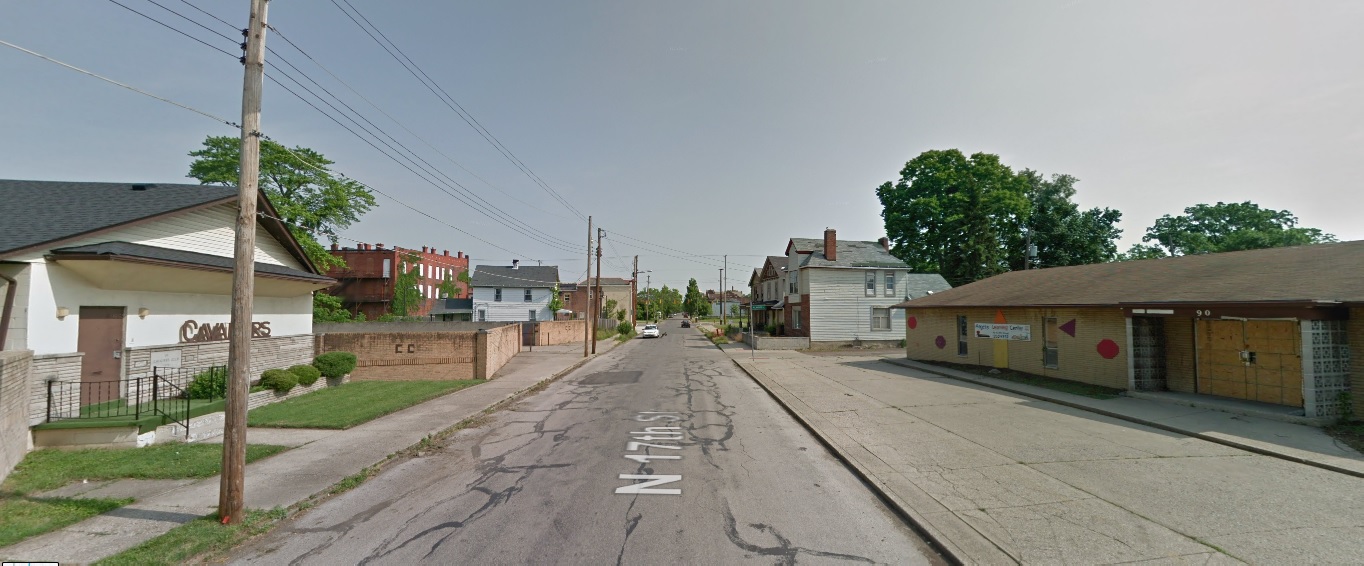
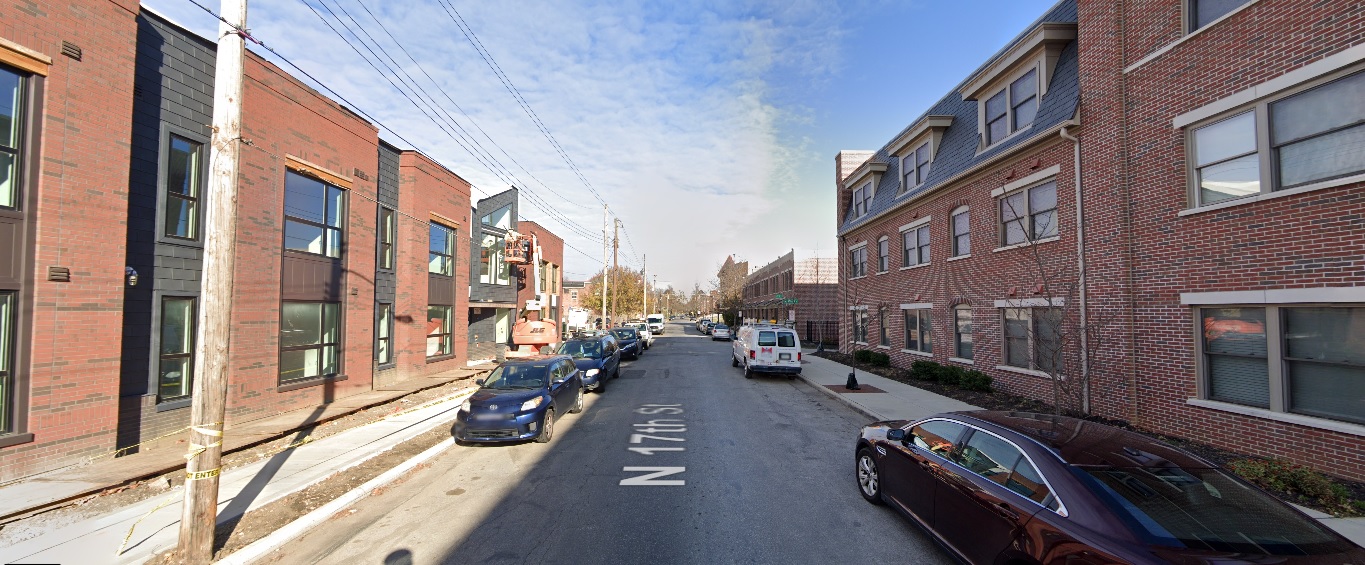
17th Avenue, looking north from Gay Street
Before: 2011

After: 2020

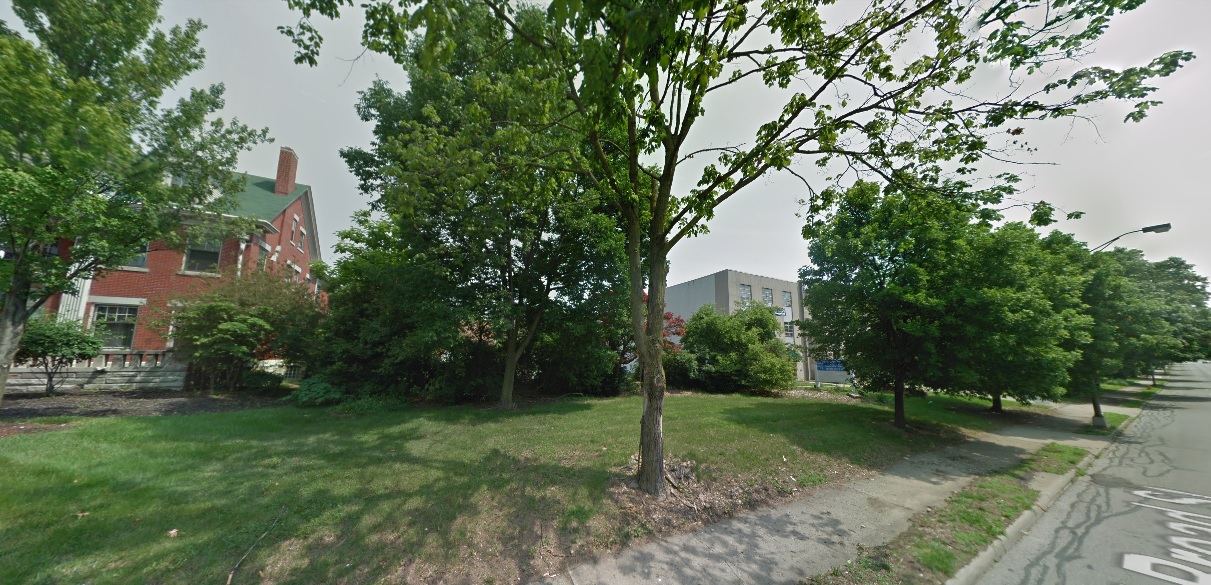
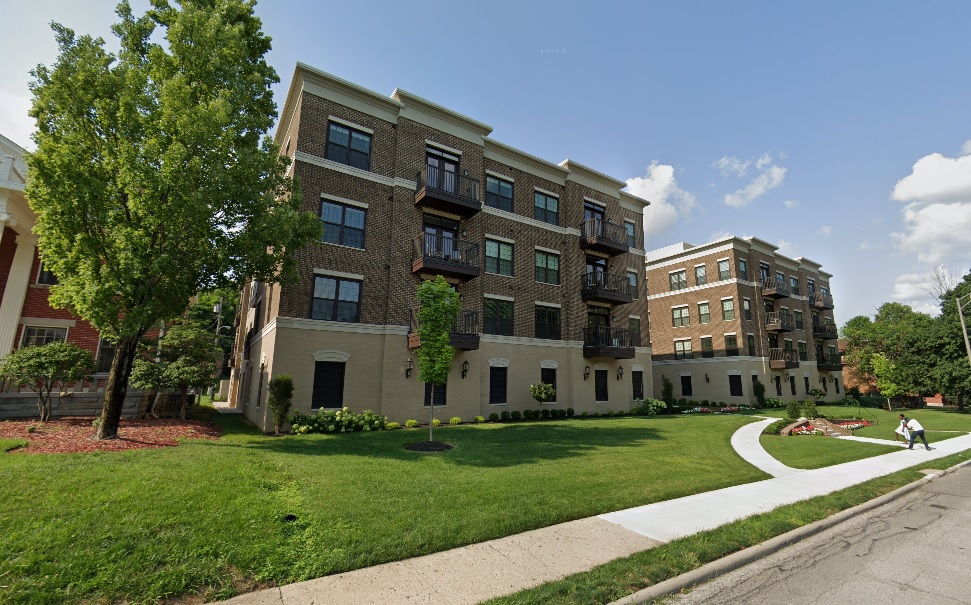
Broad Street, looking northeast west of Woodland Avenue
Before: 2011

After: 2021

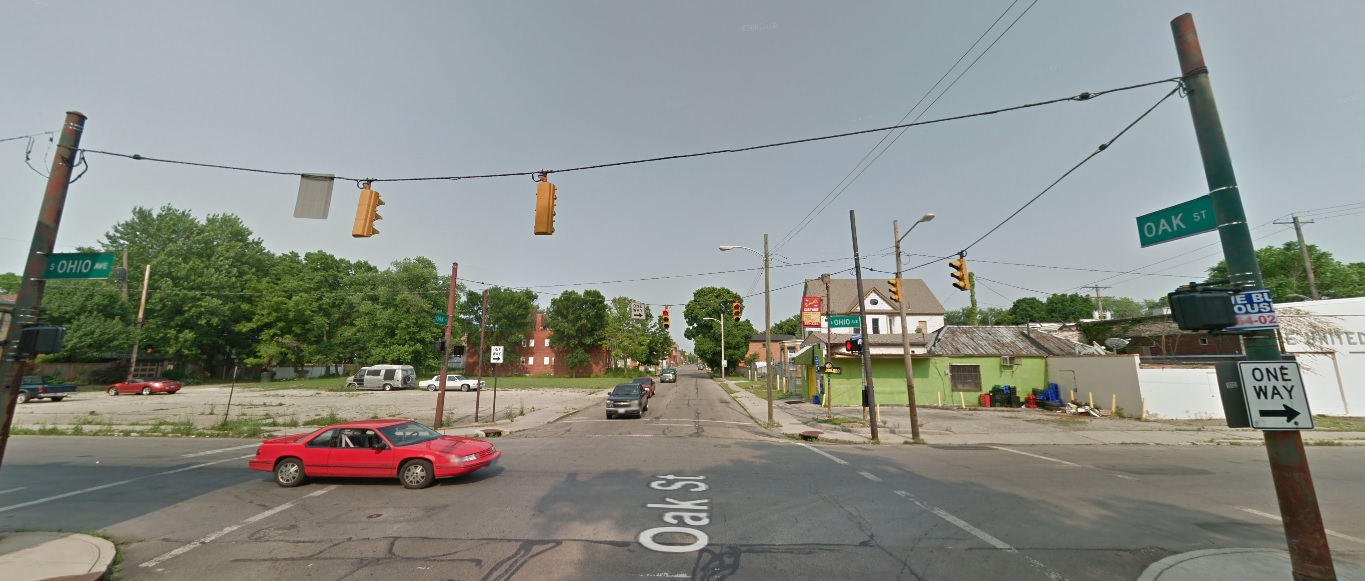
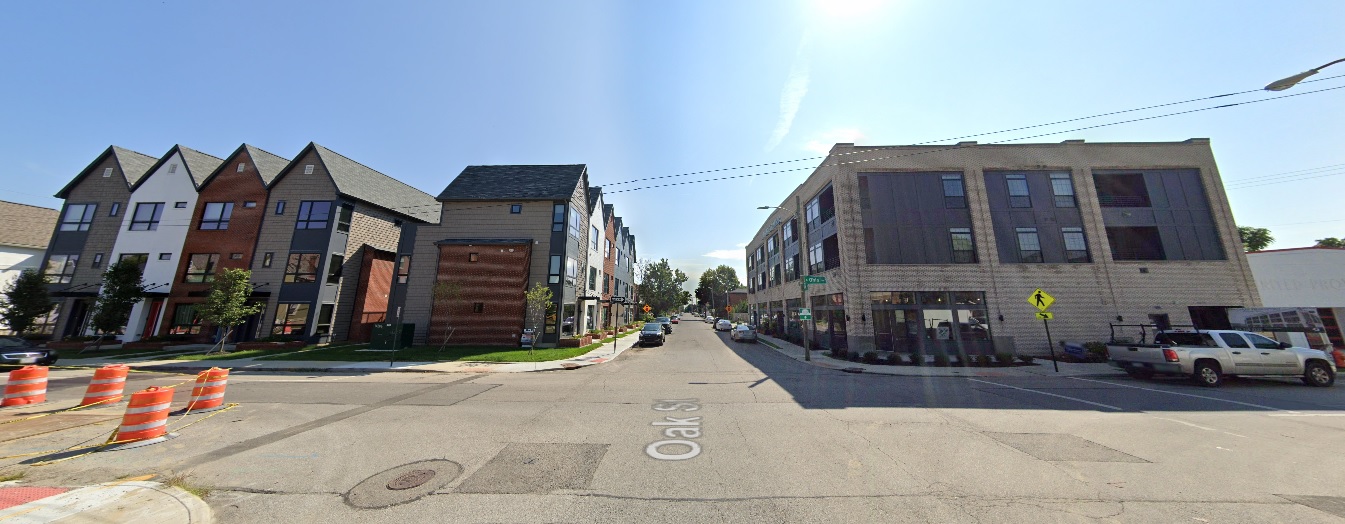
Oak Street, looking east from Ohio Avenue
Before: 2011

After: 2021

These images represent just a small fraction of the development and changes that have occurred in and around the city, and don’t even include the large developments in suburban areas like Grandview Yard in Grandview or Bridge Park in Dublin. The next 10 years looks to be even more significant, with new mixed-use towers for Downtown, potential skyscrapers for Easton, and large numbers of infill development projects continuing in central neighborhoods from Franklinton to Linden to the South Side. With them, the city will continue to grow more dense and more vibrant and- with any luck- will also help spur much needed change to Columbus’ underwhelming transit system.

These Columbus development links show many of the projects seen in the photos, as well as projects that are still just in the proposal stages. The City provides a master list of area development commissions to keep track of the latest proposals.


Strange Columbus September 12, 1962 UFO


Strange Columbus September 12, 1962 UFO Columbus, Ohio

From the files of Project Blue Book, this event was thought to have been an aircraft, but never confirmed. An eyewitness letter is included in the files, but the writing has become so faint as to be mostly unreadable.

For more incidents around the world, visit the following links.
UFO Database
Mutual UFO Network
National UFO Reporting Center


2020 Census of Columbus Area Places


2020 Census of Columbus Area Places

Continuing with the data from the 2020 Census, we break down the population rank for every community and census-designated place in the Columbus metro area. Census-designated places are areas with concentrations of population, but are not part of incorporated villages, towns or cities.

Columbus Metro Area Places Population Rank by Year
2010—————————————————–2020
1. Columbus: 787,033———————–1. Columbus: 905,748
2. Newark: 47,573—————————-2. Newark: 49,934
3. Dublin: 41,751——————————3. Dublin: 49,328
4. Lancaster: 38,780————————-4. Delaware: 41,302
5. Westerville: 36,120————————5. Grove City: 41,252
6. Reynoldsburg: 35,893——————–6. Reynoldsburg: 41,076
7. Grove City: 35,575————————-7. Lancaster: 40,552
8. Delaware: 34,753————————–8. Westerville: 39,190
9. Upper Arlington: 33,771——————9. Hilliard: 37,114
10. Gahanna: 33,248———————–10. Upper Arlington: 36,800
11. Hilliard: 28,435—————————11. Gahanna: 35,726
12. Marysville: 22,094———————-12. Marysville: 25,571
13. Pickerington: 18,291——————-13. Pickerington: 23,094
14. Whitehall: 18,062———————–14. Whitehall: 20,127
15. Pataskala: 14,962———————-15. Pataskala: 17,886
16. Worthington: 13,575——————-16. Worthington: 14,786
17. Circleville: 13,314———————-17. Powell: 14,163
18. Bexley: 13,057————————–18. Bexley: 13,928
19. Powell: 11,500—————————19. Circleville: 13,927
20. Heath: 10,310—————————20. New Albany: 10,825
21. London: 9,904—————————21. Heath: 10,412
22. Lincoln Village CDP: 9,032———–22. London: 10,279
23. Blacklick Estates CDP: 8,682——–23. Lincoln Village CDP: 9,702
24. New Albany: 7,724———————-24. Canal Winchester: 9,107
25. Logan: 7,152—————————–25. Blacklick Estates CDP: 8,990
26. Canal Winchester: 7,101————–26. Grandview Heights: 8,085
27. Grandview Heights: 6,536————-27. Logan: 7,296
28. Granville: 5,646————————–28. Sunbury: 6,614
29. Groveport: 5,363————————-29. Groveport: 6,009
30. New Lexington: 4,731——————30. Granville: 5,946
31. Johnstown: 4,632————————31. Obetz: 5,489
32. Huber Ridge CDP: 4,604————–32. Johnstown: 5,182
33. Lake Darby CDP: 4,592—————-33. Huber Ridge CDP: 4,940
34. Obetz: 4,532——————————-34. Lake Darby CDP: 4,731
35. Sunbury: 4,389—————————-35. Ashville: 4,529
36. Plain City: 4,225————————–36. New Lexington: 4,435
37. West Jefferson: 4,222——————-37. West Jefferson: 4,137
38. Ashville: 4,097—————————–38. Plain City: 4,065
39. Mount Gilead: 3,660———————-39. Mount Gilead: 3,503
40. Beechwood Trails CDP: 3,020———40. Beechwood Trails CDP: 3,276
41. Baltimore: 2,966—————————41. Commercial Point: 3,078
42. Buckeye Lake: 2,746———————42. Baltimore: 2,981
43. Crooksville: 2,534————————-43. Buckeye Lake: 2,520
44. Hebron: 2,336——————————44. Crooksville: 2,418
45. Richwood: 2,229—————————45. Hebron: 2,326
46. Utica: 2,132———————————46. New California CDP: 2,225
47. Cardington: 2,047————————-47. Richwood: 2,222
48. Roseville: 1,852—————————48. South Bloomfield: 2,143
49. Mount Sterling: 1,782——————–49. Lithopolis: 2,134
50. South Bloomfield: 1,744—————–50. Cardington: 2,079
51. Commercial Point: 1,582—————-51. Utica: 2,064
52. Choctaw Lake CDP: 1,546————–52. Choctaw Lake CDP: 2,047
53. Harbor Hills CDP: 1,509—————–53. Minerva Park: 2,009
54. Somerset: 1,481—————————54. Mount Sterling: 1,945
55. Bremen: 1,425—————————–55. Roseville: 1,746
56. New California CDP: 1,411————-56. Harbor Hills CDP: 1,565
57. Granville South CDP: 1,410————57. Somerset: 1,481
58. Ashley: 1,330——————————-58. Bremen: 1,479
59. Fairfield Beach CDP: 1,292————59. Granville South CDP: 1,420
60. Minerva Park: 1,272———————-60. Candlewood Lake CDP: 1,329
61. Etna CDP: 1,215—————————61. Hanover: 1,270
62. Candlewood Lake CDP: 1,147———62. Fairfield Beach CDP: 1,267
63. Logan Elm Village CDP: 1,118———63. Etna CDP: 1,209
64. Lithopolis: 1,106—————————64. Ashley: 1,198
65. Millersport: 1,044————————–65. Ostrander: 1,094
66. Williamsport: 1,023———————–66. Thornville: 1,087
67. Thornville: 991—————————–67. Logan Elm Village CDP: 1,045
68. Pleasantville: 960————————-68. Urbancrest: 1,031
69. Urbancrest: 960—————————69. Millersport: 978
70. Hanover: 921——————————70. Hide-A-Way-Hills CDP: 976
71. Junction City: 819————————71. Williamsport: 970
72. New Holland: 801————————72. Pleasantville: 934
73. Hide-A-Way Hills CDP: 794———–73. Galena: 924
74. Darbydale CDP: 793——————–74. Shawnee Hills: 835
75. Milford Center: 792———————-75. Milford Center: 807
76. Marne CDP: 783————————-76. New Holland: 804
77. Amanda: 737——————————77. Marne CDP: 772
78. New Straitsville: 722——————–78. Darbydale CDP: 768
79. Shawnee Hills: 681———————-79. Junction City: 721
80. Shawnee: 655—————————-80. Amanda: 673
81. Galena: 653——————————-81. Valleyview: 669
82. Ostrander: 643—————————82. New Straitsville: 652
83. Valleyview: 620————————–83. Marble Cliff: 634
84. Thurston: 604—————————-84. Thurston: 603
85. Corning: 583—————————–85. Riverlea: 599
86. Marble Cliff: 573————————-86. Stoutsville: 579
87. Stoutsville: 560—————————87. Buchtel: 518
88. Buchtel: 558——————————-88. Laurelville: 512
89. Riverlea: 545——————————89. Shawnee: 505
90. Laurelville: 527—————————-90. Carroll: 501
91. Kirkersville: 525—————————91. Corning: 488
92. Carroll: 524——————————–92. Alexandria: 483
93. Alexandria: 517—————————93. Kirkersville: 471
94. Murray City: 449————————–94. Sugar Grove: 429
95. Edison: 437——————————–95. Edison: 422
96. Sugar Grove: 426————————96. Hartford: 404
97. Derby CDP: 408————————–97. Derby CDP: 355
98. Hartford: 397——————————98. St. Louisville: 352
99. Haydenville CDP: 381——————99. Murray City: 341
100. St. Louisville: 373———————100. Haydenville CDP: 337
101. South Solon: 355—————————-101. South Solon: 329
102. Marengo: 342——————————–102. Harrisburg: 315
103. Midway: 322———————————-103. Rushville: 304
104. Harrisburg: 320——————————104. Marengo: 283
105. Plumwood CDP: 319———————–105. Raymond CDP: 280
106. Rushville: 302——————————–106. Midway: 269
107. Tarlton: 282———————————–107. Magnetic Springs: 267
108. Orient CDP: 270—————————–108. Plumwood CDP: 257
109. Magnetic Springs: 268———————109. Tarlton: 254
110. Fulton: 258————————————110. Fulton: 250
111. Raymond CDP: 257————————111. Orient CDP: 246
112. Lockbourne: 237—————————-112. Unionville Center: 241
113. Carbon Hill CDP: 233———————113. Lockbourne: 236
114. Unionville Center: 233——————–114. Gratiot: 215
115. Chesterville: 228—————————-115. Brownsville CDP: 214
116. Darbyville: 222——————————116. Lafayette CDP: 206
117. Gratiot: 221———————————-117. Chesterville: 191
118. Brownsville CDP: 220———————118. Darbyville: 186
119. Lafayette CDP: 202————————119. Radnor CDP: 180
120. Radnor CDP: 201————————–120. Carbon Hill CDP: 178
121. Rockbridge CDP: 182———————121. West Rushville: 166
122. Glenford: 173——————————–122. Glenford: 165
123. Sparta: 161———————————–123. Rockbridge CDP: 160
124. Hemlock: 155——————————–124. Hemlock: 142
125. Kilbourne CDP: 139————————125. Kilbourne CDP: 127
126. West Rushville: 134————————126. Sparta: 121
127. Brice: 115————————————-127. Brice: 93
128. Rendville: 36———————————128. Rendville: 28


Population Change Rank 2010-2020 for Columbus Metro Places
1. Columbus: +118,715
2. Hilliard: +8,679
3. Dublin: +7,577
4. Delaware: +6,549
5. Grove City: +5,677
6. Reynoldsburg: 5,183
7. Pickerington: +4,803
8. Marysville: +3,477
9. New Albany: +3,101
10. Westerville: +3,070
11. Upper Arlington: +3,029
12. Pataskala: +2,924
13. Powell: +2,663
14. Gahanna: +2,478
15. Newark: +2,361
16. Sunbury: +2,225
17. Whitehall: +2,065
18. Canal Winchester: +2,006
19. Lancaster: +1,772
20. Grandview Heights: +1,549
21. Commercial Point: +1,496
22. Worthington: +1,211
23. Lithopolis: +1,028
24. Obetz: +957
25. Bexley: +871
26. New California CDP: +814
27. Minerva Park: +737
28. Lincoln Village CDP: +670
29. Groveport: +646
30. Circleville: +613
31. Johnstown: +550
32. Choctaw Lake CDP: +501
33. Ostrander: +451
34. Ashville: +432
35. South Bloomfield: +399
36. London: +375
37. Hanover: +349
38. Huber Ridge CDP: +336
39. Blacklick Estates CDP: +308
40. Granville: +300
41. Galena: +271
42. Beechwood Trails CDP: +256
43. Candlewood Lake CDP: +182
44. Hide-A-Way Hills CDP: +182
45. Mount Sterling: +163
46. Shawnee Hills: +154
47. Logan: +144
48. Lake Darby CDP: +139
49. Heath: +102
50. Thornville: +96
51. Urbancrest: +71
52. Marble Cliff: +61
53. Harbor Hills CDP: +56
54. Bremen: +54
55. Riverlea: +54
56. Valleyview: +49
57. Cardington: +32
58. West Rushville: +32
59. Raymond CDP: +23
60. Stoutsville: +19
61. Baltimore: +15
62. Milford Center: +15
63. Granville South CDP: +10
64. Unionville Center: +8
65. Hartford: +7
66. Lafayette CDP: +4
67. New Holland: +3
68. Sugar Grove: +3
69. Rushville: +2
70. Somerset: +0
71. Lockbourne: -1
72. Magnetic Springs: -1
73. Thurston: -1
74. Harrisburg: -5
75. Brownsville CDP: -6
76. Etna CDP: -6
77. Gratiot: -6
78. Richwood: -7
79. Fulton: -8
80. Glenford: -8
81. Rendville: -8
82. Hebron: -10
83. Marne CDP: -11
84. Kilbourne CDP: -12
85. Hemlock: -13
86. Edison: -15
87. Laurelville: -15
88. St. Louisville: -21
89. Radnor CDP: -21
90. Brice: -22
91. Rockbridge CDP: -22
92. Carroll: -23
93. Orient CDP: -24
94. Darbydale CDP: -25
95. Fairfield Beach CDP: -25
96. Pleasantville: -26
97. South Solon: -26
98. Tarlton: -28
99. Alexandria: -34
100. Darbydale CDP: -36
101. Chesterville: -37
102. Buchtel: -40
103. Sparta: -40
104. Haydenville CDP: -44
105. Derby CDP: -53
106. Midway: -53
107. Williamsport: -53
108. Kirkersville: -54
109. Carbon Hill CDP: -55
110. Marengo: -59
111. Plumwood CDP: -62
112. Amanda: -64
113. Millersport: -66
114. Utica: -68
115. New Straitsville: -70
116. Logan Elm Village CDP: -73
117. West Jefferson: -85
118. Corning: -95
119. Junction City: -98
120. Roseville: -106
121. Murray City: -108
122. Crooksville: -116
123. Ashley: -132
124. Shawnee: -150
125. Mount Gilead: -157
126. Plain City: -160
127. Buckeye Lake: -226
128. New Lexington: -296

The main story with the 2020 census numbers is that smaller communities in rural counties generally declined the past decade. This followed a similar story with non-metro counties, not only in Ohio, but nationally. Population continues to concentrate closer to more urban areas, which tend to be the job centers. If such population declines continue in the decades ahead, many of these small towns and villages may die out.

These trends also have potential impacts on the upcoming state redistricting. With conservative, rural areas emptying out and more liberal cities and urban areas growing, how will this affect how congressional districts get drawn?

For more historic population and demographic data, visit the following links:
Columbus City Population and Demographics
Suburban Population and Demographics
Columbus vs. Other Places
US Census