Winter 2014-2015 Review


Winter 2014-2015 Review Columbus, Ohio

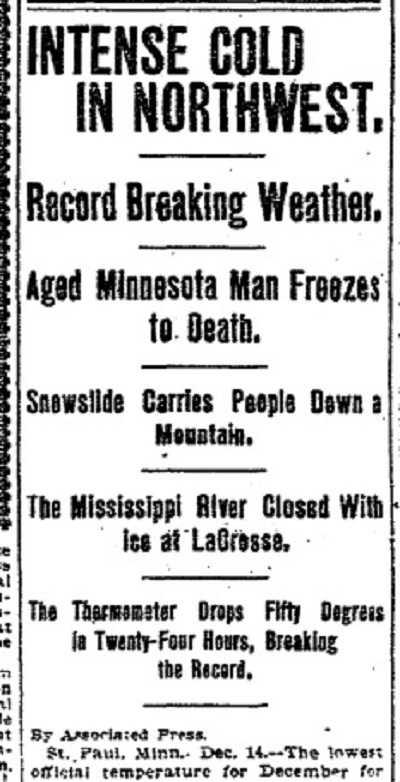
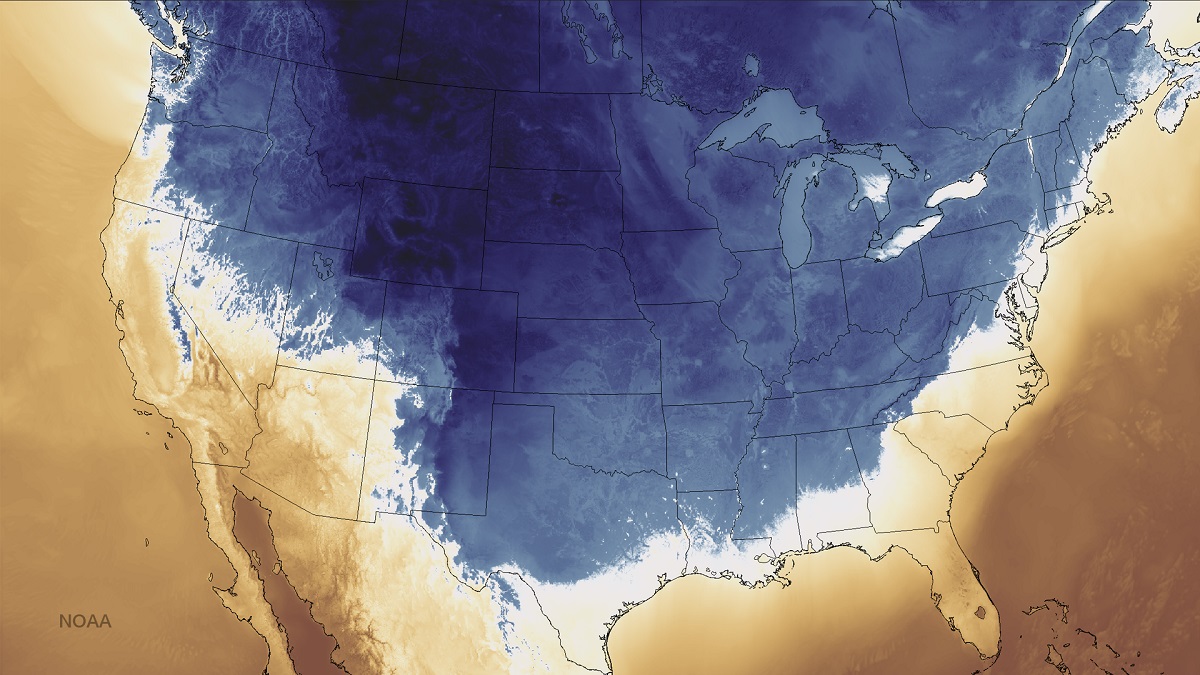
The mid-November 2014 cold wave that kickstarted a historic winter.

The Winter 2014-2015 Review details the historic season, with its bouts of extreme cold and heavy snowfall occurring in all months except December.

Temperature and snowfall ranking data goes back to the winter of 1878-1879. Snow depth ranking data goes back to 1940.

December-February Only
Average High: 34.8 19th Coldest
Average Low: 19.3 14th Coldest
Mean: 27.1 15th Coldest
Precipitation: 7.27″ 57th Driest
Snowfall: 23.9″ 33rd Snowiest
Average Daily Snow Depth: 0.9″ 15th Highest
Largest Snowstorm: 6.8″ on February 21st
32 or Below Highs: 36 14th Most
32 or Below Lows: 76 13th Most
Measurable Precipitation Days: 36 12th Fewest
Measurable Snowfall Days: 15 11th Fewest
Deepest Snow Depth: 6″ on February 21st
Days with 1″+ Snow Depth: 30 16th Most

Entire Cold Season: October-April
Average High: 46.6 14th Coldest
Average Low: 29.4 14th Coldest
Mean: 38.0 14th Coldest
Precipitation: 19.51″ 67th Wettest
Snowfall: 33.4″ 28th Snowiest
Average Snow Depth: 0.6″ 7th Lowest
Largest Snowstorm: 6.8″ on February 21st
32 or Below Highs: 43 12th Most
32 or Below Lows: 116 17th Most
Measurable Precipitation Days: 89 16th Most
Measurable Snowfall Days: 22 13th Fewest
Deepest Snow Depth: 6″ on February 21st
Days with 1″+ Snow Depth: 45 8th Most

Average High By Month
October 2014: 63.4 32nd Coldest
November 2014: 45.7 9th Coldest
December 2014: 42.1 33rd Warmest
January 2015: 33.8 32nd Coldest
February 2015: 28.6 5th Coldest
March 2015: 47.6 37th Coldest
April 2015: 63.5 34th Warmest

Average Low By Month
October 2014: 45.4 37th Warmest
November 2014: 30.0 6th Coldest
December 2014: 29.9 19th Warmest
January 2015: 18.1 33rd Coldest
February 2015: 10.0 3rd Coldest
March 2015: 28.1 22nd Coldest
April 2015: 42.9 28th Warmest

Mean By Month
October 2014: 54.4 35th Coldest
November 2014: 37.9 7th Coldest
December 2014: 36.0 27th Warmest
January 2015: 26.0 31st Coldest
February 2015: 19.3 2nd Coldest
March 2015: 37.9 33rd Coldest
April 2015: 53.2 28th Warmest

Precipitation By Month
October 2014: 2.77″ 42nd Wettest
November 2014: 1.46″ 22nd Driest
December 2014: 2.70″ 63rd Driest
January 2015: 2.87″ 51st Wettest
February 2015: 1.70″ 45th Driest
March 2015: 3.92″ 45th Wettest
April 2015: 4.09″ 37th Wettest

Snowfall By Month
October 2014: Trace 2nd Least Snowy
November 2014: 4.1″ 15th Snowiest
December 2014: Trace 2nd Least Snowy
January 2015: 8.4″ 48th Snowiest
February 2015: 15.5″ 8th Snowiest
March 2015: 5.4″ 23rd Snowiest
April 2015: 0.0″ 1st Least Snowy

Average Snow Depth By Month
October 2014: 0″
November 2014: 0.4″
December 2014: 0″
January 2015: 0.8″
February 2015: 3.3″
March 2015: 1.1″
April 2015: 0″


Maximum High By Month
October 2014: 86 on the 2nd
November 2014: 69 on the 11th
December 2014: 61 on the 1st
January 2015: 59 on the 3rd
February 2015: 56 on the 8th
March 2015: 69 on the 16th
April 2015: 79 on the 13th and 18th

Minimum High By Month
October 2014: 49 on the 31st
November 2014: 19 on the 18th
December 2014: 26 on the 31st
January 2015: 13 on the 7th
February 2015: 8 on the 15th and 19th
March 2015: 23 on the 5th and 6th
April 2015: 50 on the 23rd

Minimum High Records
-The 33 on November 14th was a record for the day, beating the old record of 34 set in 1900, 1908, 1911 and 1916.
-The 19 on November 18th tied the record for the day set in 1904.
-The 8 on February 15th was a record for the day, beating the old record of 12 set in 1920.
-The 10 on February 16th was a record for the day, beating the old record of
-The 8 on February 19th was a record for the date, beating the old record of 10 set in 1885.
-The 18 on February 27th tied the record for the date set in 1888 and 1934.
-The 25 on February 28th was a record for the date, beating the old record of 26 set in 1986.

Maximum Low By Month
October 2014: 58 on the 13th and 14th
November 2014: 47 on the 4th
December 2014: 44 on the 23rd
January 2015: 34 on the 18th and 21st
February 2015: 41 on the 8th
March 2015: 43 on the 16th
April 2015: 57 on the 19th

Maximum Low Records
-The 54 on November 30th was a record for the date, beating the old record of 53 set in 1998 and 2006.

Minimum Low By Month
October 2014: 38 on the 4th, 26th and 31st
November 2014: 12 on the 18th
December 2014: 15 on the 15th
January 2015: -6 on the 8th
February 2015: -11 on the 24th
March 2015: 4 on the 6th
April 2015: 28 on the 24th

Minimum Low Records
-The -11 on February 24th was a record for the date, beating the old record of -1 set in 1914.
-The 0 on February 28th was a record for the date, beating the old record of 2 set in 1934.
-The 28 on April 24th tied the record for the date set in 1930.

Highest Daily Precipitation By Month
October 2014: 0.57″ on the 6th
November 2014: 0.39″ on the 17th
December 2014: 0.82″ on the 6th
January 2015: 1.46″ on the 3rd
February 2015: 0.55″ on the 1st
March 2015: 0.63″ on the 14th
April 2015: 0.66″ on the 2nd

Highest Daily Snowfall By Month
October 2014: Trace on the 4th
November 2014: 3.8″ on the 17th
December 2014: Trace on the 10th, 17th, 18th, 19th, 20th and 31st
January 2015: 3.7″ on the 6th
February 2015: 6.8″ on the 21st
March 2015: 3.6″ on the 1st
April 2015: 0.0″

Snowfall Records
-The 6.8″ on February 21st was a record for the day, beating the old record of 5.8″ set in 1893.
-The 3.6″ on March 1st was a record for the date, beating the old record of 3.5″ set in 1954.

Deepest Snow Depth By Month
October 2014: 0″
November 2014: 3″ on the 18th and 19th
December 2014: 0″
January 2015: 3″ on the 6th, 7th and 9th
February 2015: 6″ on the 21st
March 2015: 6″ on the 1st and 2nd
April 2015: 0″

For more winter records and local weather information, visit the following links.
Winter Season Records
Wilmington National Weather Service


January 1879 Arctic Outbreak


January 1879 arctic outbreak

After a generally cold December, the January 1879 arctic outbreak would begin the new year, leading to Columbus’ 2nd coldest temperature ever officially recorded. The outbreak began on January 2nd, when a strong cold front moved in from the northwest in the early afternoon hours. The temperature fell rapidly during the evening, reaching a low of -13 on the 2nd for a total drop that day of 42 degrees. The core of the cold air moved across Ohio during the day of the 3rd, so temperatures warmed very little. Highs across the state were in the single digits south to below zero across the norther 2/3rds. Columbus had a rare below zero high of -4, which is the 2nd coldest January high on record and the 3rd coldest high of any month. The low on the 3rd was a frigid -20. This low stood as the coldest temperature in Columbus for 115 years, only being surpassed during the great arctic outbreak of January 1994, during which the temperature fell to -22.

The strong front was very moisture starved, and only a few tenths to an inch to an inch of snow fell with its passage.

Temperatures remained in the single digits for two more days before a gradual warming commenced. By the 8th temperatures went above freezing. The rest of January 1879 was fairly tame. 16 days after the 8th had highs of 35 or greater.

Of note is that the temperature of -20 occurred two more times before the end of the 19th century, in January 1884 and February 1899.

The Blizzard of 1996


The first two weeks of January 1996 proved to be a very wintry period, culminating in the severe Blizzard of 1996. Although this storm was made famous for its effects on the Eastern Seaboard, it also had a significant impact on areas to the west of the Appalachians, and was one of the worst winter storms the state had seen in nearly 20 years.

This storm developed in the Gulf of Mexico on January 6th and moved up along the East Coast through the 7th. Forecasts for Ohio were not especially indicative of an impending major storm. A weak low pressure moving through the Ohio and Tennessee Valleys was supposed to die out as the main storm on the Coast took over. Therefore, Ohio was not forecast to be hit especially hard from this storm, as the Area Forecast Discussion goes into on the after of January 5th.
FORECAST COORDINATION MESSAGE
NATIONAL WEATHER SERVICE WILMINGTON OH
243 PM EST FRI JAN 5 1996
AGAIN HVG TRBL GETTING GRIDDED DATA. CLDY SKIES WILL KEEP TEMPS FROM PLUMMETING AGAIN OVRNITE. SCT SW– AFT 00Z AS S/W APPCHS FROM
WEST…SEEMS TO BE RIGHT OUT AHD OF NOSE OF S/W. THEN FOR SAT…
SFC TROF SETS UP ON WEST SIDE OF APALACHIANS…WAITING FOR STRONG VORT TO SWING AROUND BASE OF 500 TROF. AFT COORD W/ CLE WILL FOLLOW ETA…WHICH BRINGS MOIST AND RAIN BIT FARTHER NORTH. SFC LO FAR SOUTH…WITH 500 /700 LO TRACKING CLOSE TO OUR REGION. RH FIELD SHWS NRN EDGE OF 90% MVNG OVR NRN KY/SRN OH ON DURING THE DAY SAT. MOIST HOLDS THRU SUN W/ 700/850 LO/S TRACKING SOUTH OF THE REGION. ETA QPF SHWG ABT .10 TO .25 INCH ACROSS SRN PART OF REGION…AFT COORD W/ CLE/IND/SDF ALL THINKING ABT SAME. NRN KY 4-5″ TOTAL THRU SUN…SRN OH 2-4″ AND 2-3″ SE INDIANA. FROM DAY TO CMH NORTH AROUND AN INCH OR LESS. IND HAS SNOW ENDING LATE SAT NITE…W/ ENZDING SPREADING EAST ON SUNDAY.

As the highlighted section shows, the Wilmington office was thinking 1″ or less for the I-70 corridor and points north, including Columbus, with only 2″-4″ in far Southern Ohio.
The first weather advisories for the storm went up at 5:20AM on Saturday, January 6th. For Ohio, this only included a Winter Storm Watch for far Southeast and far South-Central parts of the state, where 4″-6″ were predicted. No advisories were issued for the Columbus area until 4:10PM on the 6th.

SPECIAL WEATHER STATEMENT
NATIONAL WEATHER SERVICE WILMINGTON OH
410 PM EST SAT JAN 6 1996
…WINTER STORM WARNING FOR TONIGHT AND SUNDAY FOR SOUTHERN OHIO AND NORTHERN KENTUCKY…
…SNOW ADVISORIES ARE IN EFFECT FOR EXTREME SOUTHEAST INDIANA FOR
TONIGHT AND FOR THE DAYTON AND COLUMBUS AREAS FOR TONIGHT AND
SUNDAY…
TOTAL SNOW ACCUMULATIONS BY SUNDAY MORNING WILL BE IN THE 8 TO 12 INCH RANGE OVER NORTHEAST KENTUCKY…4 TO 8 INCHES CAN BE EXPECTED ACROSS THE PORTSMOUTH AREA AND ALONG THE OHIO RIVER TO COVINGTON AND DRY RIDGE.
VERSAILLES…CINCINNATI…HILLSBORO AND CHILLICOTHE SHOULD SEE 3 TO 5
INCHES TOTAL ACCUMULATION. ACROSS RICHMOND…DAYTON…LONDON AND
COLUMBUS 1 TO 3 INCHES ARE EXPECTED.
AN INTENSE LOW PRESSURE SYSTEM WILL MOVE NORTHEAST THROUGH THE
APPALACHIANS TODAY. PLENTY OF MOISTURE WILL BE ASSOCIATED WITH THIS LOW AND WILL RESULT IN SIGNIFICANT SNOW ACCUMULATIONS OVER SOUTHERN OHIO…SOUTHEAST INDIANA AND NORTHERN KENTUCKY.
SNOW WILL FALL THROUGH SUNDAY MORNING. EXPECT ROAD CONDITIONS TO
DETERIORATE THIS EVENING. DRIVING CONDITIONS ARE EXPECTED TO REMAIN HAZARDOUS OVERNIGHT WHEN HEAVIER SNOW BEGINS. VISIBILITIES WILL BE REDUCED TO NEAR ZERO BECAUSE OF BLOWING AND DRIFTING SNOW.

The Snow Advisory was only for 1″-3″ for Columbus even as the storm approached from the south. Later forecast updates at 5:55PM and 9:35PM on the 6th, and 12:35AM on the 7th still called for 1″-3″ for Columbus. Snowfall would begin in Columbus around 8PM on the 6th.

I have very vivid memories of seeing the afternoon and evening news on the 6th and being disappointed that the forecasts called for the storm to pass us well to the south and east. However, by the morning of the 7th, it was clear that the forecast had gone very wrong. Heavy snow and strong winds affected mainly the southern 2/3rds of the state, and the I-70 corridor was already reporting 3″-5″ by 6AM. By 11AM, Columbus had 4″-7″. Curiously, Wilmington wouldn’t add the I-70 corridor to a Winter Storm Warning until that time, after more than half of the snow had already fallen.

Blizzard conditions, however, raged across central, west-central and northwestern sections of the state, where winds gusted over 55mph in places. Blowing and drifting snowfall piled drifts several feet deep, and travel across the state was made impassible, particularly on country roads. For many, this was one of the greatest January snowstorms ever, and in some cases, the worst storm since the Great Blizzard of 1978. 8-10″ was common in the southern 2/3rds of the state, but there was as much as 15″ in parts of the Ohio River communities, as well as areas in west-central Ohio.

Some snowfall totals around Ohio:
Cincinnati: 14.4″
Circleville: 9.0″
Columbus: 9.8″
Dayton: 8.0″
Delaware: 7.0″
Mansfield: 8.0″
Westerville: 8.0″
Zanesville: 7.9″

So why had the forecast gone so wrong? The weak low pressure that was supposed to die off as the larger system wound up along the East Coast did not die out as expected. Instead, it moved into the lower Ohio Valley and essentially stalled as it slowly spun itself down. This low helped suck moisture over the mountains and into Ohio. Temperatures were cold enough for this moisture to fall as all snow, and a tight gradient brought with it strong winds. The result was a paralyzing winter storm and one of the all-time forecast busts.


The 1901 Mega Cold Front


1901 mega cold front

The 1901 mega cold front was a massive wake-up call after a relatively tranquil, if not cool, fall. Temperatures through November and early December 1901 had been persistently below normal. 24 days in November had been below normal, and but for a few days very early in December, this pattern continued. However, beginning on December 11th, temperatures began to rise ahead of an approaching weather system. By the 13th, temperatures reached record highs in Columbus when they spiked at 65 degrees. The following day started equally warm with a record high of 65. However, a change was coming.

To the northwest of Ohio, temperatures were plunging rapidly as a deep, cold high pressure system was being pulled south. Dispatch headlines warned of the record-breaking cold.

A powerful cold front would move through late on the 14th, and temperatures began to plummet. By midnight, the temperature had dropped all the way down to just 14 degrees, a single day drop of 51 degrees! A driving rain accompanied the frontal passage, but quickly changed over to heavy snow that accumulated 3″-5″ across the area.

On the 15th, the temperature continued to fall, albeit more slowly, and by midnight the reading was -4. This mega-cold front had produced a 69-degree total drop in Columbus, which made it one of the strongest cold fronts ever to move through the Ohio region.

The weather map on December 14, 1901, as the front began pushing through Ohio.

The front would bring a major pattern change. Every day from the 15th-21st featured highs in the teens, which set many daily low maximum records, some of which still stand more than 100 years later.

The winter of 1901-02 was generally cold and snowy in the Ohio Valley, but no future front that winter would come close to December 14-15th of 1901.

To view more local and current weather, visit: Wilmington National Weather Service
And for more historic December records, check out: December Weather Records


Independence Day Climatology


Independence Day climatology Columbus, Ohio

In honor of the 4th, here is the history of Independence Day climatology and extreme weather events.

Normals
High: 85
Low: 65
Mean: 75
Precipitation: 0.15″

# of July 4ths Where the Maximum was…
100 or Above: 3
90 or Above: 34
80 and Above: 104
79 and Below: 31
69 and Below: 2

# of July 4ths Where the Minimum was…
70 or Above: 26
60 or Above: 95
59 or Below: 40
49 or Below: 2

Top 5 Warmest Highs
1. 1911: 104
2. 1897: 102
3. 2012: 100
4. 1919: 97
5. 1900, 1921, 1949, 2002: 96

Top 5 Coldest Highs
1. 1882, 1922: 69
2. 1924, 1967, 1978, 2008: 71
3. 1909, 1927, 1972, 1979: 72
4. 1920: 73
5. 1937, 1989: 74

Top 5 Warmest Lows
1. 1911: 79
2. 1897, 1900, 1999: 75
3. 1879, 1921: 74
4. 1883, 1902, 2012: 73
5. 1899, 1919, 1991, 2004: 72

Top 5 Coldest Lows
1. 1968: 47
2. 1963: 49
3. 1996: 50
4. 1986: 51
5. 1927, 1940: 52

# of July 4ths where Precipitation was…
0: 65
Trace: 18
0.01-0.24: 32
0.25-0.49: 8
0.50-0.74: 8
0.75-0.99: 2
1.00 and Above: 2

Top 10 Wettest
1. 1984: 1.38″
2. 1935: 1.04″
3. 1915: 0.86″
4. 1932: 0.84″
5. 1957: 0.66″
6. 2008: 0.61″
7. 1939: 0.60″
8. 2003: 0.59″
9. 1926: 0.58″
10. 2006: 0.56″

Ohio’s most infamous July 4th weather event, occurred in 1969. Severe thunderstorms developed over southeastern Michigan and moved southeastward into the Ohio lakeshore communities around 7:30PM on July 4th. Every lakeshore community from Toledo to Cleveland was affected, as well as areas further inland. The storms continuously trained over the same areas from Lucas to Wayne counties for several hours, dropping torrential rains, tornadoes, high winds, hail and lightning. Rainfall in a 100-mile stretch from just southeast of Toledo into Wayne County totaled 6″-14″. These rains caused record local flooding. All told, the storms of July 4th-5th, 1969 caused $65 million in damage, damaged or destroyed 10,000 homes, 7,000 cars, 104 businesses, 300 mobile homes and more than 700 boats. 41 people were killed and 559 were injured, mostly from flooding. This was the 3rd most damaging flood in Ohio history, behind January 1959 and March 1913. Columbus was too far south to see any of the storms and received just 0.03″ of rain for the period.