2018 Columbus Racial Diversity Comparison


racial diversity comparison

Yesterday, the US Census released tons of new demographic data for 2018. The next few posts will detail some of that data and how Columbus compares to Midwestern and national peers in terms of population, racial diversity and other metrics. These peers are based on either large Midwestern cities or metro areas between 1.5-2.5 million.
This post will be a racial diversity comparison, specifically.

Total Non-Hispanic White Population by City by Year
2010———————————–2018

1. Chicago: 853,910————–1. Chicago: 899,980
2. Indianapolis: 482,195———2. Columbus: 486,431
3. Columbus: 470,971———–3. Austin: 470,620
4. Jacksonville, FL: 452,926—-4. Indianapolis: 465,466
5. Portland, OR: 417,876——–5. Portland: 457,042
6. Austin: 384,065—————6. Jacksonville: 455,487
7. Virginia Beach: 282,812——7. Omaha: 307,845
8. Las Vegas: 280,604———-8. Virginia Beach: 275,371
9. Omaha, NE: 277,606———9. Las Vegas: 272,870
10. San Jose, CA: 265,311——10. Kansas City: 269,854
11. Kansas City, MO: 247,473–11. San Jose: 253,571
12. Wichita, KS: 245,146——-12. Minneapolis: 252,327
13. Minneapolis: 242,848——13. Wichita: 242,671
14. Milwaukee: 221,514——–14. Lincoln: 227,215
15. Lincoln, NE: 216,076——-15. Milwaukee: 204,250
16. Pittsburgh: 203,622——–16. Pittsburgh: 195,468
17. Fort Wayne, IN: 179,646—17. Madison: 186,034
18. Madison, WI: 178,307——18. Fort Wayne: 173,088
19. Toledo: 177,341————–19. St. Paul: 159,782
20. Sacramento, CA: 165,610–20. Sacramento: 158,333
21. St. Paul, MN: 159,704——-21. Toledo: 157,967
22. Des Moines, IA: 145,937—22. Cincinnati: 150,693
23. Cincinnati: 143,120———23. Des Moines: 137,268
24. Cleveland: 137,977———24. St. Louis: 133,688
25. St. Louis: 134,146———–25. Cleveland: 131,010
26. Grand Rapids, MI: 104,636–26. Grand Rapids: 115,719
27. Providence, RI: 64,284——27. Detroit: 72,982
28. Detroit: 55,298————–28. Providence: 58,856

Previous peers, such as San Antonio, Charlotte and Orlando were removed as their metros are now larger than the 2.5 million comparison limit.  Jacksonville, Florida entered the comparison with a metro population of just over 1.5 million in 2018.  Smaller Ohio cities like Dayton, Akron, Canton and Youngstown, which are normally compared, did not have this data available.

Total Non-Hispanic White Change 2010-2018
1. Austin: +86,555
2. Chicago: +46,070
3. Portland: +39,166
4. Omaha: +30,239
5. Kansas City: +22,381
6. Detroit: +17,684
7. Columbus: +15,460
8. Lincoln: +11,139
9. Grand Rapids: +11,083
10. Minneapolis: +9,479
11. Madison: +7,727
12. Cincinnati: +7,573
13. Jacksonville: +2,561
14. St. Paul: +28
15. St. Louis: -458
16. Wichita: -2,475
17. Providence: -5,428
18. Fort Wayne: -6,558
19. Cleveland: -6,967
20. Sacramento: -7,277
21. Virginia Beach: -7,441
22. Las Vegas: -7,734
23. Pittsburgh: -8,154
24. Des Moines: -8,669
25. San Jose: -11,740
26. Indianapolis: -16,729
27. Milwaukee: -17,264
28. Toledo: -19,374

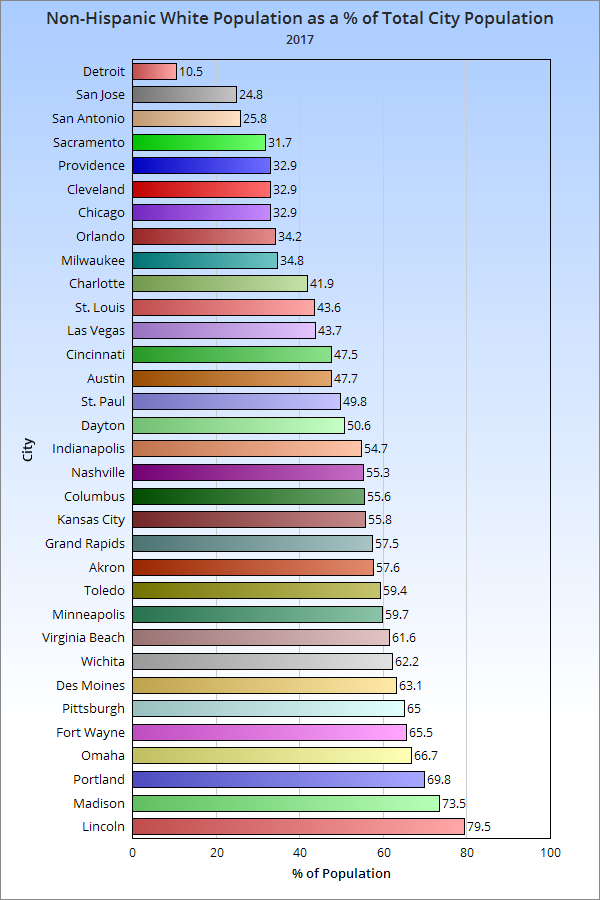
Non-Hispanic White % of Total Population by City in 2018
1. Lincoln: 79.1%
2. Madison: 72.1%
3. Portland: 70.0%
4. Omaha: 65.7%
5. Fort Wayne: 65.5%
6. Pittsburgh: 64.9%
7. Des Moines: 63.3%
8. Wichita: 62.3%
9. Virginia Beach: 61.2%
10. Minneapolis: 59.3%
11. Grand Rapids: 57.8%
12. Toledo: 57.5%
13. Kansas City: 54.9%
14. Columbus: 54.3%
15. Indianapolis: 53.9%
16. St. Paul: 51.9%
17. Jacksonville: 50.4%
18. Cincinnati: 49.8%
19. Austin: 48.8%
20. St. Louis: 44.2%
21. Las Vegas: 42.3%
22. Milwaukee: 34.5%
23. Cleveland: 34.1%
24. Chicago: 33.3%
25. Providence: 32.8%
26. Sacramento: 31.1%
27. San Jose: 24.6%
28. Detroit: 10.9%

Total Non-Hispanic Black Population by City by Year
2010————————————2018
1.  Chicago: 895,294————1. Chicago: 784,266
2. Detroit: 587,707————–2. Detroit: 520,161
3. Jacksonville: 249,532——-3. Jacksonville: 274,290
4. Milwaukee: 230,473——–4. Columbus: 259,803
5. Indianapolis: 226,314——-5. Indianapolis: 251,958
6. Columbus: 216,486———6. Milwaukee: 222,619
7. Cleveland: 208,528———7. Cleveland: 178,909
8. St. Louis: 157,382———–8. Kansas City: 137,867
9. Kansas City: 138,461——-9. St. Louis: 137,087
10. Cincinnati: 131,909——-10. Cincinnati: 122,261
11. Virginia Beach: 79,583—11. Virginia Beach: 84,333
12. Toledo: 75,033————12. Minneapolis: 81,930
13. Pittsburgh: 71,539——-13. Austin: 78,354
14. Minneapolis: 63,749—–14. Toledo: 74,630
15. Sacramento: 61,976—–15. Pittsburgh: 68,637
16. Austin: 61,833————16. Las Vegas: 68,488
17. Las Vegas: 60,187——–17. Sacramento: 64,824
18. Omaha: 55,086———–18. Omaha: 56,503
19. Wichita: 42,662———-19. St. Paul: 44,572
20. St. Paul: 41,923———-20. Wichita: 42,874
21. Grand Rapids: 41,848—21. Fort Wayne: 40,640
22. Fort Wayne: 39,016—–22. Portland: 39,882
23. Portland: 37,355——–23. Grand Rapids: 35,264
24. San Jose: 29,831——–24. San Jose: 29,432
25. Des Moines: 19,962—-25. Providence: 26,594
26. Providence: 19,265—–26. Des Moines: 24,018
27. Madison: 17,560——–27. Madison: 20,276
28. Lincoln: 9,023———-28. Lincoln: 12,203

Total Non-Hispanic Black Change 2010-2018
1. Columbus: +43,317
2. Indianapolis: +25,644
3. Jacksonville: +24,758
4. Minneapolis: +18,181
5. Austin: +16,521
6. Las Vegas: +8,301
7. Providence: +7,329
8. Virginia Beach: +4,750
9. Des Moines: +4,056
10. Lincoln: +3,180
11. Sacramento: +2,848
12. Madison: +2,716
13. St. Paul: +2,649
14. Portland: +2,527
15. Fort Wayne: +1,624
16. Omaha: +1,417
17. Wichita: +212
18. San Jose: -399
19. Toledo: -403
20. Kansas City: -594
21. Pittsburgh: -2,902
22. Grand Rapids: -6,584
23. Milwaukee: -7,854
24. Cincinnati: -9,648
25. St. Louis: -20,295
26. Cleveland: -29,619
27. Detroit: -67,546
28. Chicago: -111,028

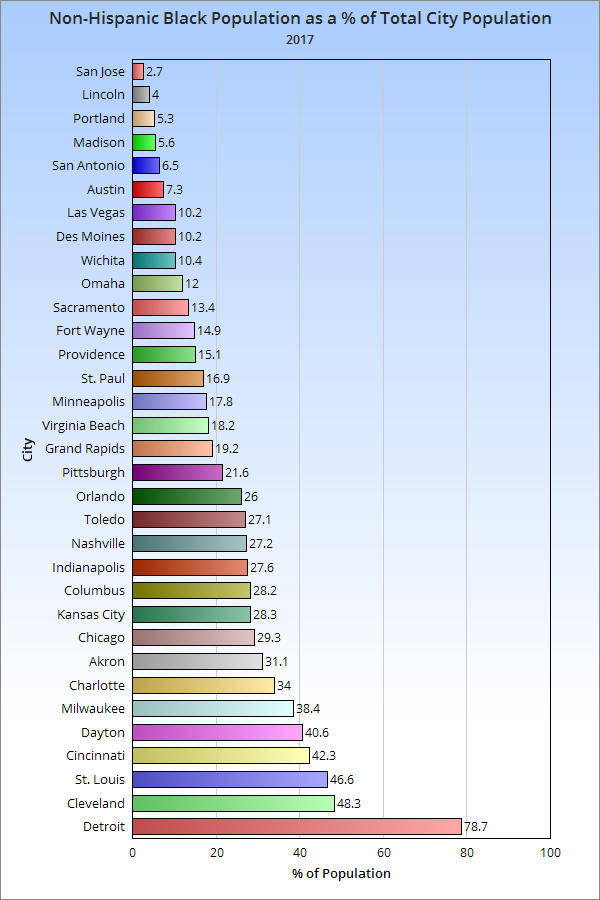
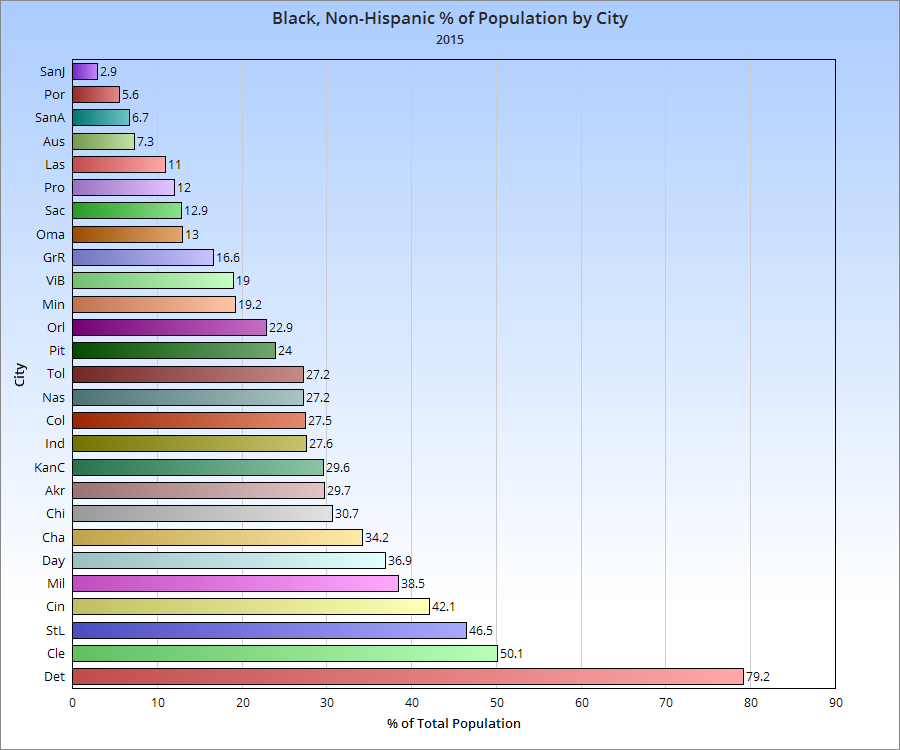
Non-Hispanic Black % of Total Population by City in 2018
1. Detroit: 77.3%
2. Cleveland: 46.6%
3. St. Louis: 45.3%
4. Cincinnati: 40.4%
5. Milwaukee: 37.7%
6. Jacksonville: 30.4%
7. Indianapolis: 29.2%
8. Columbus: 29.0%
9. Chicago: 29.0%
10. Kansas City: 28.0%
11. Toledo: 27.1%
12. Pittsburgh: 22.8%
13. Minneapolis: 19.3%
14. Virginia Beach: 18.7%
15. Grand Rapids: 17.6%
16. Fort Wayne: 15.4%
17. Providence: 14.8%
18. St. Paul: 14.5%
19. Sacramento: 12.8%
20. Omaha: 12.1%
21. Des Moines: 11.1%
22. Wichita: 11.0%
23. Las Vegas: 10.6%
24. Austin: 8.1%
25. Madison: 7.9%
26. Portland: 6.1%
27. Lincoln: 4.3%
28. San Jose: 2.9%

Total Non-Hispanic Asian Population by City by Year
2010——————————-2018
1. San Jose: 303,227————1. San Jose: 367,280
2. Chicago: 148,280————2. Chicago: 179,841
3. Sacramento: 84,556——–3. Sacramento: 97,192
4. Austin: 46,575—————4. Austin: 73,185
5.  Portland: 43,185————5. St. Paul: 59,395
6. St. Paul: 41,989————–6. Portland: 57,526
7. Las Vegas: 37,406———-7. Columbus: 54,902
8. Columbus: 35,468———-8. Las Vegas: 46,422
9. Jacksonville: 33,663——–9. Jacksonville: 42,639
10. Virginia Beach: 27,303—10. Virginia Beach: 31,875
11. Milwaukee: 22,670——–11. Indianapolis: 31,777
12. Minneapolis: 21,426——12. Minneapolis: 26,768
13.  Wichita: 19,420———-13. Milwaukee: 25,17
14. Indianapolis: 17,137——14. Madison: 23,594
15. Madison: 16,671———-15. Wichita: 17,410
16. Pittsburgh: 12,036——-16. Omaha: 17,185
17. Providence: 11,497——-17. Pittsburgh: 16,724
18. Lincoln: 10,452———–18. Des Moines: 15,057
19. Kansas City: 10,263—–19. Fort Wayne: 13,661
20. Des Moines: 8,867——20. Providence: 12,556
21. St. Louis: 8,717———–21. Lincoln: 12,494
22. Omaha: 8,397———–22. Kansas City: 12,130
23. Fort Wayne: 6,945—–23. St. Louis: 10,662
24. Detroit: 6,549———-24. Detroit: 10,597
25. Cincinnati: 5,938——25. Cleveland: 10,595
26. Cleveland: 5,392——26. Cincinnati: 6,999
27. Grand Rapids: 3,695–27. Grand Rapids: 4,431
28. Toledo: 3,125———-28. Toledo: 2,802

Total Non-Hispanic Asian Change 2010-2018
1. San Jose: +64,053
2. Chicago: +31,561
3. Austin: +26,610
4. Columbus: +19,434
5. St. Paul: +17,406
6. Indianapolis: +14,640
7. Portland: +14,341
8. Sacramento: +12,636
9. Las Vegas: +9,016
10. Jacksonville: +8,976
11. Omaha: +8,788
12. Madison: +6,923
13. Fort Wayne: +6,716
14. Des Moines: +6,190
15. Minneapolis: +5,342
16. Cleveland: +5,203
17. Pittsburgh: +4,688
18. Virginia Beach: +4,572
19. Detroit: +4,048
20. Milwaukee: +2,501
21. Lincoln: +2,042
22. St. Louis: +1,945
23. Kansas City: +1,867
24. Cincinnati: +1,061
25. Providence: +1,059
26. Grand Rapids: +736
27. Toledo: -323
28. Wichita: -2,010

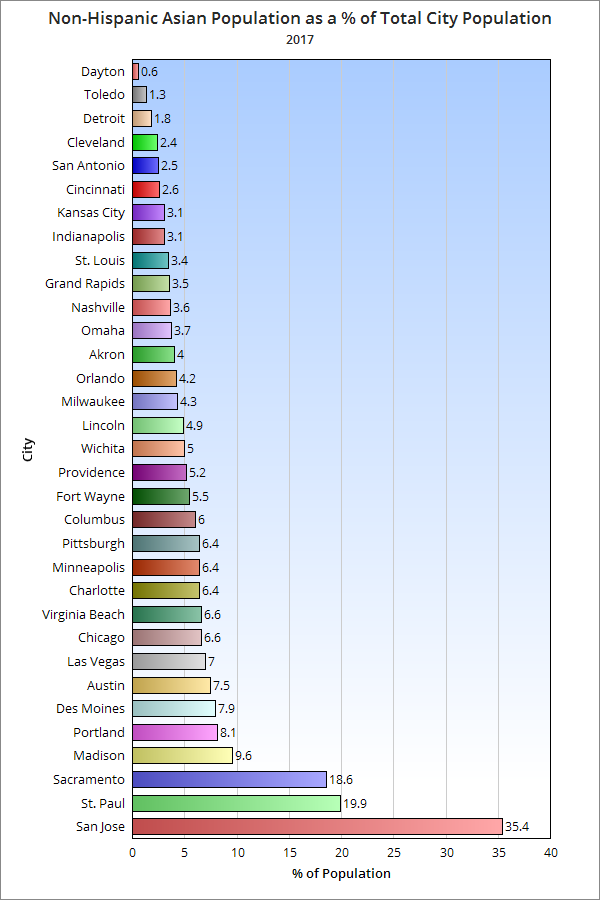
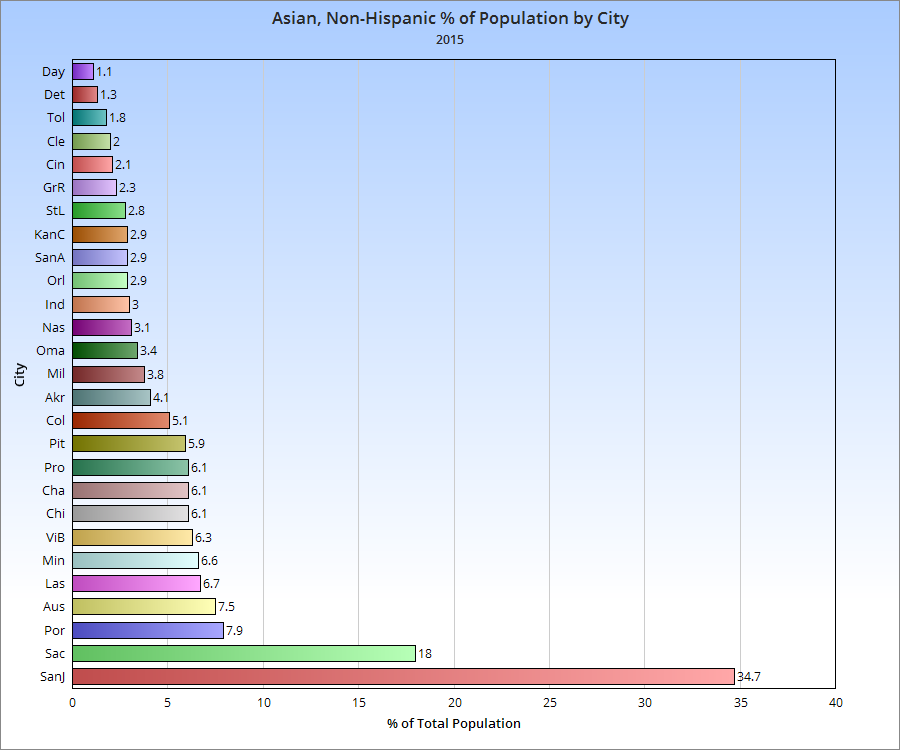
Non-Hispanic Asian % of Total Population by City in 2018
1. San Jose: 35.7%
2. St. Paul: 19.3%
3. Sacramento: 19.1%
4. Madison: 9.1%
5. Portland: 8.8%
6. Austin: 7.6%
7. Las Vegas: 7.2%
8. Virginia Beach: 7.1%
9. Providence: 7.0%
10. Des Moines: 6.9%
11. Chicago: 6.7%
12. Minneapolis: 6.3%
13. Columbus: 6.1%
14. Pittsburgh: 5.6%
15. Fort Wayne: 5.2%
16. Jacksonville: 4.7%
17. Wichita: 4.5%
18. Lincoln: 4.4%
19. Milwaukee: 4.3%
20. Indianapolis: 3.7%
21. Omaha: 3.7%
22. St. Louis: 3.5%
23. Cleveland: 2.8%
24. Kansas City: 2.5%
25. Cincinnati: 2.3%
26. Grand Rapids: 2.2%
27. Detroit: 1.6%
28. Toledo: 1.0%


Total Hispanic Population by City By Year
2010———————————2018
1. Chicago: 763,968————-1. Chicago: 776,661
2. San Jose: 318,389————2. San Jose: 333,819
3. Austin: 288,130—————3. Austin: 314,949
4. Las Vegas: 181,923———–4. Las Vegas: 222,860
5. Sacramento: 124,461———5. Sacramento: 148,343
6. Milwaukee: 104,619———-6. Milwaukee: 119,876
7. Indianapolis: 78,467———-7. Jacksonville: 94,158
8.  Providence: 76,645———-8. Indianapolis: 88,022
9. Jacksonville: 64,081———-9. Providence: 75,177
10. Wichita: 59,823————-10. Wichita: 70,564
11. Portland: 58,986————11. Omaha: 68,747
12. Omaha: 53,661————–12. Portland: 60,760
13. Kansas City: 49,800——–13. Columbus: 53,935
14. Detroit : 45,580————-14. Detroit: 52,718
15. Columbus: 43,276———-15. Kansas City: 52,638
16. Cleveland: 36,067———-16. Cleveland: 47,144
17. Minneapolis: 34,504——-17. Minneapolis: 40,912
18. Grand Rapids: 30,659—–18. Virginia Beach: 37,365
19. Virginia Beach: 29,206—-19. Grand Rapids: 36,469
20. St. Paul: 28,725————20. Des Moines: 31,706
21. Des Moines: 23,832——-21. St. Paul: 26,081
22. Toledo: 21,346————-22. Toledo: 24,625
23. Fort Wayne: 19,576——-23. Fort Wayne: 24,623
24. Lincoln: 16,007————24. Lincoln: 22,339
25. Madison: 14,062———-25. Madison: 18,867
26. St. Louis: 11,207———–26. St. Louis: 12,509
27. Cincinnati: 8,710———-27. Cincinnati: 10,773
28. Pittsburgh: 7,282———28. Pittsburgh: 10,180

Total Hispanic Population Change 2010-2018
1. Las Vegas: +40,937
2. Jacksonville: +30,077
3. Austin: +26,819
4. Sacramento: +23,882
5. San Jose: +15,430
6. Milwaukee: +15,257
7. Omaha: +15,086
8. Chicago: +12,693
9. Cleveland: +11,077
10. Wichita: +10,741
11. Columbus: +10,659
12. Indianapolis: +9,555
13. Virginia Beach: +8,159
14. Des Moines: +7,874
15. Detroit: +7,138
16. Minneapolis: +6,408
17. Lincoln: +6,332
18. Grand Rapids: +5,810
19. Fort Wayne: +5,047
20. Madison: +4,805
21. Toledo: +3,279
22. Pittsburgh: +2,898
23. Kansas City: +2,838
24. Cincinnati: +2,063
25. Portland: +1,774
26. St. Louis: +1,302
27. Providence: -1,468
28. St. Paul: -2,644

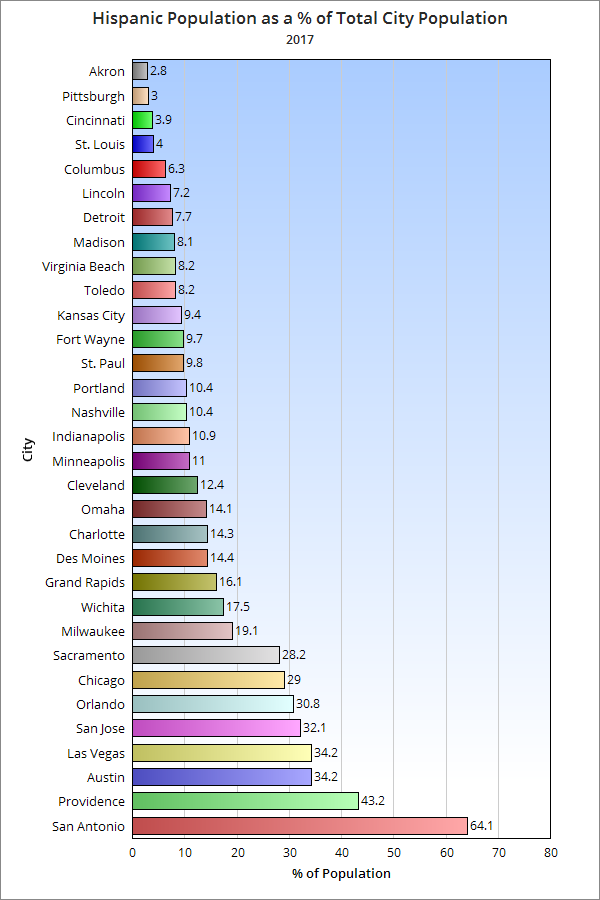
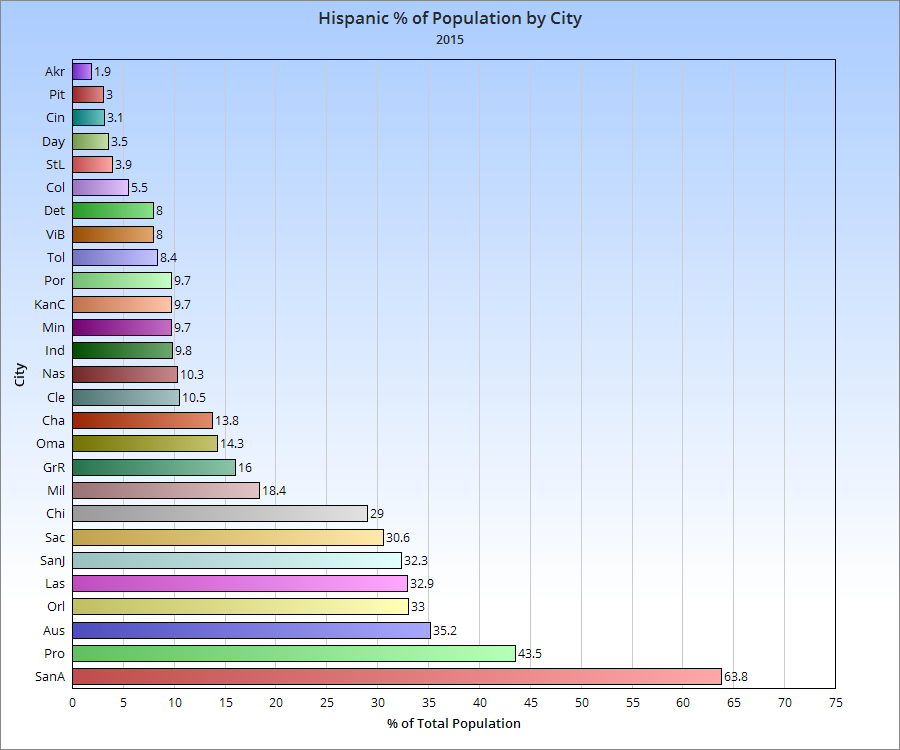
Hispanic % of Total Population by City in 2018
1. Providence: 41.9%
2. Las Vegas: 34.6%
3. Austin: 32.7%
4. San Jose: 32.4%
5. Sacramento: 29.2%
6. Chicago: 28.7%
7. Milwaukee: 20.3%
8. Grand Rapids: 18.2%
9. Wichita: 18.1%
10. Omaha: 14.7%
11. Des Moines: 14.6%
12. Cleveland: 12.3%
13. Kansas City: 10.7%
14. Jacksonville: 10.4%
15. Indianapolis: 10.2%
16. Minneapolis: 9.6%
17. Portland: 9.3%
18. Fort Wayne: 9.3%
19. Toledo: 9.0%
20. St. Paul: 8.5%
21. Virginia Beach: 8.3%
22. Detroit: 7.8%
23. Lincoln: 7.8%
24. Madison: 7.3%
25. Columbus: 6.0%
26. St. Louis: 4.1%
27. Cincinnati: 3.6%
28. Pittsburgh: 3.4%

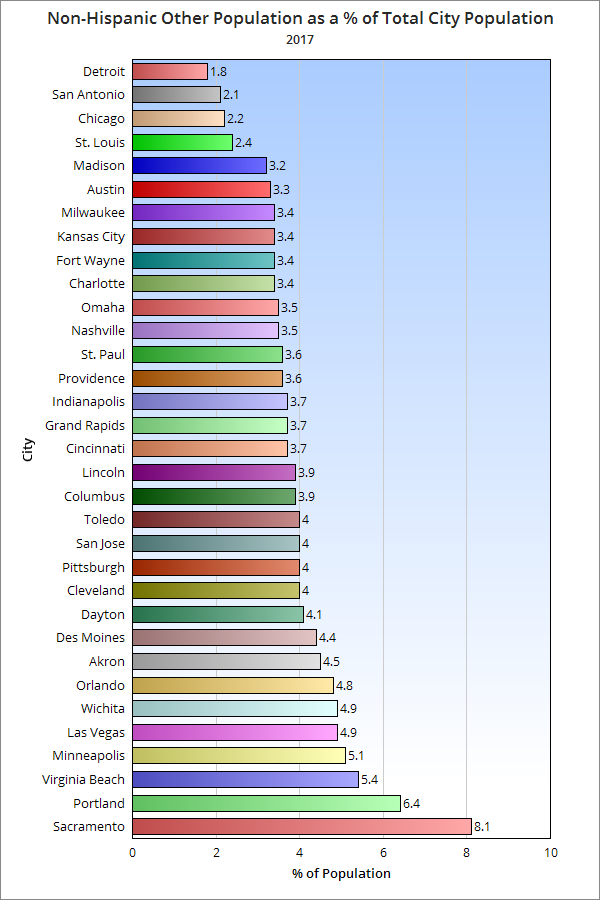
Total Non-Hispanic Other Population by City by Year
2010——————————–2018

1. Chicago: 37,379————–1. Chicago: 65,240
2. San Jose: 32,439————-2. San Jose: 46,017
3. Sacramento: 30,900——–3. Columbus: 40,806
4. Portland: 28,027————-4. Sacramento: 39,825
5. Las Vegas: 24,521———–5. Portland: 37,363
6. Columbus: 23,738———–6. Jacksonville: 37,322
7. Jacksonville: 23,114———-7. Las Vegas: 34,024
8. Minneapolis: 20,753———8. Austin: 27,135
9. Virginia Beach: 20,268——9. Indianapolis: 26,908
10. Indianapolis: 20,086——10. Minneapolis: 23,458
11. Detroit: 16,776————-11. Virginia Beach: 21,245
12. Milwaukee: 16,311——– 12. Kansas City: 19,320
13. Wichita: 16,091————13. Milwaukee: 19,286
14. Omaha: 15,519————14. Omaha: 17,987
15. Austin: 14,915————-15. St. Paul: 17,871
16. Kansas City: 14,668——16. Detroit: 16,223
17. St. Paul: 13,098———–17. Cleveland: 16,123
18.  Pittsburgh: 11,280——-18. Wichita: 15,740
19. Toledo: 10,134————19. Toledo: 14,949
20. Fort Wayne: 8,513——-20. Lincoln: 13,148
21. Cleveland: 8,276———21. Fort Wayne: 12,158
22. St. Louis: 7,704———-22. Cincinnati: 11,889
23. Lincoln: 7,483———–23. Pittsburgh: 10,029
24. Grand Rapids: 7,376—24. Madison: 9,263
25. Cincinnati: 7,230——-25. Des Moines: 8,944
26. Madison: 7,177———26. St. Louis: 8,892
27. Providence: 6,471——27: Grand Rapids: 8,347
28. Des Moines: 5,598—–28. Providence: 6,152

Total Non-Hispanic Other Population Change 2010-2018
1. Chicago: +27,861
2. Columbus; +17,068
3. Jacksonville: +14,208
4. San Jose: +13,578
5. Austin: +12,220
6. Las Vegas: +9,503
7. Portland: +9,336
8. Sacramento: +8,925
9. Cleveland: +7.847
10. Indianapolis: +6,822
11. Lincoln: +5,665
12. Toledo: +4,815
13. St. Paul: +4,773
14. Cincinnati: +4,659
15. Kansas City: +4,652
16. Fort Wayne: +3,645
17. Des Moines: +3,346
18. Milwaukee: +2,975
19. Minneapolis: +2,705
20. Omaha: +2,468
21. Madison: +2,086
22. St. Louis: 1,188
23. Virginia Beach: +977
24. Grand Rapids: +971
25. Providence: -319
26. Wichita: -351
27. Detroit: -553
28. Pittsburgh: -1251

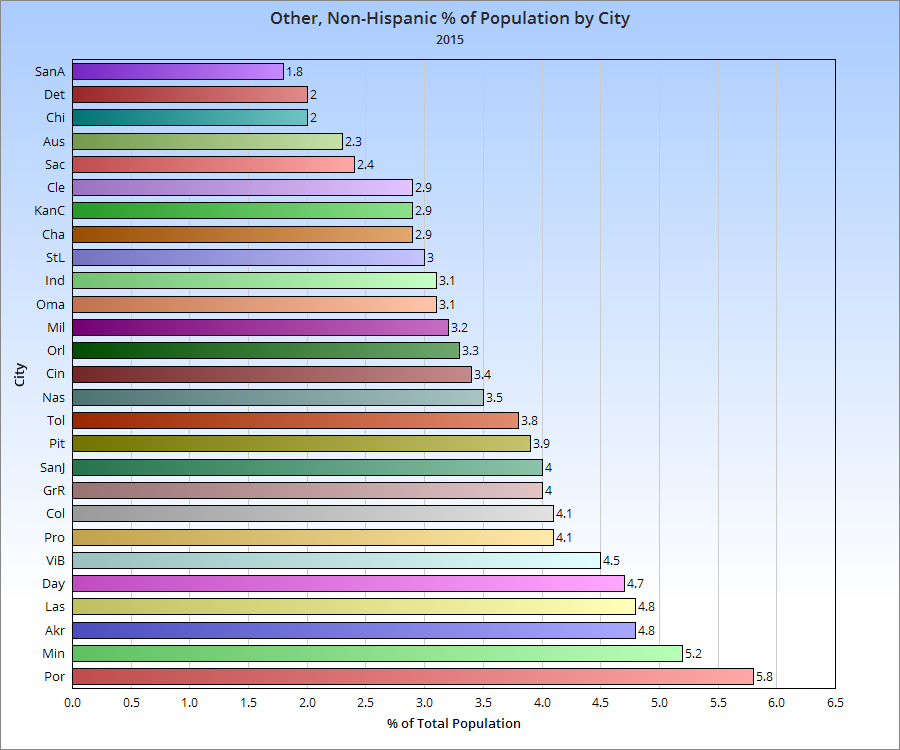
Non-Hispanic Other % of Total Population by City in 2018
1. Sacramento: 7.8%
2. St. Paul: 5.8%
3. Portland: 5.7%
4. Minneapolis: 5.5%
5. Toledo: 5.4%
6. Las Vegas: 5.3%
7. Virginia Beach: 4.7%
8. Fort Wayne: 4.6%
9. Lincoln: 4.6%
10. Columbus: 4.6%
11. San Jose: 4.5%
12. Cleveland: 4.2%
13. Grand Rapids: 4.2%
14. Jacksonville: 4.1%
15. Des Moines: 4.1%
16. Wichita: 4.0%
17. Cincinnati: 3.9%
18. Kansas City: 3.9%
19. Omaha: 3.8%
20. Madison: 3.6%
21. Providence: 3.4%
22. Pittsburgh: 3.3%
23. Milwaukee: 3.3%
24. Indianapolis: 3.1%
25. St. Louis: 2.9%
26. Austin: 2.8%
27. Chicago: 2.4%
28. Detroit: 2.4%

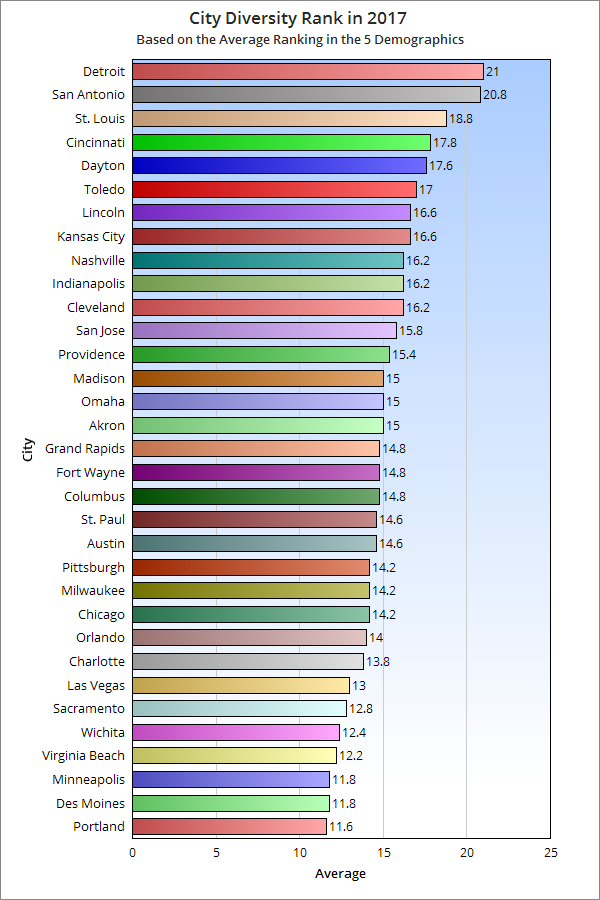
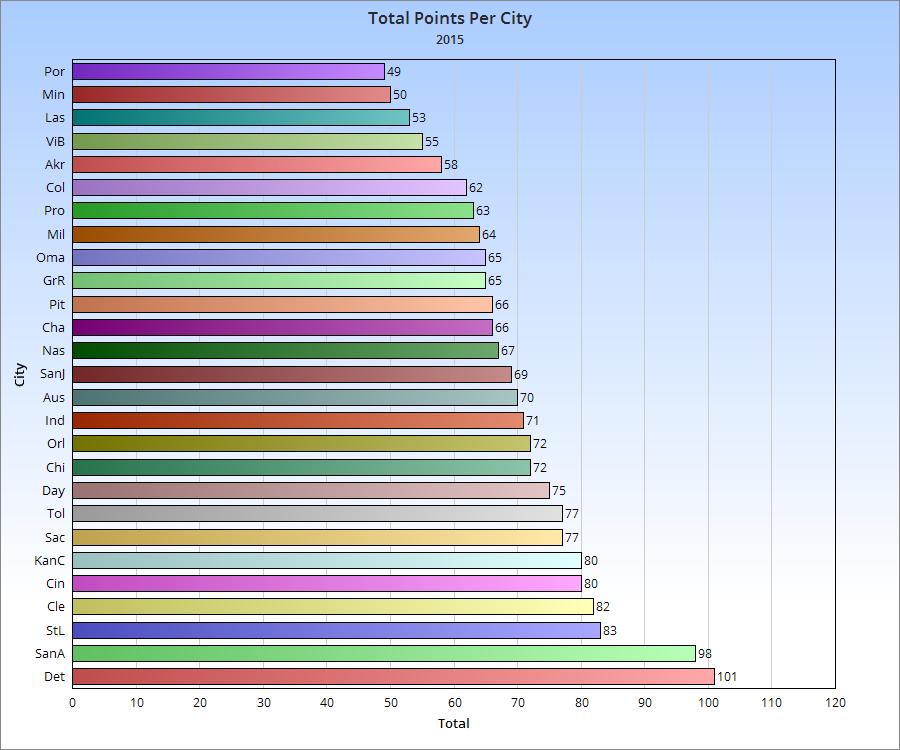
Now that we can see all the numbers, what is the 2018 ranking of most to least racially diverse? To find out, I assigned points by the ranking of % of population, so #1 of a particular ranking would get 1 point, the next 2 points and so on. The cities with the fewest points are the most diverse.
Here are the rankings for both 2010 and 2018.

Most to Least Diverse by Year and Total Points
2010——————————–2018

1. Portland: 50—————–1. Portland: 54
2. Sacramento: 52————2. Sacramento: 54
3. St. Paul: 53—————–3. Minneapolis: 55
4. Minneapolis: 54———–4. St. Paul: 58
5. Virginia Beach: 55——–5. Las Vegas: 59
6. Wichita: 57—————-6. Virginia Beach: 59
7. Las Vegas: 60————-7. Fort Wayne: 62
8. Providence: 61————8. Des Moines: 64
9. Omaha: 66—————-9. Jacksonville: 67
10. Grand Rapids: 69——-10. Columbus: 70
11. Des Moines: 71———-11. San Jose: 71
12. Madison: 72————-12. Cleveland: 72
13. San Jose: 72————-13. Wichita: 72
14. Fort Wayne: 73———14. Grand Rapids: 73
15. Kansas City: 73———15. Providence: 73
16. Milwaukee: 73———-16. Omaha: 74
17. Pittsburgh: 74———-17. Madison: 75
18. Jacksonville: 75——–18. Toledo: 75
19. Chicago: 76————-19. Milwaukee: 76
20. Columbus: 77———-20. Chicago: 77
21. Austin: 80—————21. Austin: 78
22. Indianapolis: 81——–22. Kansas City: 78
23. Toledo: 81————–23. Lincoln: 78
24. Lincoln: 85————-24. Indianapolis: 81
25. St. Louis: 94———–25. Pittsburgh: 82
26. Cleveland: 95———-26. Cincinnati: 91
27. Cincinnati: 97———-27. St. Louis: 96
28. Detroit: 104————28. Detroit: 106

Columbus had one of the fastest improvements of its diversity, moving up 10 spots from 20th to 10th.

To see how Columbus compares to cities in other ways, check out:
Columbus vs. Other Cities
And to see more national population data, visit:
United States Census


Columbus City Diversity and Peer Comparison


In the 2nd post related to the recently-released Census demographic data, I’ll look at Columbus city diversity and peer comparison for how it’s been changing since 2005.

Rank by City of Total White, non-Hispanic Population by Year
2005————————————–2010————————————-2017
1. Chicago, IL: 819,215————1. Chicago: 853,910————1. Chicago: 879,334
2. Indianapolis, IN: 491,044—2. Indianapolis: 482,195—–2. Columbus: 490,149
3. Columbus: 442,958———-3. Columbus: 470,971—-3. Indianapolis: 468,665
4. Portland, OR: 382,033———-4. Portland: 417,876————4. Austin: 453,801
5. San Antonio, TX: 356,420—–5. Austin: 384,065————5. Portland: 452,132
6. Austin, TX: 347,013——-6. San Antonio: 351,420—6. San Antonio: 375,463
7. Nashville, TN: 314,518——–7. Nashville: 339,030——–7. Nashville: 368,195
8. Charlotte, NC: 302,789——-8. Charlotte: 331,357——8. Charlotte: 360,270
9. Virginia Beach, VA: 290,891–9. Virginia Beach: 282,812——9. Omaha: 311,349
10. San Jose, CA: 281,822—–10. Las Vegas: 280,604———–10. Las Vegas: 280,201
11. Las Vegas, NV: 281,679—-11. Omaha: 277,606———–11. Virginia Beach: 277,338
12. Omaha, NE: 267,685——–12. San Jose: 265,311————12. Kansas City: 272,548
13. Kansas City, MO: 249,123—13. Kansas City: 247,473——13. San Jose: 267,315
14. Wichita, KS: 245,527———-14. Wichita: 245,146————14. Minneapolis: 252,304
15. Milwaukee, WI: 219,891——15. Minneapolis: 242,848——15. Wichita: 243,143
16. Minneapolis, MN: 216,975—16. Milwaukee: 221,514——–16. Lincoln: 226,297
17. Lincoln, NE: 197,287———-17. Lincoln: 216,076————-17. Milwaukee: 207,043
18. Toledo: 183,746—————-18. Pittsburgh: 203,622———18. Pittsburgh: 196,687
19. Pittsburgh, PA: 180,725——19. Fort Wayne: 179,646——-19. Madison: 187,566
20. Madison, WI: 161,631——–20. Madison: 178,307————20. Fort Wayne: 166,912
21. St. Paul, MN: 161,329——–21. Toledo: 177,341————–21. Toledo: 164,104
22. Sacramento, CA: 160,599—22. Sacramento: 165,610——22. Sacramento: 159,291
23. Fort Wayne, IN: 157,672—–23. St. Paul: 159,704———–23. St. Paul: 152,558
24. Des Moines, IA: 149,786—–24. Des Moines: 145,937——24. Cincinnati: 143,028
25. Cleveland: 147,359———–25. Cincinnati: 143,120———25. Des Moines: 137,235
26. St. Louis, MO: 143,590——26. Cleveland: 137,977———26. St. Louis: 134,471
27. Cincinnati: 138,486———–27. St. Louis: 134,146———–27. Cleveland: 126,714
28. Akron: 128,976—————-28. Akron: 120,800————–28. Grand Rapids: 114,349
29. Grand Rapids, MI: 113,791—29. Grand Rapids: 104,636—29. Akron: 113,951
30. Orlando, FL: 92,326———–30. Orlando: 96,867————-30. Orlando: 95,876
31. Detroit, MI: 77,163————-31. Dayton: 72,663————–31. Dayton: 71,094
32. Dayton: 67,581—————–32. Providence: 64,284——–32. Detroit: 70,931
33. Providence, RI: 64,223——-33. Detroit: 55,298————–33. Providence: 59,321

Columbus moved from 3rd to 2nd over the period.

Rank by City of Total Black, non-Hispanic Population by Year
2005—————————————–2010———————————2017

1. Chicago: 938,097—————–1. Chicago: 895,294———–1. Chicago: 797,253
2. Detroit: 683,999——————–2. Detroit: 587,707————-2. Detroit: 529,593
3. Milwaukee: 222,040————–3. Charlotte: 251,274———-3. Charlotte: 292,104
4. Cleveland: 221,797—————4. Milwaukee: 230,473——–4. Columbus: 248,476
5. Charlotte: 205,216—————-5. Indianapolis: 226,314——-5. Indianapolis: 236,606
6. Indianapolis: 193,948————6. Columbus: 216,486———6. Milwaukee: 228,720
7. Columbus: 179,197—————7. Cleveland: 208,528———7. Cleveland: 186,073
8. St. Louis: 168,768—————-8. Nashville: 171,104———–8. Nashville: 180,830
9. Nashville: 148,051—————-9. St. Louis: 157,382———–9. St. Louis: 143,761
10. Kansas City: 131,694———-10. Kansas City: 138,461—–10. Kansas City: 138,346
11. Cincinnati: 131,010————-11. Cincinnati: 131,909——–11. Cincinnati: 127,589
12. Pittsburgh: 81,758————–12. Virginia Beach: 79,583—-12. San Antonio: 97,925
13. Virginia Beach: 80,004——–13. San Antonio: 79,307——13. Virginia Beach: 82,181
14. Orlando: 73,736—————–14. Toledo: 75,033————-14. Minneapolis: 75,006
15. Toledo: 72,190——————-15. Pittsburgh: 71,539——–15. Toledo: 74,906
16. Sacramento: 71,452————16. Orlando: 70,988————16. Orlando: 72,796
17. San Antonio: 70,723————17. Minneapolis: 63,749——17. Austin: 69,860
18. Dayton: 60,196——————-18. Sacramento: 61,976——18. Sacramento: 67,305
19. Akron: 59,810——————–19. Austin: 61,833————–19. Las Vegas: 65,663
20. Las Vegas: 59,780————–20. Dayton: 61,402————-20. Pittsburgh: 65,268
21. Austin: 59,583——————-21. Akron: 60,653—————-21. Akron: 61,461
22. Minneapolis: 57,499————22. Las Vegas: 60,187———22. Dayton: 57,043
23. Omaha: 50,333——————23. Omaha: 55,086————-23. Omaha: 56,098
24. Grand Rapids: 40,408———24. Wichita: 42,662————-24. St. Paul: 51,737
25. Wichita: 39,165—————–25. Grand Rapids: 41,848—–25. Wichita: 40,756
26. Fort Wayne: 35,221———–26. St. Paul: 41,923————-26. Grand Rapids: 38,130
27. St. Paul: 34,903—————-27. Fort Wayne: 39,016——–27. Fort Wayne: 37,941
28. Portland: 30,828—————28. Portland: 37,355————28. Portland: 34,624
29. San Jose: 27,446————–29. San Jose: 29,831———-29. San Jose: 28,126
30. Providence: 18,794———–30. Des Moines: 19,962——-30. Providence: 27,274
31. Des Moines: 16,709———-31. Providence: 19,265——–31. Des Moines: 22,170
32. Madison: 12,660————–32. Madison: 17,560————32. Madison: 14,185
33. Lincoln: 7,082——————33. Lincoln: 9,023—————33. Lincoln: 11,487

Columbus moved up from 7th to 4th in total Black, non-Hispanic during the period. Surprisingly, quite a few cities have actually been losing this demographic since 2010 at least.

Rank by City of Total Asian, non-Hispanic Population by Year
2005————————————-2010——————————————2017

1. San Jose: 269,186————–1. San Jose: 303,227—————–1. San Jose: 366,134
2. Chicago: 127,686—————-2. Chicago: 148,280——————2. Chicago: 179,176
3. Sacramento: 80,307————3. Sacramento: 84,556————-3. Sacramento: 93,476
4. Portland: 36,278—————–4. Austin: 46,575———————-4. Austin: 71,539
5. Austin: 35,239——————–5. Portland: 43,185——————-5. St. Paul: 61,082
6. St. Paul: 35,184——————6. St. Paul: 41,989——————-6. Charlotte: 55,142
7. Columbus: 27,125—————7. Las Vegas: 37,406—————7. Columbus: 53,027
8. Las Vegas: 25,077————–8. Charlotte: 37,181—————–8. Portland: 52,219
9. Charlotte: 23,356—————-9. Columbus: 35,468—————-9. Las Vegas: 44,735
10. Virginia Beach: 22,501——10. San Antonio: 29,200———–10. San Antonio: 38,119
11. San Antonio: 20,492———11. Virginia Beach: 27,303—–11. Virginia Beach: 29,735
12. Minneapolis: 20,189———12. Milwaukee: 22,670————–12. Minneapolis: 26,833
13. Milwaukee: 19,596———–13. Minneapolis: 21,426————13. Indianapolis: 26,548
14. Nashville: 16,943————-14. Wichita: 19,420——————14. Milwaukee: 25,624
15. Wichita: 15,417—————15. Indianapolis: 17,137————15. Madison: 24,455
16. Madison: 12,708————–16. Nashville: 17,045—————16. Nashville: 24,034
17. Indianapolis: 12,312———17. Madison: 16,671—————-17. Wichita: 19,548
18. Providence: 10,751———-18. Pittsburgh: 12,036————–18. Pittsburgh: 19,357
19. Pittsburgh: 10,727————19. Providence: 11,497————19. Omaha: 17,412
20. Kansas City: 10,674———20. Lincoln: 10,452——————20. Des Moines: 17,143
21. Detroit: 9,577——————21. Kansas City: 10,263———–21. Kansas City: 15,213
22. Des Moines: 8,796———–22. Des Moines: 8,867————-22. Fort Wayne: 14,039
23. Lincoln: 7,513—————–23. St. Louis: 8,717—————–23. Lincoln: 13,992
24. St. Louis: 7,046—————24. Omaha: 8,397——————-24. Orlando: 11,852
25. Omaha: 6,971—————–25. Orlando: 7,870——————25. Detroit: 11,790
26. Cincinnati: 6,874————-26. Fort Wayne: 6,945————–26. St. Louis: 10,404
27. Cleveland: 6,289————27. Detroit: 6,549———————27. Providence: 9,361
28. Orlando: 5,528—————28. Cincinnati: 5,938—————-28. Cleveland: 9,217
29. Fort Wayne: 4,241———-29. Cleveland: 5,392—————-29. Akron: 8,007
30. Toledo: 4,150—————-30. Akron: 4,567———————30. Cincinnati: 7,906
31. Akron: 3,497—————–31. Grand Rapids: 3,695———–31. Grand Rapids: 7,056
32. Grand Rapids: 2,847——32. Toledo: 3,125——————–32. Toledo: 3,679
33. Dayton: 1,827—————33. Dayton: 1,231——————–33. Dayton: 848

Columbus maintained its rank since 2005.

Rank by City of Total Hispanic Population by Year
2005——————————————–2010————————————2017

1. Chicago: 778,234—————1. San Antonio: 853,654———-1. San Antonio: 969,065
2. San Antonio: 735,458———–2. Chicago: 763,968—————2. Chicago: 787,978
3. San Jose: 279,420————–3. San Jose: 318,389————–3. San Jose: 332,603
4. Austin: 223,361——————4. Austin: 288,130——————4. Austin: 324,973
5. Las Vegas: 153,813————5. Las Vegas: 181,923————-5. Las Vegas: 219,220
6. Sacramento: 111,559———6. Sacramento: 124,461———–6. Sacramento: 141,752
7. Milwaukee: 80,945————-7. Milwaukee: 104,619————-7. Milwaukee: 133,812
8. Providence: 60,008————-8. Charlotte: 96,246—————-8. Charlotte: 122,904
9. Charlotte: 58,466—————9. Indianapolis: 78,467————-9. Indianapolis: 93,042
10. Wichita: 49,928—————10. Providence: 76,645————10. Orlando: 86,305
11. Indianapolis: 47,764———11. Nashville: 61,212—————11. Providence: 77,893
12. Detroit: 46,993—————-12. Wichita: 59,823——————12. Nashville: 69,574
13. Orlando: 43,978————–13. Portland: 58,986—————–13. Wichita: 68,389
14. Portland: 43,324————–14. Orlando: 56,061—————–14. Portland: 67,551
15. Omaha: 39,674—————15. Omaha: 53,661——————15. Omaha: 66,056
16. Nashville: 37,463————-16. Kansas City: 49,800————16. Columbus: 55,782
17. Minneapolis: 37,017———17. Detroit: 45,580——————-17. Detroit: 48,328
18. Kansas City: 35,995———18. Columbus: 43,276————–18. Cleveland: 47,962
19. Grand Rapids: 32,368——19. Cleveland: 36,067————–19. Minneapolis: 46,375
20. Cleveland: 32,085———–20. Minneapolis: 34,504———–20. Kansas City: 45,975
21. Columbus: 24,607———–21. Grand Rapids: 30,659——21. Virginia Beach: 36,723
22. St. Paul: 22,402————–22. Virginia Beach: 29,206—–22. Grand Rapids: 32,016
23. Virginia Beach: 20,803—–23. St. Paul: 28,725————–23. Des Moines: 31,333
24. Des Moines: 18,952——–24. Des Moines: 23,832———-24. St. Paul: 30,007
25. Toledo: 18,404————–25. Toledo: 21,346——————25. Fort Wayne: 24,724
26. Fort Wayne: 16,438——-26. Fort Wayne: 19,576————26. Toledo: 22,796
27. Madison: 11,997———–27. Lincoln: 16,007——————27. Lincoln: 21,921
28. Lincoln: 9,672—————28. Madison: 14,062—————28. Madison: 20,741
29. St. Louis: 8,268————-29. St. Louis: 11,207————–29. St. Louis: 12,447
30. Pittsburgh: 5,018———-30. Cincinnati: 8,710—————30. Cincinnati: 11,787
31. Cincinnati: 3,855———–31. Pittsburgh: 7,282————–31. Pittsburgh: 9,212
32. Akron: 3,485—————-32. Akron: 3,990——————–32. Dayton: 5,765
33. Dayton: 1,693————–33. Dayton: 3,180——————-33. Akron: 5,536

Columbus moved up from 21st to 16th in the total Hispanic population.

Rank by City of Total Other, non-Hispanic Population by Year
2005——————————————-2010—————————————–2017

1. Chicago: 38,694—————1. Chicago: 37,379——————–1. Chicago: 58,721
2. San Jose: 29,456————2. San Jose: 32,439——————–2. Portland: 41,595
3. Sacramento: 21,370———-3. Sacramento: 30,900—————3. San Jose: 41,175
4. Portland: 21,164————–4. Portland: 28,027———————4. Sacramento: 40,066
5. Indianapolis: 20,242———-5. Las Vegas: 24,521—————–5. Columbus: 34,467
6. Columbus: 20,096————-6. Columbus: 23,738—————–6. Indianapolis: 32,525
7. San Antonio: 19,130———-7. San Antonio: 20,778————–7. Las Vegas: 31,889
8. Minneapolis: 18,580———-8. Minneapolis: 20,753————–8. San Antonio: 31,341
9. Detroit: 18,324—————–9. Virginia Beach: 20,268———-9. Austin: 30,541
10. Las Vegas: 18,304———-10. Indianapolis: 20,086———-10. Charlotte: 28,632
11. Virginia Beach: 16,685—-11. Charlotte: 18,360————–11. Virginia Beach: 24,458
12. Milwaukee: 14,476———-12. Detroit: 16,776—————–12. Nashville: 23,334
13. Kansas City: 13,399——–13. Milwaukee: 16,311———–13. Minneapolis: 21,808
14. Austin: 13,261—————-14. Wichita: 16,091—————14. Milwaukee: 20,166
15. Charlotte: 11,771————-15. Omaha: 15,519————–15. Wichita: 18,763
16. Wichita: 11,545—————16. Austin: 14,915—————-16. Kansas City: 16,743
17. Omaha: 8,552—————–17. Kansas City: 14,668——–17. Omaha: 15,988
18. St. Paul: 7,741—————-18. Nashville: 14,227————18. Cleveland: 15,586
19. Toledo: 7,447—————–19. St. Paul: 13,098————–19. Orlando: 13,429
20. Cincinnati: 7,315————-20. Pittsburgh: 11,280———–20. Detroit: 12,461
21. Cleveland: 7,004————-21. Toledo: 10,134—————21. Pittsburgh: 11,890
22. Providence: 6,488———–22. Akron: 9,020——————22. St. Paul: 11,220
23. Pittsburgh: 6,138————23. Fort Wayne: 8,513———–23. Fort Wayne: 11,180
24. St. Louis: 6,058————–24. Cleveland: 8,276————-24. Lincoln: 11,037
25. Fort Wayne: 5,774———-25. St. Louis: 7,704————–25. Toledo: 11,009
26. Orlando: 5,731—————26. Lincoln: 7,483—————-26. Cincinnati: 10,995
27. Nashville: 5,687————-27. Grand Rapids: 7,376——–27. Des Moines: 9,627
28. Madison: 4,708————–28. Orlando: 7,251—————28. Akron: 8,894
29. Lincoln: 4,508—————-29. Cincinnati: 7,230————29. Madison: 8,292
30. Akron: 4,431—————–30. Madison: 7,177————–30. St. Louis: 7,543
31. Grand Rapids: 4,154——31. Providence: 6,471———–31. Grand Rapids: 7,260
32. Des Moines: 2,674———32. Des Moines: 5,598———-32. Providence: 6,539
33. Dayton: 1,382—————33. Dayton: 3,025—————-33. Dayton: 5,629

Finally, Columbus moved up from 6th to 5th in the total of Other, non-Hispanic population. Overall, Columbus ranks fairly well in totals vs. its peers, as one might expect given that it is one of the largest cities in the grouping. However, to truly find out how it compares with these other cities, you have to look at percentages, which tells how much of the city’s population is made up of each group.

Columbus ranks in the middle of the pack for its % of Non-Hispanic White population. Like in most cities, even while this demographic is growing in total numbers in Columbus, the % of total population continues to fall.

Columbus ranked in the top 3rd of peer cities for its % of Non-Hispanic Black population.

Columbus also ranked in the top 3rd for its Non-Hispanic Asian population.

Columbus ranks poorly with Hispanics in the group, ranking near the bottom.

Finally, Columbus ranks in the middle for its Non-Hispanic Other population.

So what’s the final ranking for where Columbus is with diversity compared to its peers in 2017? To find out, I assigned points based on ranked position in each 5 racial categories and took the average of the positions in each 5. The result is that the higher the average number, the lower the overall diversity.

So based on this, Columbus ranks in the top half of national and Midwest peers for diversity.

*Note: Normally, Youngstown would be included, but the data was not available.


Where Racial Groups are Growing Fastest in Franklin County


The US Census recently released updated estimates for 2016 for smaller-area designations like tracts and blocks. Looking at them, I wanted to see where racial groups were growing the fastest at that level.
The first map is based on the % change from 2010 to 2016.
where racial groups are growing
What’s interesting about this map is that it is such a hodgepodge. No single part of the county is dominated by growth in any specific racial group. However, a few things can be generally determined. For example, almost all of the tracts where the White population is growing the fastest are within I-270, and the majority of those within the eastern half of the Columbus in what have long been dominated by Black majority populations. These areas include parts of Linden, the Near South and Near East sides. That said, the White population was growing the fastest in just 30 census tracts by % change. This compared to 53 for the Black population, 83 for the Asian population and 107 for the Hispanic population.

The next map takes a slightly different approach, measuring the TOTAL change in population, rather than by %.

Again, a hodgepodge, but much less so than before. Instead of being the fastest-growing in just 30 tracts, the White population rockets up to 108 tracts. This shows that, while Asian and Hispanic populations have respectable % growth, this is largely based on comparatively small population bases. Still, non-White populations are clearly making inroads throughout Franklin County.

Franklin County Gentrification Trends 1990-2015


I saw this postthe other day about changing neighborhood demographics in certain cities, particularly when it comes to racial segregation and gentrification. Surprisingly, of all the maps and posts I’ve done on demographics, I hadn’t thought to do one that showed Franklin County gentrification trends. Well, now I have.

Franklin County gentrification trends
A bit of an explanation is needed for the color coding:
-For those categories marked “Steady”, the demographic listed has been the majority throughout the period, with little to no change of other demographics.
-For those mixed categories of one decline and one rise, it means that the majority demographic has declined at least 5 percentage points, while a secondary demographic has risen at least 5 percentage points.
-For the category of recent or steady integration, there are at least 2 demographics at 10% or more of the total population, as well as a 3rd demographic reaching at least 5% of the population.

A few things that stand out to me: The eastern half of the county is in much greater flux than the western half, and integration is respectable county-wide. These neighborhoods of demographic equilibrium are largely the result of increasing Hispanic and Asian populations, particularly on the Northeast and West Sides, as well as the Whitehall area. In the center core, almost all of the High Street corridor has remained Steady White, suggesting that other demographics have, so far, been unable to tap into the building boom along and adjacent to this corridor. One other thing I notice is that there are FAR more tracts with a growing black population than there are with a growing White population, suggesting that perhaps the idea of Whites moving into neighborhoods and displacing residents is not quite as big of an issue as some might believe.

Here are the integrated tracts by year, based the above criteria, and their racial breakdown.

Top 10 Tracts with the Highest White Population
1990

1. 7205: 99.6%
2. 98: 99.1%
3. 7207: 98.9%
4. 120, 9240: 98.8%
5. 7201, 7203, 80: 98.7%
6. 7922, 9440, 9752: 98.6%
7. 9751, 10601: 98.5%
8. 110, 8141, 8821, 9711, 9740: 98.4%
9. 9450, 9800: 98.3%
10. 6230, 7210: 98.2%
2015
1. 65: 98.7%
2. 6810: 97.4%
3. 6822, 9712: 97.0%
4. 98: 96.0%
5. 6721, 6950: 95.9%
6. 220: 95.8%
7. 9497: 95.6%
8. 66: 95.5%
9. 6330: 94.8%
10. 7394: 94.7%

Breakdown of # of Tracts by % of White Population
1990

95% or Higher: 80
90%-94.9%: 73
80%-89.9%: 64
70%-79.9%: 10
60%-69.9%: 11
50%-59.9%: 6
Total Majority White Tracts: 244
40%-49.9%: 7
30%-39.9%: 9
20%-29.9%: 5
10%-19.9%: 9
0.1%-9.9%: 9
0%: 0
Total Minority White Tracts: 39
2015
95% or Higher: 11
90%-94.9%: 35
80%-89.9%: 62
70%-79.9%: 52
60%-69.9%: 30
50%-59.9%: 19
Total Majority White Tracts: 209
40%-49.9%: 11
30%-39.9%: 17
20%-29.9%: 25
10%-19.9%: 15
0.1%-9.9%: 6
0%: 0
Total Minority White Tracts: 74

Top 10 Tracts with the Highest Black Population
1990

1. 730: 94.2%
2. 5420: 93.4%
3. 15, 28: 92.3%
4. 36: 91.8%
5. 5410: 91.4%
6. 7551: 91.1%
7. 7512: 90.9%
8. 23: 89.0%
9. 2520: 87.4%
10. 29: 87.2%
2015
1. 7512: 88.1%
2. 9337: 87.7%
3. 730: 84.9%
4. 7511: 83.6%
5. 23: 82.2%
6. 15: 81.9%
7. 55: 81.4%
8. 5420, 9332: 81.0%
9. 29: 80.9%
10. 8813: 79.1%

Breakdown of # of Tracts by % of Black Population
1990

95% or Higher: 0
90%-94.9%: 7
80%-89.9%: 10
70%-79.9%: 4
60%-69.9%: 8
50%-59.9%: 6
Total Majority Black Tracts: 35
40%-49.9%: 7
30%-39.9%: 10
20%-29.9%: 9
10%-19.9%: 32
0.1%-9.9%: 190
0%: 0
Total Minority Black Tracts: 248
2015
95% or Higher: 0
90%-94.9%: 0
80%-89.9%: 9
70%-79.9%: 8
60%-69.9%: 28
50%-59.9%: 9
Total Majority Black Tracts: 52
40%-49.9%: 20
30%-39.9%: 17
20%-29.9%: 24
10%-19.9%: 44
0.1%-9.9%: 126
0%: 0
Total Minority Black Tracts: 231

Top 10 Tracts with the Highest Asian Population
1990

1. 7820: 23.3%
2. 1122: 11.2%
3. 1110: 10.8%
4. 105: 9.0%
5. 1810: 8.2%
6. 6372: 7.6%
7. 6384: 7.3%
8. 1121: 7.2%
9. 6386: 6.9%
10. 6395: 6.8%
2015
1. 7820: 34.1%
2. 7721: 26.8%
3. 6230: 26.7%
4. 1122: 21.9%
5. 7830: 17.0%
6. 1110: 16.6%
7. 105: 16.2%
8. 6395: 15.5%
9. 6372: 15.3%
10. 6386: 14.9%

Breakdown of # of Tracts by % of Asian Population
1990

95% or Higher: 0
90%-94.9%: 0
80%-89.9%: 0
70%-79.9%: 0
60%-69.9%: 0
50%-59.9%: 0
Total Majority Asian Tracts: 0
40%-49.9%: 0
30%-39.9%: 0
20%-29.9%: 1
10%-19.9%: 2
0.1%-9.9%: 273
0%: 7
Total Minority Asian Tracts: 283
2015
95% or Higher: 0
90%-94.9%: 0
80%-89.9%: 0
70%-79.9%: 0
60%-69.9%: 0
50%-59.9%: 0
Total Majority Asian Tracts: 0
40%-49.9%: 0
30%-39.9%: 1
20%-29.9%: 4
10%-19.9%: 17
0.1%-9.9%: 215
0%: 46
Total Minority Asian Tracts: 283

Top 10 Tracts with the Highest Hispanic Population
1990

1. 7820: 2.9%
2. 1122, 7209: 2.5%
3. 1810, 30: 2.3%
4. 8163, 9323, 9336: 2.1%
5. 6352, 7830: 2.0%
6. 1110, 1121, 2750: 1.9%
7. 10, 32, 40, 42, 7533: 1.8%
8. 12, 17, 1901, 6353, 7041, 7199: 1.7%
9. 6, 1820, 6945, 7531, 7551, 7721, 9326, 99: 1.6%
10. 13, 2710, 6933, 7120, 7532, 8164, 8230, 8730, 103: 1.5%
2015
1. 8230: 39.3%
2. 8164: 28.7%
3. 8163: 26.4%
4. 26: 24.2%
5. 9321: 22.7%
6. 8210: 22.6%
7. 99: 21.4%
8. 9230: 21.0%
9. 7043: 19.8%
10. 6945: 18.9%

Breakdown of # of Tracts by % of Hispanic Population
1990

95% or Higher: 0
90%-94.9%: 0
80%-89.9%: 0
70%-79.9%: 0
60%-69.9%: 0
50%-59.9%: 0
Total Majority Hispanic Tracts: 0
40%-49.9%: 0
30%-39.9%: 0
20%-29.9%: 0
10%-19.9%: 0
0.1%-9.9%: 278
0%: 5
2015
95% or Higher: 0
90%-94.9%: 0
80%-89.9%: 0
70%-79.9%: 0
60%-69.9%: 0
50%-59.9%: 0
Total Majority Hispanic Tracts: 0
40%-49.9%: 0
30%-39.9%: 1
20%-29.9%: 7
10%-19.9%: 33
0.1%-9.9%: 241
0%: 9

Integrated Tracts By Year
1990: 2
2015: 98

Most Integrated Tract by Year
1990
1122: White: 76.6% Black: 9.6% Asian: 11.2% Hispanic: 2.5%
2015
7721: White: 33.9% Black: 31.2% Asian: 26.8% Hispanic: 10.1%

All in all, the data shows that the county is much less racially stratified/segregated now than it was in 1990, and that it doesn’t appear that gentrification is really affecting many areas in terms of forcing out one racial group for another.


Columbus City Diversity and Peer Comparison


In the 2nd post related to the recently-released Censusdemographic data, I’ll look at Columbus city diversity and how it’s been changing since 2005, as well as how it compares to other regional and national peers.

Rank by City of Total White, non-Hispanic Population by Year
2005————————————–2010————————————-2015

1. Chicago, IL: 819,215————1. Chicago: 853,910—————1. Chicago: 879,318
2. Indianapolis, IN: 491,044——2. Indianapolis: 482,195———–2. Columbus: 491,602
3. Columbus: 442,958————-3. Columbus: 470,971————-3. Indianapolis: 479,376
4. Portland, OR: 382,033———-4. Portland: 417,876—————4. Portland: 449,552
5. San Antonio, TX: 356,420—–5. Austin: 384,065——————5. Austin: 444,638
6. Austin, TX: 347,013————-6. San Antonio: 351,420———-6. Nashville: 365,542
7. Nashville, TN: 314,518——–7. Nashville: 339,030————–7. San Antonio: 364,707
8. Charlotte, NC: 302,789——-8. Charlotte: 331,357—————8. Charlotte: 356,507
9. Virginia Beach, VA: 290,891–9. Virginia Beach: 282,812——9. Omaha: 293,631
10. San Jose, CA: 281,822—–10. Las Vegas: 280,604——-10. Virginia Beach: 281,686
11. Las Vegas, NV: 281,679—-11. Omaha: 277,606————–11. Las Vegas: 278,444
12. Omaha, NE: 267,685——–12. San Jose: 265,311————12. San Jose: 268,948
13. Kansas City, MO: 249,123—13. Kansas City: 247,473——13. Kansas City: 261,360
14. Milwaukee, WI: 219,891——14. Minneapolis: 242,848——14. Minneapolis: 243,709
15. Minneapolis, MN: 216,975—-15. Milwaukee: 221,514——-15. Milwaukee: 216,755
16. Toledo: 183,746—————–16. Pittsburgh: 203,622——–16. Pittsburgh: 192,187
17. Pittsburgh, PA: 180,725——-17. Toledo: 177,341————17. Toledo: 164,305
18. Sacramento, CA: 160,599—-18. Sacramento: 165,610—–18. Sacramento: 155,784
19. Cleveland: 147,359————19. Cincinnati: 143,120——–19. Cincinnati: 147,360
20. St. Louis, MO: 143,590——–20. Cleveland: 137,977——–20. St. Louis: 138,178
21. Cincinnati: 138,486————-21. St. Louis: 134,146———-21. Cleveland: 133,998
22. Akron: 128,976——————22. Akron: 120,800————22. Grand Rapids: 119,128
23. Grand Rapids, MI: 113,791—23. Grand Rapids: 104,636—-23. Akron: 117,587
24. Orlando, FL: 92,326————24. Orlando: 96,867————24. Orlando: 102,822
25. Detroit, MI: 77,163————–25. Dayton: 72,663————-25. Dayton: 75,539
26. Dayton: 67,581——————26. Providence: 64,284——-26. Detroit: 64,511
27. Providence, RI: 64,223——–27. Detroit: 55,298————-27. Providence: 61,492

Columbus moved from 3rd to 2nd over the 10-year period for total White, non-Hispanic population.

Rank by City of Total Black, non-Hispanic Population by Year
2005—————————————–2010———————————2015

1. Chicago: 938,097—————–1. Chicago: 895,294———–1. Chicago: 834,048
2. Detroit: 683,999——————–2. Detroit: 587,707————-2. Detroit: 536,527
3. Milwaukee: 222,040————–3. Charlotte: 251,274———-3. Charlotte: 282,456
4. Cleveland: 221,797—————4. Milwaukee: 230,473——–4. Indianapolis: 234,338
5. Charlotte: 205,216—————-5. Indianapolis: 226,314——-5. Columbus: 233,320
6. Indianapolis: 193,948————6. Columbus: 216,486———6. Milwaukee: 231,304
7. Columbus: 179,197—————7. Cleveland: 208,528———7. Cleveland: 194,350
8. St. Louis: 168,768—————-8. Nashville: 171,104———–8. Nashville: 178,293
9. Nashville: 148,051—————-9. St. Louis: 157,382———–9. St. Louis: 146,925
10. Kansas City: 131,694———-10. Kansas City: 138,461—–10. Kansas City: 140,515
11. Cincinnati: 131,010————-11. Cincinnati: 131,909——–11. Cincinnati: 125,621
12. Pittsburgh: 81,758————–12. Virginia Beach: 79,583—-12. San Antonio: 98,876
13. Virginia Beach: 80,004——–13. San Antonio: 79,307——13. Virginia Beach: 85,867
14. Orlando: 73,736—————–14. Toledo: 75,033————-14. Minneapolis: 78,861
15. Toledo: 72,190——————-15. Pittsburgh: 71,539——–15. Toledo: 76,173
16. Sacramento: 71,452————16. Orlando: 70,988————16. Pittsburgh: 73,012
17. San Antonio: 70,723————17. Minneapolis: 63,749——17. Las Vegas: 68,777
18. Dayton: 60,196——————-18. Sacramento: 61,976——18. Austin: 68,061
19. Akron: 59,810——————–19. Austin: 61,833————–19. Sacramento: 63,477
20. Las Vegas: 59,780————–20. Dayton: 61,402————-20. Orlando: 61,955
21. Austin: 59,583——————-21. Akron: 60,653—————-21. Akron: 58,716
22. Minneapolis: 57,499————22. Las Vegas: 60,187———22. Omaha: 57,546
23. Omaha: 50,333——————23. Omaha: 55,086————-23. Dayton: 51,896
24. Grand Rapids: 40,408———24. Grand Rapids: 41,848—–24. Portland: 35,362
25. Portland: 30,828—————25. Portland: 37,355————-25. Grand Rapids: 32,423
26. San Jose: 27,446————–26. San Jose: 29,831———–26. San Jose: 30,068
27. Providence: 18,794————27. Providence: 19,265——–27. Providence: 21,484

Columbus moved up from 7th to 5th in total Black, non-Hispanic during the period.

Rank by City of Total Asian, non-Hispanic Population by Year
2005————————————-2010——————————————2015

1. San Jose: 269,186————–1. San Jose: 303,227—————–1. San Jose: 355,777
2. Chicago: 127,686—————-2. Chicago: 148,280——————2. Chicago: 166,771
3. Sacramento: 80,307————3. Sacramento: 84,556————-3. Sacramento: 88,422
4. Portland: 36,278—————–4. Austin: 46,575———————-4. Austin: 69,696
5. Austin: 35,239——————–5. Portland: 43,185——————-5. Charlotte: 50,142
6. Columbus: 27,125—————6. Las Vegas: 37,406—————-6. Portland: 49,811
7. Las Vegas: 25,077————–7. Charlotte: 37,181——————7. Columbus: 42,933
8. Charlotte: 23,356—————-8. Columbus: 35,468—————-8. San Antonio: 41,988
9. Virginia Beach: 22,501———9. San Antonio: 29,200————-9. Las Vegas: 41,782
10. San Antonio: 20,492———10. Virginia Beach: 27,303—–10. Virginia Beach: 28,358
11. Minneapolis: 20,189———-11. Milwaukee: 22,670————11. Minneapolis: 26,958
12. Milwaukee: 19,596————12. Minneapolis: 21,426———–12. Indianapolis: 25,264
13. Nashville: 16,943—————13. Indianapolis: 17,137———-13. Milwaukee: 22,497
14. Indianapolis: 12,312———–14. Nashville: 17,045————–14. Nashville: 20,577
15. Providence: 10,751————15. Pittsburgh: 12,036————-15. Pittsburgh: 18,067
16. Pittsburgh: 10,727————–16. Providence: 11,497———–16. Omaha: 15,243
17. Kansas City: 10,674———-17. Kansas City: 10,263———–17. Kansas City: 13,552
18. Detroit: 9,577——————-18. St. Louis: 8,717—————–18. Providence: 10,842
19. St. Louis: 7,046—————–19. Omaha: 8,397——————19. St. Louis: 8,920
20. Omaha: 6,971——————20. Orlando: 7,870——————20. Detroit: 8,790
21. Cincinnati: 6,874—————21. Detroit: 6,549——————–21. Akron: 8,006
22. Cleveland: 6,289————–22. Cincinnati: 5,938—————–22. Orlando: 7,949
23. Orlando: 5,528—————–23. Cleveland: 5,392—————–23. Cleveland: 7,874
24. Toledo: 4,150——————-24. Akron: 4,567———————-24. Cincinnati: 6,259
25. Akron: 3,497——————–25. Grand Rapids: 3,695———–25. Toledo: 5,008
26. Grand Rapids: 2,847———26. Toledo: 3,125——————-26. Grand Rapids: 4,451
27. Dayton: 1,827——————27. Dayton: 1,231——————-27. Dayton: 1,548

Columbus fell from 6th to 7th in Asian, non-Hispanic population.

Rank by City of Total Hispanic Population by Year
2005——————————————–2010————————————2015

1. Chicago: 778,234—————1. San Antonio: 853,654———-1. San Antonio: 937,607
2. San Antonio: 735,458———–2. Chicago: 763,968—————2. Chicago: 787,725
3. San Jose: 279,420————–3. San Jose: 318,389————–3. San Jose: 331,232
4. Austin: 223,361——————4. Austin: 288,130——————4. Austin: 327,680
5. Las Vegas: 153,813————5. Las Vegas: 181,923————-5. Las Vegas: 204,913
6. Sacramento: 111,559———6. Sacramento: 124,461———–6. Sacramento: 150,153
7. Milwaukee: 80,945————-7. Milwaukee: 104,619————-7. Charlotte: 113,731
8. Providence: 60,008————-8. Charlotte: 96,246—————-8. Milwaukee: 110,335
9. Charlotte: 58,466—————9. Indianapolis: 78,467————-9. Orlando: 89,306
10. Indianapolis: 47,764———10. Providence: 76,645————10. Indianapolis: 83,426
11. Detroit: 46,993—————–11. Nashville: 61,212————–11. Providence: 77,968
12. Orlando: 43,978—————12. Portland: 58,986—————12. Nashville: 67,526
13. Portland: 43,324—————13. Orlando: 56,061—————13. Omaha: 63,516
14. Omaha: 39,674—————–14. Omaha: 53,661—————14. Portland: 61,064
15. Nashville: 37,463—————15. Kansas City: 49,800———15. Detroit: 53,980
16. Minneapolis: 37,017———–16. Detroit: 45,580—————-16. Columbus: 46,855
17. Kansas City: 35,995———–17. Columbus: 43,276————17. Kansas City: 46,037
18. Grand Rapids: 32,368———18. Cleveland: 36,067———-18. Cleveland: 40,603
19. Cleveland: 32,085————–19. Minneapolis: 34,504——-19. Minneapolis: 39,981
20. Columbus: 24,607———–20. Grand Rapids: 30,659——20. Virginia Beach: 36,309
21. Virginia Beach: 20,803——–21. Virginia Beach: 29,206—-21. Grand Rapids: 31,282
22. Toledo: 18,404——————22. Toledo: 21,346————–22. Toledo: 23,614
23. St. Louis: 8,268—————–23. St. Louis: 11,207————-23. St. Louis: 12,261
24. Pittsburgh: 5,018—————24. Cincinnati: 8,710————-24. Pittsburgh: 9,266
25. Cincinnati: 3,855—————25. Pittsburgh: 7,282————-25. Cincinnati: 9,121
26. Akron: 3,485——————–26. Akron: 3,990——————-26. Dayton: 4,945
27. Dayton: 1,693——————-27. Dayton: 3,180—————–27. Akron: 3,684

Columbus moved up from 20th to 16th in the total Hispanic population.

Rank by City of Total Other, non-Hispanic Population by Year
2005——————————————-2010———————————————–2015

1. Chicago: 38,694—————1. Chicago: 37,379————————–1. Chicago: 54,694
2. San Jose: 29,456————2. San Jose: 32,439————————2. San Jose: 40,894
3. Sacramento: 21,370———-3. Sacramento: 30,900——————-3. Portland: 36,398
4. Portland: 21,164————–4. Portland: 28,027————————4. Columbus: 34,357
5. Indianapolis: 20,242———-5. Las Vegas: 24,521—————–5. Sacramento: 32,909
6. Columbus: 20,096————-6. Columbus: 23,738——————6. Las Vegas: 29,853
7. San Antonio: 19,130———-7. San Antonio: 20,778—————7. San Antonio: 26,646
8. Minneapolis: 18,580———-8. Minneapolis: 20,753—————-8. Indianapolis: 26,019
9. Detroit: 18,324—————–9. Virginia Beach: 20,268————-9. Charlotte: 24,285
10. Las Vegas: 18,304———-10. Indianapolis: 20,086————–10. Nashville: 22,658
11. Virginia Beach: 16,685—-11. Charlotte: 18,360——————11. Austin: 21,765
12. Milwaukee: 14,476———-12. Detroit: 16,776——————–12. Minneapolis: 21,426
13. Kansas City: 13,399——–13. Milwaukee: 16,311———–13. Virginia Beach: 20,525
14. Austin: 13,261—————-14. Omaha: 15,519—————-14. Milwaukee: 19,263
15. Charlotte: 11,771————-15. Austin: 14,915—————–15. Omaha: 13,951
16. Omaha: 8,552—————–16. Kansas City: 14,668———-16. Kansas City: 13,897
17. Toledo: 7,447——————17. Nashville: 14,227————-17. Detroit: 13,316
18. Cincinnati: 7,315————–18. Pittsburgh: 12,080————18. Pittsburgh: 11,853
19. Cleveland: 7,004————–19. Toledo: 10,134—————-19. Cleveland: 11,234
20. Providence: 6,488————-20. Akron: 9,020——————20. Toledo: 10,678
21. Pittsburgh: 6,138————–21. Cleveland: 8,276—————21. Cincinnati: 10,176
22. St. Louis: 6,058—————-22. St. Louis: 7,704—————22. Akron: 9,560
23. Orlando: 5,731—————–23. Grand Rapids: 7,376——-23. St. Louis: 9,401
24. Nashville: 5,687—————24. Orlando: 7,251————–24. Orlando: 8,885
25. Akron: 4,431——————–25. Cincinnati: 7,230———–25. Grand Rapids: 7,815
26. Grand Rapids: 4,154———26. Providence: 6,471———-26. Providence: 7,418
27. Dayton: 1,382——————27. Dayton: 3,025—————27. Dayton: 6,669

Finally, Columbus moved up from 6th to 4th in the total of Other, non-Hispanic population. Overall, Columbus ranks fairly well in totals vs. its peers, as one might expect given that it is one of the largest cities in the grouping. However, to truly find out how it compares with these other cities, you have to look at percentages, which tells how much of the city’s populationis made up of each group.
Columbus city diversity
Columbus had the 8th highest White, non-Hispanic % of total population of the city in 2015.


Columbus had the 12th highest Black, non-Hispanic % of total population.


Columbus also had the 12th highest Asian, non-Hispanic % of total population.


Columbus ranks poorly with Hispanics in the group, having only the 22nd highest % of population.


Finally, Columbus ranks 8th again in Other, non-Hispanic % of population.

So what’s the final ranking for where Columbus is with diversity compared to its peers? To find out, I assigned points based on ranked position in each 5 racial categories. The final total determined where the cities ranked overall.

So based on this, Columbus is the 6th most racially diverse city of the 27 cities measured. This is no doubt surprising, but not so much when you get to the numbers.

*Note: Normally, Youngstown would be included, but the data was not available.