In Week in Review 2, we find that the FBI has finally released the full crime numbers for 2017 for all cities. How did Columbus fare? Well, it was a decidedly mixed bag. Total murders were their highest ever, at 143, but the rate fell quite short of the record set back in 1991. So far for 2018, murder is behind 2017’s rate by about 22%, so it’s a good improvement, but still not even close to where it should be.
Other violent crime figures 2016 to 2017 -Rape continued its multi-year rise in the city, reaching 919 incidents. This was a 6% increase over 2016. -Assaults were up 4% over 2016, but in the context of still being one of the lowest totals in the past 30 years. -Robberies were down almost 8.5% over 2016. -Despite the rises in most types of violent crime, the drop in robberies meant overall violent crime dropped by about 0.5%. Property crime figures 2016 to 2017 -Burglaries were down more than 8%. -Larceny thefts were down about 2.9% -Motor vehicle thefts were up 17.6%, so not a good trend, but still less than half the rate it was 15-20 years ago. -Overall property crime was down about 2% versus 2016.
And if you think this year’s been particularly wet, you are right! Through October 1st, Columbus is having its 3rd wettest year on record. Only 1882 and 1890 are ahead of 2018 at this point, and by barely 1″. 2018 at this point is running almost 14″ above normal. Top 10 Wettest Years Through October 1st 1. 1882: 44.55″ 2. 1890: 43.56″ 3. 2018: 43.31″ 4. 1979: 42.17″ 5. 2003: 41.58″ 6. 2011: 41.12″ 7. 1990: 39.10″ 8. 1949: 38.54″ 9. 2004: 38.46″ 10. 1996: 37.46″ It is surprising how many recent years are on this list. Still with 3 months to go, the pattern could break, but it’s very unlikely that 2018 doesn’t end up in the top 10. Here are the top 10 wettest full years. 1. 2011: 54.96″ 2. 1990: 53.16″ 3. 1882: 51.30″ 4. 1890: 50.73″ 5. 2004: 49.27″ 6. 1979: 49.17″ 7. 2003: 49.03″ 8. 1883: 48.88″ 9. 1881: 46.99″ 10. 2017: 46.61″
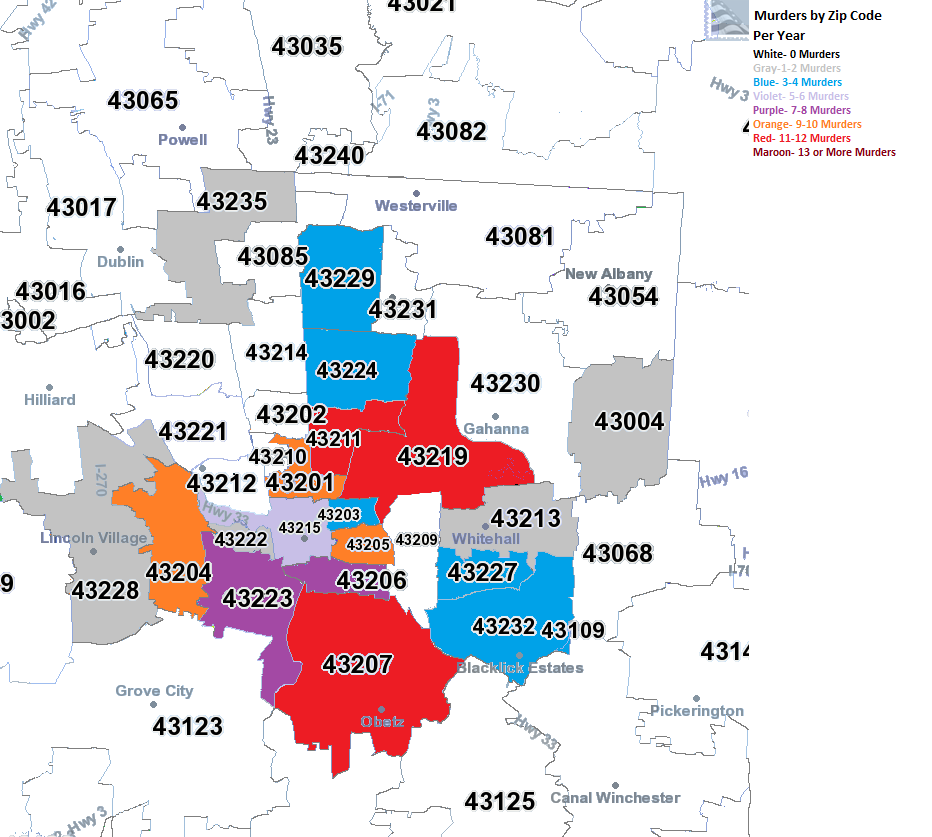
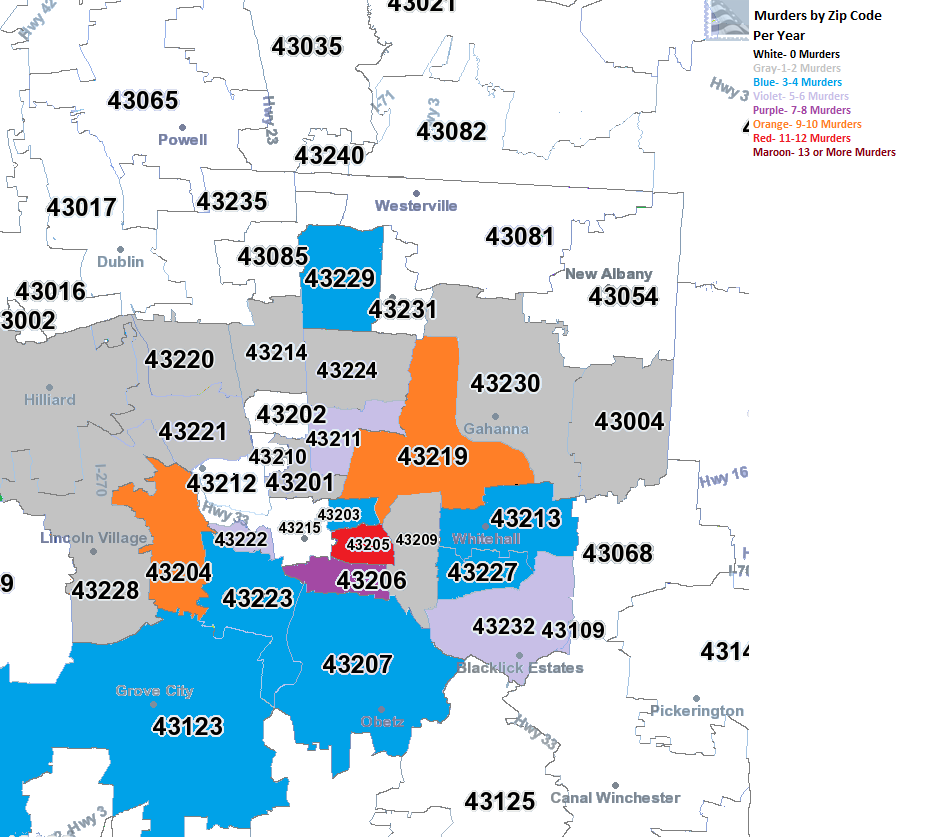
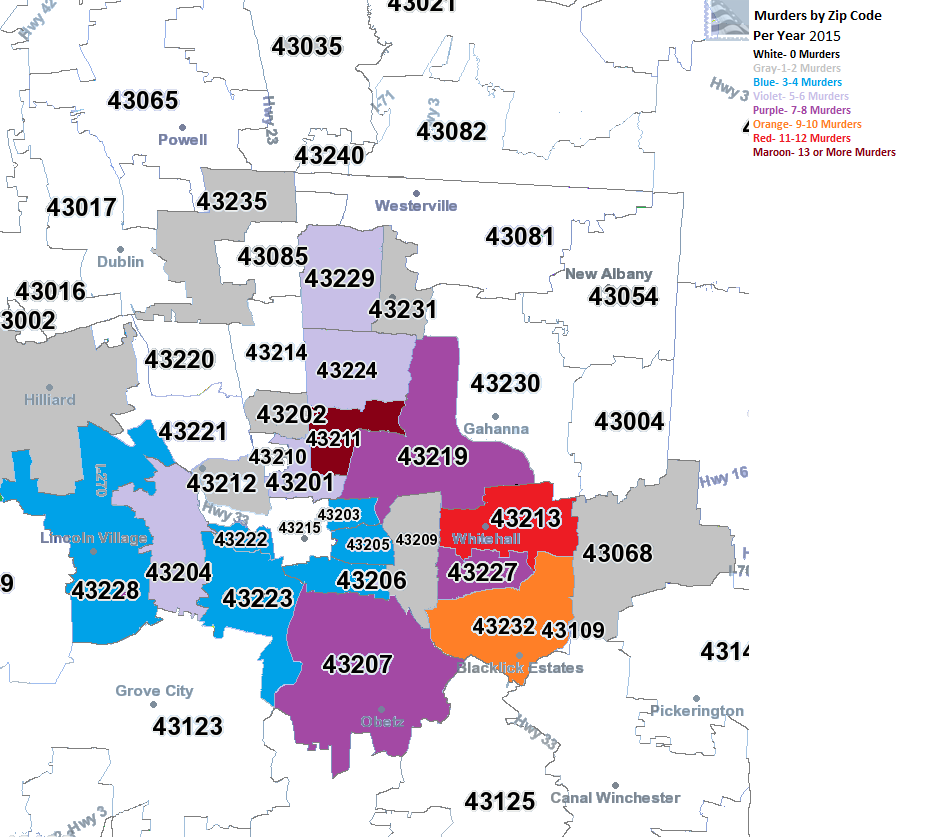
I have been wanting to do these maps for awhile now, as there have been several searches on the site for them and they weren’t available. It took a lot of work, but here are the maps for Columbus area murders by zip code 2008-2015.
2008 In 2008, almost all murders were contained within the I-270 boundaries. The East and South Sides were the worst areas.
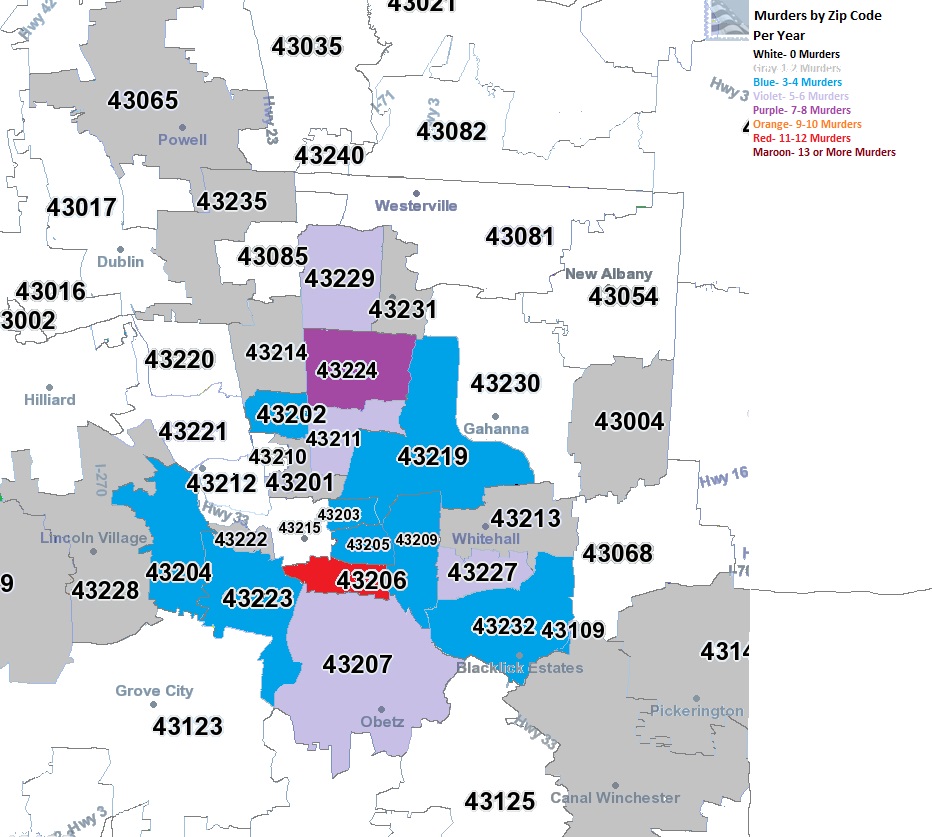
2009 In 2009, there began to be a bit of diffusion on where murder was taking place. While parts of the urban core remained the worst areas, suburban areas also saw the occasional murder.
2010 The diffusion continued in 2010.
2011 And in 2011.
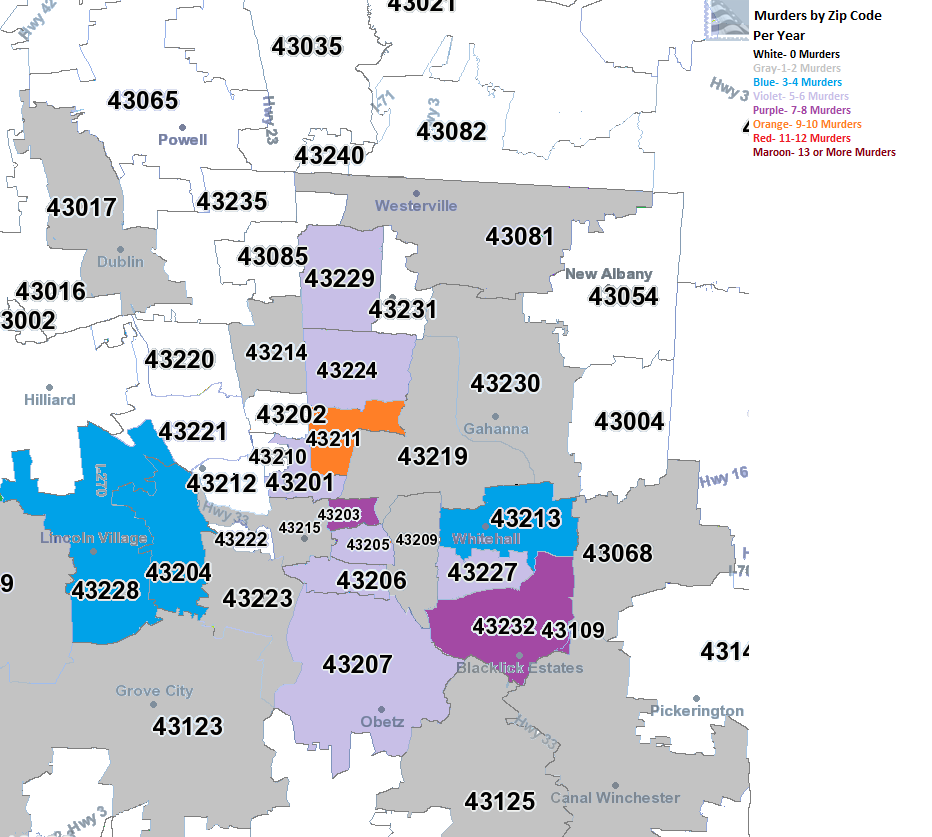
2012 2012 was the most diffuse of all the years, with no heavily concentrated areas, even in the urban core as much. Meanwhile, most of the suburban zip codes within Franklin County saw at least 1 murder.
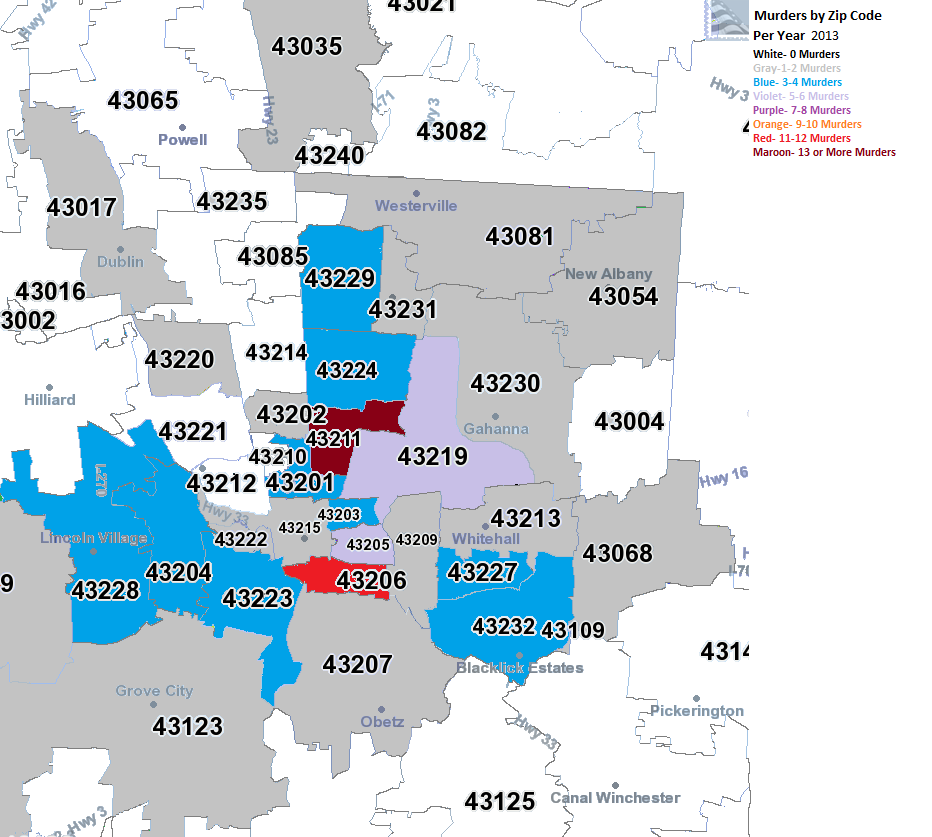
2013
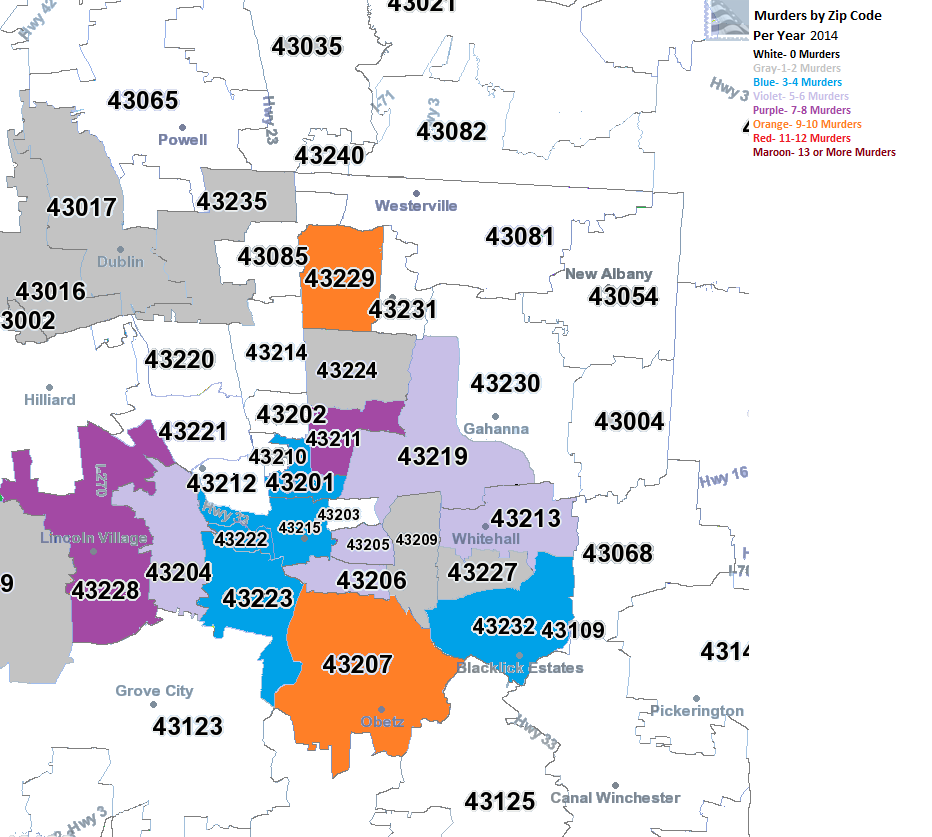
2014
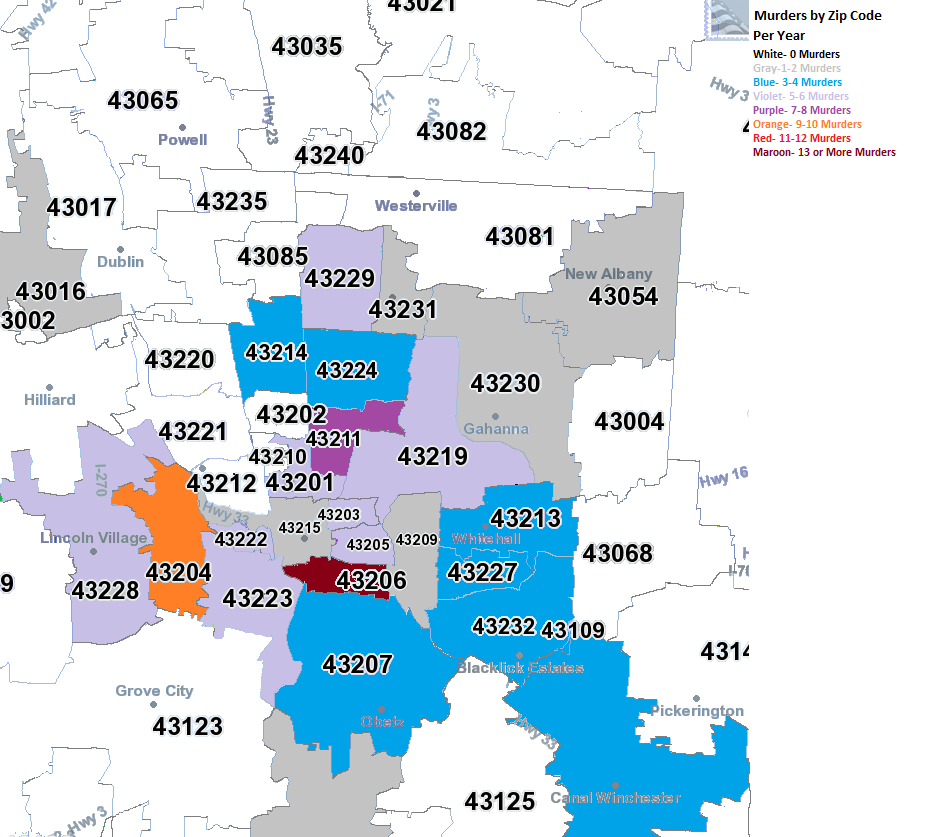
2015 By 2015, most activity was on the eastern side of the city, particular South Linden and the Far East Side around Whitehall and Reynoldsburg, but all areas along the 270 area on the Far East Side had the highest levels of murder in the county. The central core generally stayed a lot lower, creating a much more prominent donut shape than what existed back in 2008. This seems to indicate that as the central core gains in population and income, crime is also being pushed further out.
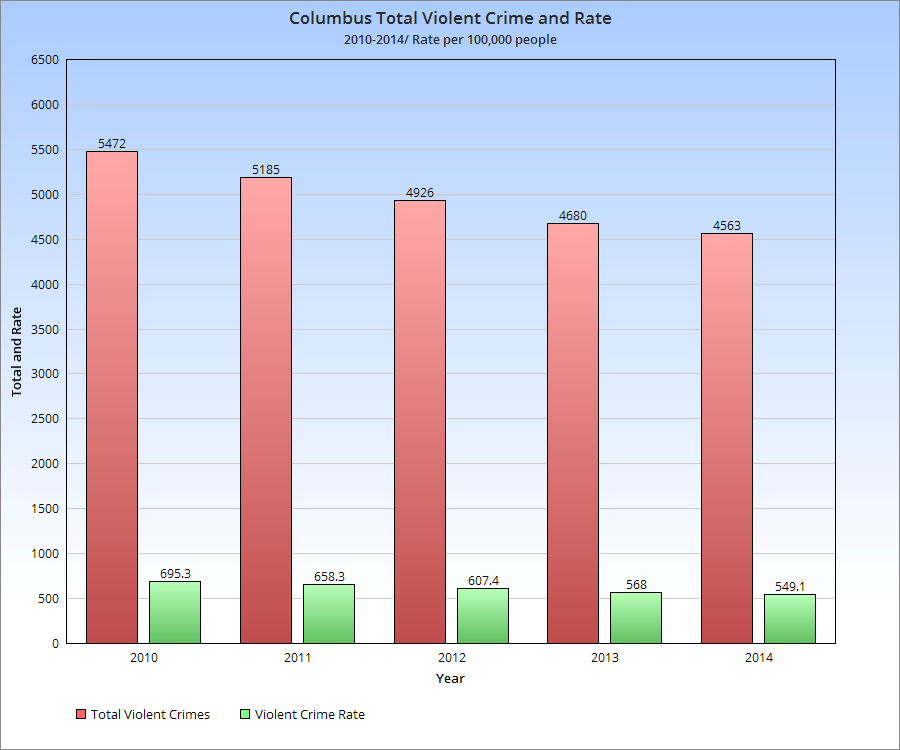
The FBI recently released full 2014 crime statistics for its Uniform Crime Reporting program, and the results show how Columbus crime plummets between 2010 and 2014.
Let’s take a look at some of the numbers. First up, violent crimes.
Total violent crimes between 2010 and 2014 fell 16.6%, with any single person’s chances in 100k of being a victim of violent crime falling 21%. This is a pretty significant drop in just 4 years.
Here’s an individual violent crime breakdown: -Murders were down 15.2% -Rape was up 28.6%. The definition has changed in this time, which may explain some of that increase. -Robbery was down 37.7% -Aggravated Assault was up 14.6%.
So some good and bad. The good news for assault is that it’s well under where it was just 10 years ago, and almost 50% down from its historic peak in the early 1990s. It may have just been a bit worse year in 2014 for this, as all crime totals go through spikes even during a general decline. The bad news is that rape is historically high, but because the definitions have changed for it recently, it’s hard to make a fair comparison to previous years. If the current definition was in place years ago, it’s certainly possible it would now show a decline. Or, as with assault, rape totals could’ve seen a temporary spike above the trend line. Future years will tell the tale.
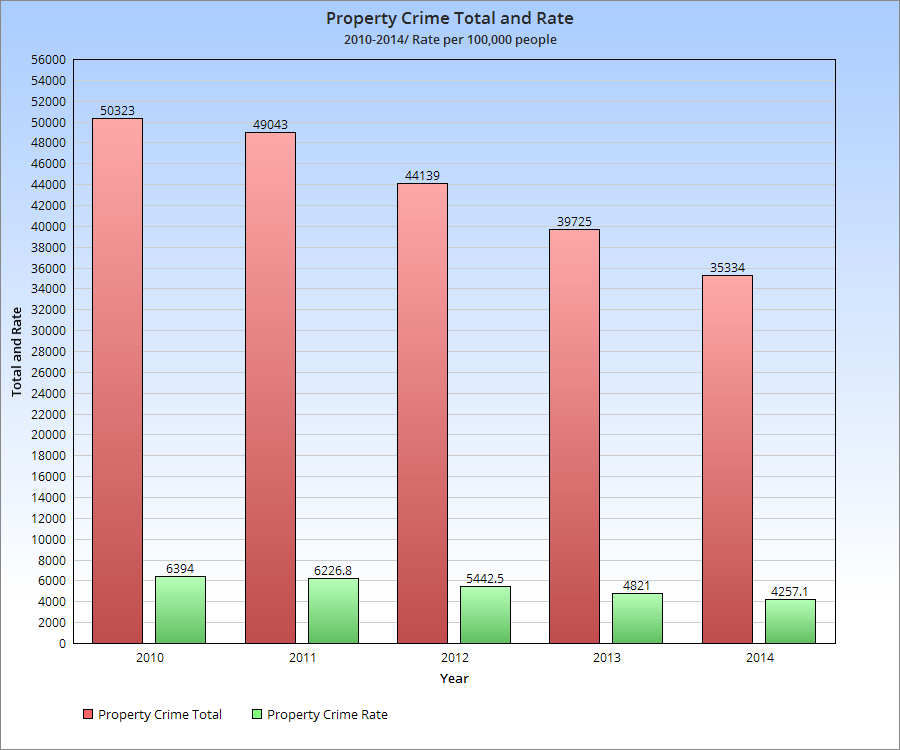
Now for property crime, something that’s always been somewhat high in Columbus, possibly due to the young population age and large number of college students.
Property crime in the city has dropped 29.8% 2010-2014, even more significant than the decrease in violent crime.
So what about 2015 and beyond? Well, indications are that crime is up for 2015 vs. last year, though there are differing theories as to why. Crime being up seems to be widespread in cities around the nation, and some of it has been attributed to a newfound national popularity in heroin. Until we see 2015’s number sometime next year, we won’t know exactly the impact. For now, we can celebrate that the city has indeed become safer.
Police departments nationally have been in the news quite a bit lately, but usually not for positive reasons. Excessive force, racism and even murder charges have been levied against police. While it is difficult to measure such incidents within individual departments, we can at least look at how big police departments are relative to a city’s population, and that’s what this post is about.
I looked at Columbus and its peers and Midwest counterparts to see where the Columbus police force ranked in terms of police presence within the city limits. Here is what I found.
So now that we know the size of the police force in these places, does the size have a correlation to crime rates?
Here is the violent crime rate for the same year as these stats, 2012. The rank for police force per 10K people is listed beside the violent crime ranking.
Based on the ranking above, which cities are getting the best bang for their police force? That would be cities with a larger police force ranking (by at least 2 spots) than violent crime ranking. These would include: Orlando, Cincinnati, Youngstown, Las Vegas, Pittsburgh, Charlotte, Providence, Columbus, Jacksonville, Austin, Madison, Virginia Beach and Canton.
On the opposite end, the cities with failing police levels vs. violent crime include those places with a higher violent crime ranking than police ranking (by at least 2 spots). Those are: Detroit, Nashville, Indianapolis, Toledo, Minneapolis, Akron, Wichita, Sacramento, Portland, San Antonio and San Jose.
Finally, the cities with violent crime ranked about where their police size is include St. Louis, Cleveland, Milwaukee, St. Louis, Kansas City, Dayton and Omaha.
So Columbus is in the best category. Its violent crime ranking is 4 spots lower than its law enforcement ranking size, meaning that police in Columbus are performing better than average. Let’s just hope they’re doing the right, legal thing when policing.
The Random Columbus Photos 2 edition looks at one of the most infamous building complexes that had ever existed in the city.
Photo Date: Unknown, Pre-1910 Location: The southeastern corner watchtower of the Ohio Penitentiary site. The old Ohio Penitentiary first opened up in 1834. The Civil-War-era building that fronted Spring Street was easily the most iconic. It can be seen in the background of the photo as the lighter building. The Ohio Pen had an interesting, and occasionally disastrous, life. On April 21, 1930, a massive fire broke out that would kill 322 inmates and become the worst prison fire in United State history. Despite the fire, the prison’s population would continue to grow. At its peak in 1955, the prison held over 5,200 inmates- and singlehandedly provided a large population boost to Downtown. The following year, Ohio began transferring inmates to more modern facilities. The move took nearly 30 years. Ohio moved the last inmates in 1984 and then permanently closed the prison. After the closure, the abandoned prison deteriorated quickly. Due to a lack of state maintenance, a portion of the outer wall collapsed onto some cars in 1996, and the city began to aggressively plan a new life for the site. In 1998, despite some protests to save some of the historic buildings, the city demolished the entire complex to make way for the planned Arena District. Today, the only reminder of the prison site is that the eastern edge of McPherson Commons park runs along the same line as the original outer wall.