For this update, I’m going to do things a bit differently. In previous updates, I have done long ranking lists and it got to be a bit overwhelming. So starting with this update, I’m going to do more charts instead.
In any case, August continued the year-long trend of home sales being down, with the month coming in at more than 11% off from the same time last year. Prices, however, were up more than 6% to reach a monthly record. There continues to be a supply problem, which is the main mechanism driving both lower sales and higher prices.
June’s housing data for the Columbus region was just released. The month continued the same story as the previous 5 months, with home sales down due to a lack of inventory. Prices continued to rise and the number of days to sell a home continued to fall in relation to this problem. As always, I looked at 21 major areas of the Columbus region, both urban and suburban. Here is how those areas performed.
Top 10 June 2014 Sales Totals 1. Columbus: 1,045 2. Upper Arlington: 109 3. Dublin: 108 4. Clintonville: 83 5. Westerville: 77 6. Gahanna: 63 7. Grove City: 62 8. Reynoldsburg: 59 9. New Albany: 38
Top 10 June 2014 Sales Increases over June 2013 1. Downtown: +72.0% 2. Grove City: +14.5% 3. Gahanna: +12.7% 4. German Village: +10.5% 5. Grandview Heights: +6.3% 6. Canal Winchester: +3.8% 7. Hilliard: 0.0% 8. Minerva Park: 0.0% 9. Columbus: -1.8% 10. Reynoldsburg: -5.1%
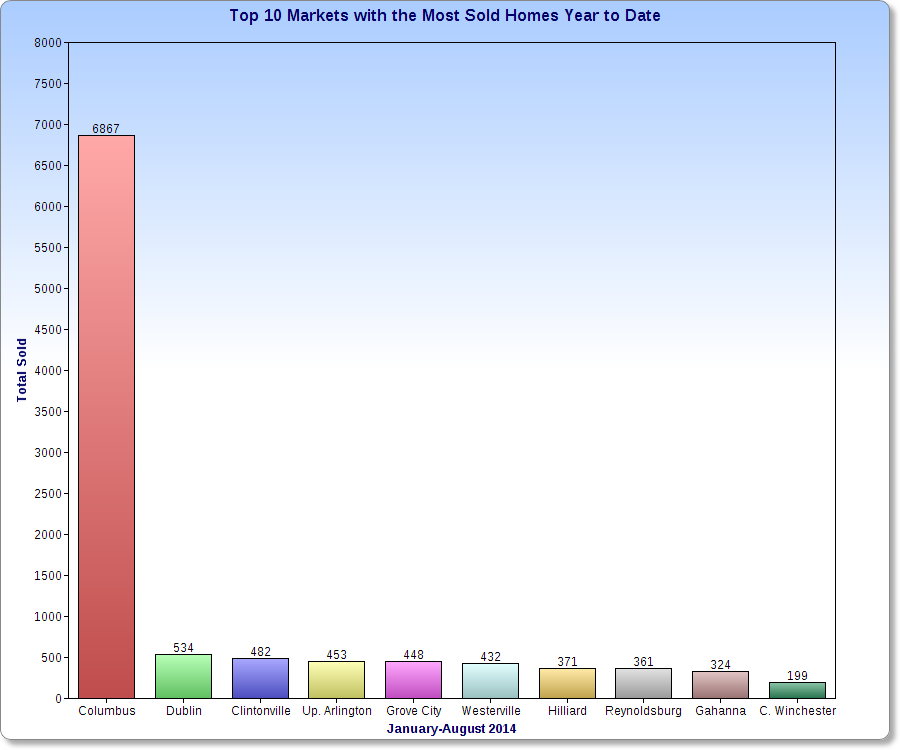
Top 10 Year-to-Date Sales Through June 2014 1. Columbus: 4,803 2. Dublin: 362 3. Grove City: 332 4. Clintonville: 323 5. Westerville: 299 6. Upper Arlington: 294 7. Reynoldsburg: 265 8. Hilliard: 258 9. Gahanna: 221 10. Pickerington: 136
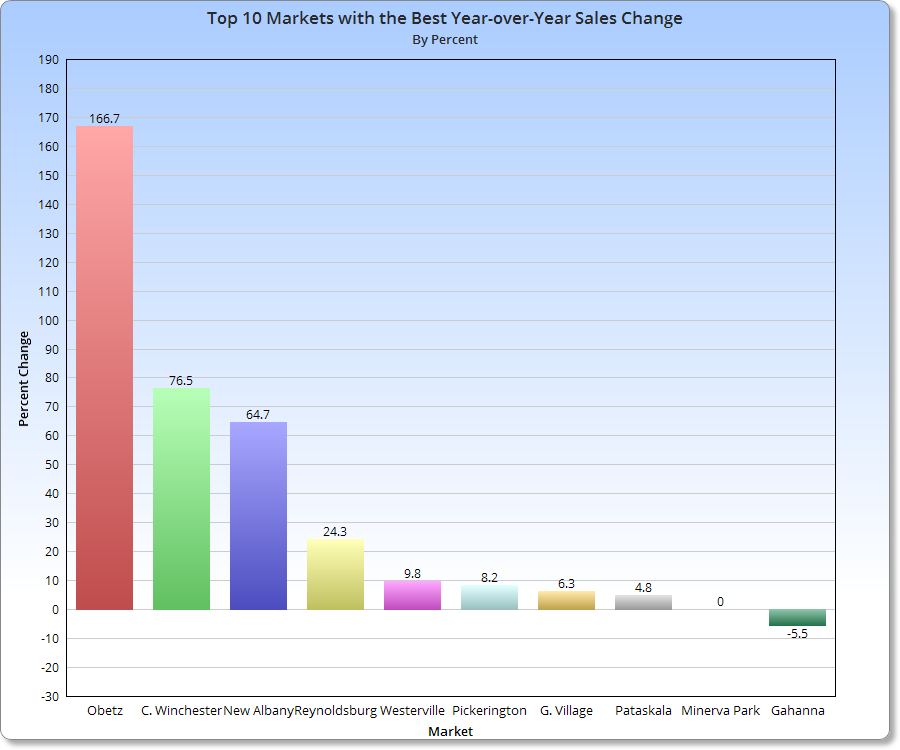
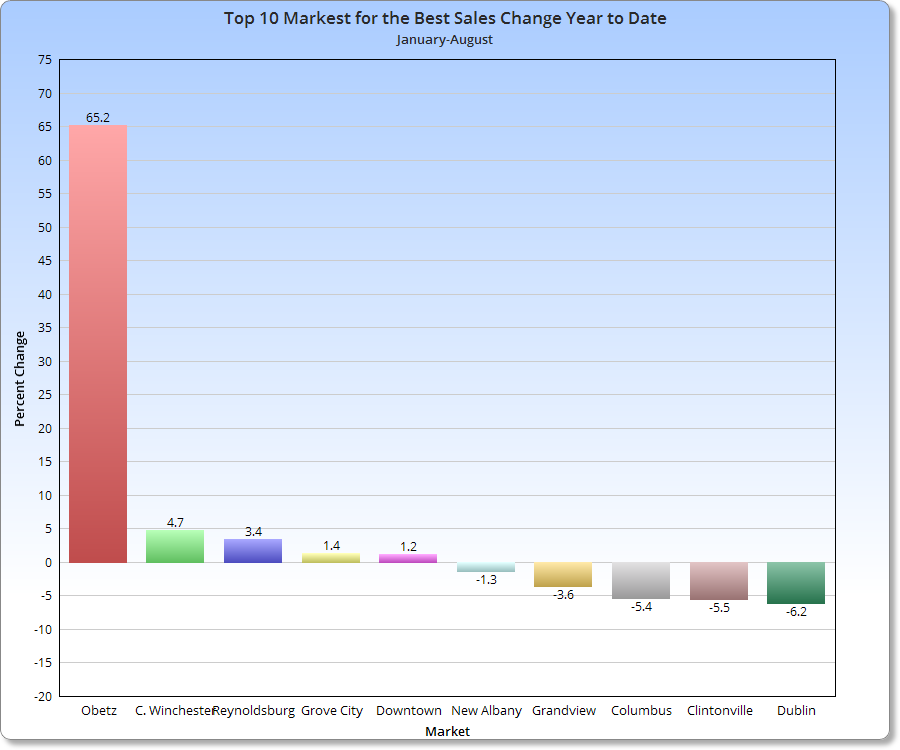
Top 10 Year-to-Date Increases Through June 2014 Over 2013 1. Obetz: +42.1% 2. Downtown: +13.4% 3. Grove City: +11.0% 4. New Albany: +2.8% 5. Reynoldsburg: -0.4% 6. Westerville: -3.2% 7. Pataskala: -3.4% 8. German Village: -3.9% 9. Columbus: -5.3% 10. Clintonville: -5.8%
Average Sales June 2014 Urban: 122.3 Suburban: 55.1 Urban without Columbus: 30
Average % Change June 2014 vs. June 2013 Urban: -5.8% Suburban: -5.1% Urban without Columbus: -6.0%
Average YTD Sales Through June 2014 Urban: 545 Suburban: 222.6 Urban without Columbus: 119.2
Average YTD % Change YTD Through June 2014 Urban: -4.8% Suburban: -5.3% Urban without Columbus: -4.7%
Top 10 Average Sales Price June 2014 1. New Albany: $659,186 2. Upper Arlington: $389,575 3. Bexley: $382,496 4. Dublin: $377,541 5. German Village: $307,753 6. Downtown: $300,582 7. Worthington: $283,209 8. Grandview Heights: $246,271 9. Hilliard: $230,396 10. Gahanna: $229,845
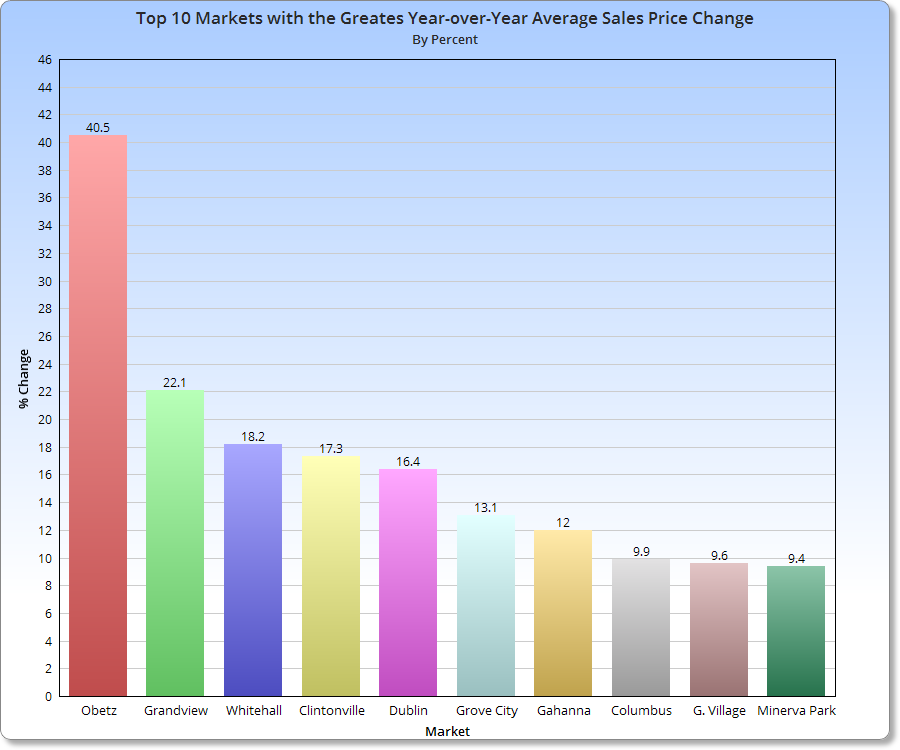
Top 10 Average Sales Price % Change June 2014 vs. June 2013 1. Whitehall: +55.6% 2. Worthington: +17.7% 3. New Albany: +15.8% 4. Bexley: +15.6% 5. Columbus: +12.2% 6. Clintonville: +9.3% 7. Hilliard: +8.5% 8. Canal Winchester: +7.4% 9. Pickerington: +6.7% 10. Gahanna: +6.4%
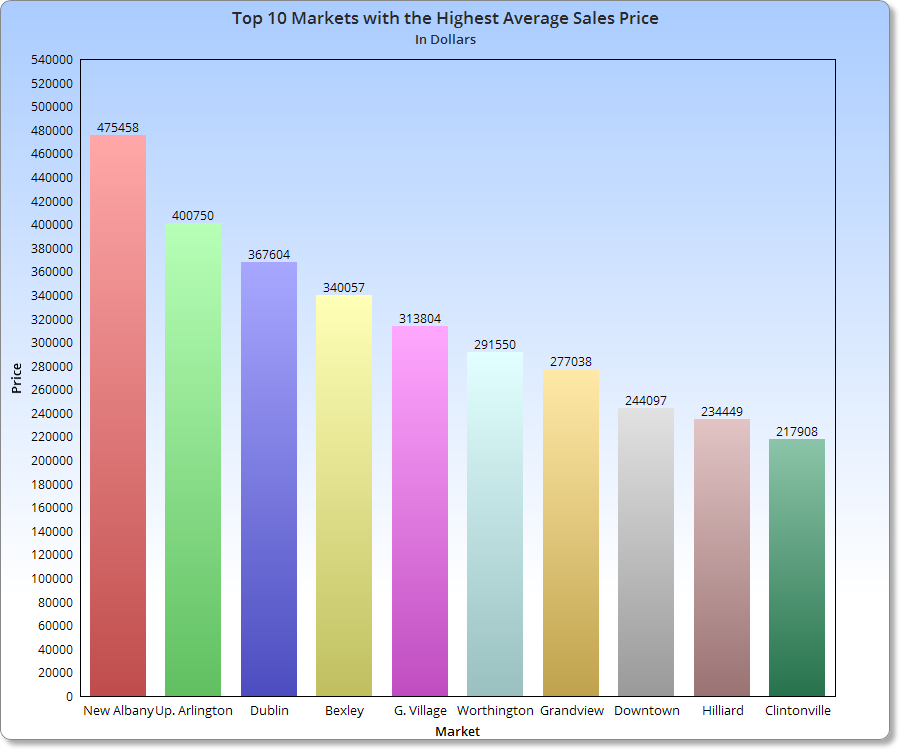
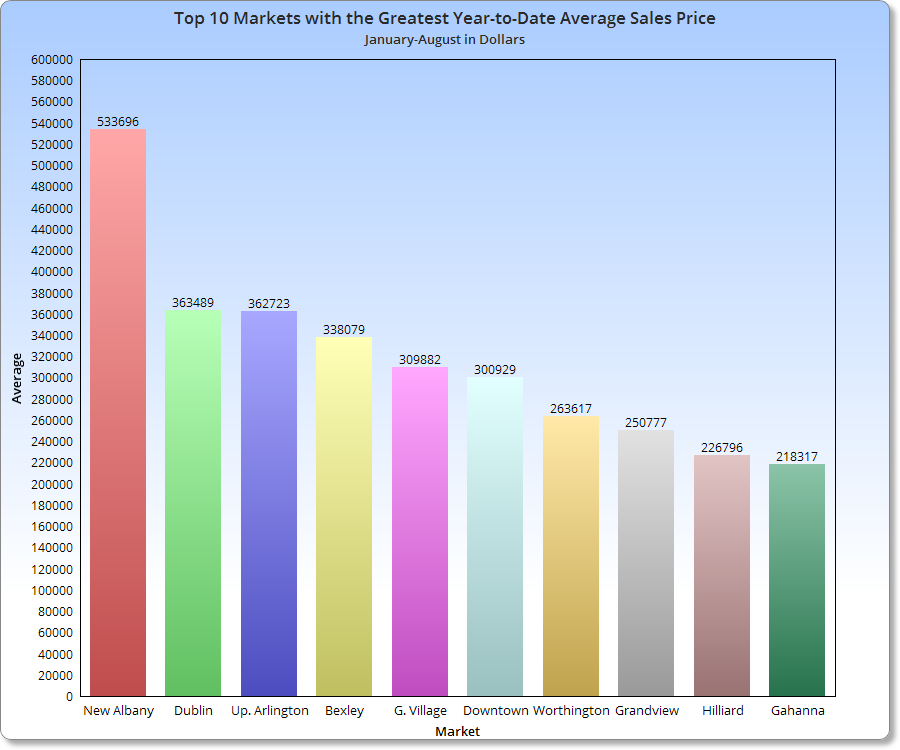
Top 10 Average Sales Prices YTD Through June 2014 1. New Albany: $541,077 2. Dublin: $360,202 3. Upper Arlington: $348,160 4. Bexley: $334,491 5. Downtown: $305,215 6. German Village: $302,117 7. Worthington: $261,659 8. Grandview Heights: $245,946 9. Hilliard: $225,849 10. Gahanna: $213,782
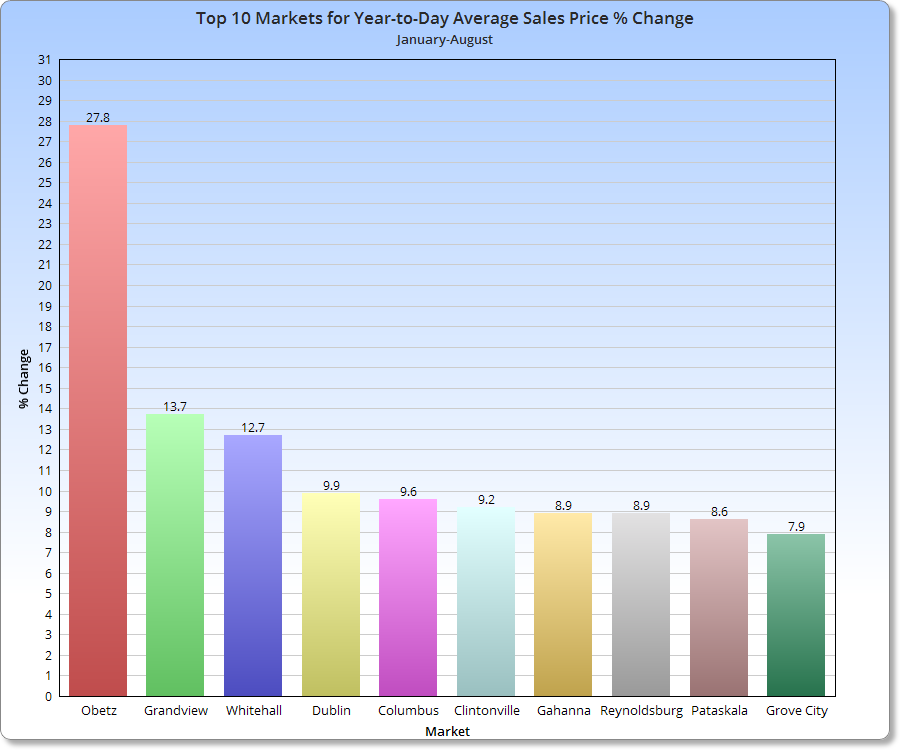
Top 10 Average YTD Sales Price % Change Through June 2014 vs. 2013 1. Obetz: +24.7% 2. Grandview Heights: +15.5% 3. Worthington: +11.3% 4. Pataskala: +10.8% 5. Columbus: +10.6% 6. Pickerington: +9.9% 7. Canal Winchester: +9.5% 8. Downtown: +9.5% 9. Dublin: +9.2% 10. Westerville: +8.5%
Average Sales Price June 2014 Urban: $232,965 Suburban: $253,488 Urban without Columbus: $240,917
Average Sales Price Change June 2014 vs. June 2013 Urban: +7.6% Suburban: +5.0% Urban without Columbus: +7.1%
Average Sales Price YTD Through June 2014 Urban: $220,893 Suburban: $234,492 Urban without Columbus: $229,327
Average Sales Price % Change YTD Through June 2014 Urban: +6.6% Suburban: +7.5% Urban without Columbus: +6.2%
Top 10 Fastest Selling Markets June 2014 (Based on Average # of Days for Listings to Sell) 1. Worthington: 21 2. Upper Arlington: 36 3. Clintonville: 38 4. Gahanna: 39 5. Hilliard: 39 6. Dublin: 40 7. German Village: 42 8. Obetz: 45 9. Bexley: 46 10. Pataskala, Westerville: 47
Average # of Days Before Sale, June 2014 Urban: 47.8 Suburban: 54.3 Urban without Columbus: 47.3
Average # of Days Before Sale YTD Through June 2014 Urban: 58.6 Suburban: 67.8 Urban without Columbus: 57.4
Top 10 Lowest Market Housing Supplies June 2014 (Based on # of Months to Sell all Listings) 1. Grandview Heights: 1.0 2. Worthington: 1.4 3. Westerville: 2.0 4. Clintonville: 2.1 5. German Village: 2.1 6. Gahanna: 2.3 7. Hilliard: 2.5 8. Minerva Park: 2.7 9. Obetz: 2.7 10. Upper Arlington: 2.7
A healthy housing supply is considered to be around 5-6 months. Anything less than 3 months is considered very low. Grandview’s 1 month is ridiculously low and the lowest reading I’ve seen for any area.
Average # of Months to Sell All Listings, June 2014 Urban: 2.7 Suburban: 3.5 Urban without Columbus: 2.6
Average % Change of Single-Family Home Sales June 2014 vs. June 2013 Urban: +33.2% Suburban: -5.4% Urban without Columbus: +36.8%
Average % Change of Single-Family Home Sales YTD Through June 2014 vs. YTD 2013 Urban: -8.8% Suburban: -5.4% Urban without Columbus: -8.9%
Average % Change of Condo Sales June 2014 vs. June 2013 Urban: -4.0% Suburban: +41.0% Urban without Columbus: -5.0%
Average % Change of Condo Sales YTD Through June 2014 vs. YTD 2013 Urban: +19.3% Suburban: +7.0% Urban without Columbus: +21.0%
The housing market update May 2014 report for the Columbus area, courtesy of Columbus Realtorscontinued to show the 5-month long trend of sales being down. As with the previous 4 months, the main reason was high demand coupled with historically low supply.
As for when this situation may change seems hard to guess. The rate of construction for single family homes shows no real signs of improving anytime soon, while renting continues to be the dominant choice right now.
Unfortunately, I have been unable to update this site for about a month, but I am back now and have quite a bit to add. First, I have the numbers for the local Housing Market Update February 2014. Due to changes in the way the numbers were gotten, January’s were not available. I still do them for 21 major areas of Franklin County, however, and here they are. As always, the data is from Columbus Realtors.