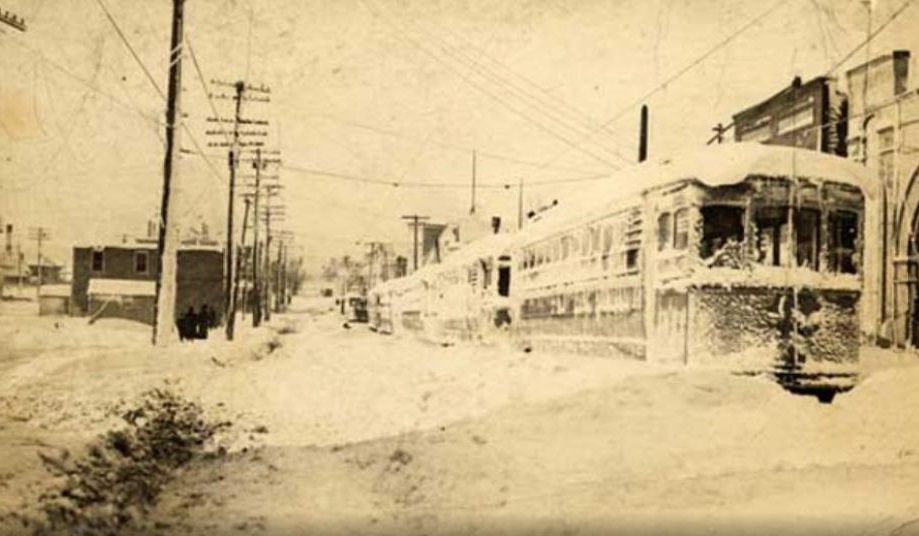
I haven’t done a weather-specific post in a while, and this week marks the 100th anniversary of the infamous Great Lakes Hurricane.. The storm lashed Ohio and other Great Lakes states for 3 days from November 9th-11th, 1913, causing widespread damage and loss of life. More than 250 died, mostly from drowning as 19 ships sank on the Great Lakes.
The storm began on the 9th as a pair of low-pressure systems collided over Michigan and the southern Lakes. Temperatures in the 50s and 60s dropped throughout the day on the 8th as the combined storm pulled a cold front across Ohio. A tight pressure gradient caused strong winds and rain turned to heavy snow. While the brunt of the storm hit the Cleveland area and adjacent lakeshore communities, the storm affected 3/4ths of Ohio, including Columbus.
A heavy rain began in Columbus on the 7th as the cold front moved through. Temperatures dropped from the mid-50s early on the 8th to the mid-30s by evening. On the 9th as temperatures dropped to and below freezing, snow began to fall, becoming occasionally heavy throughout the day. Winds of 40mph in the Columbus area combined with the snow to create blizzard conditions throughout the 9th and early into the 10th, though not nearly as severe as they were on Lake Erie. Snowfall totals were 10″-20″ across all of Eastern Ohio, and the Cleveland area had up to 2 feet. Columbus, with its 7.5″ total, got off lucky, while Cincinnati had just 1 inch.
The storm remains as the most severe early winter storm in Ohio history.
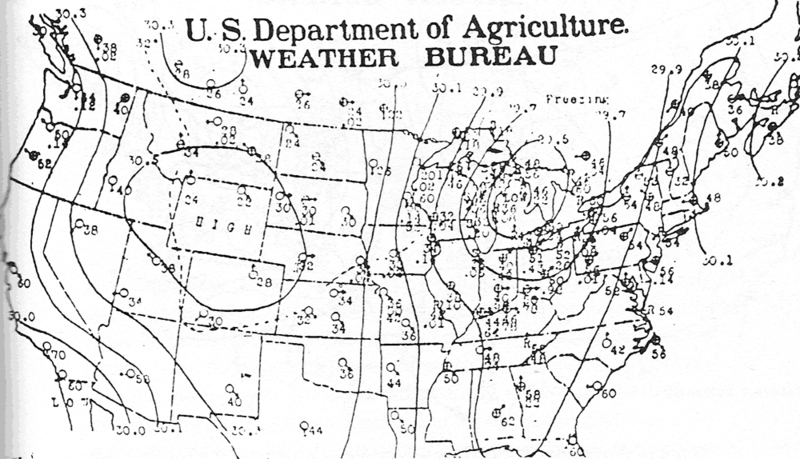
The US weather map on November 8, 1913.
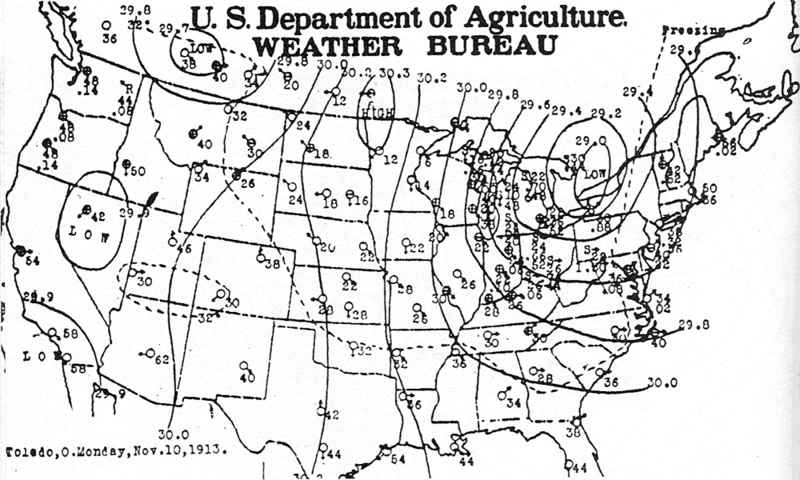
Weather map from November 10, 1913.
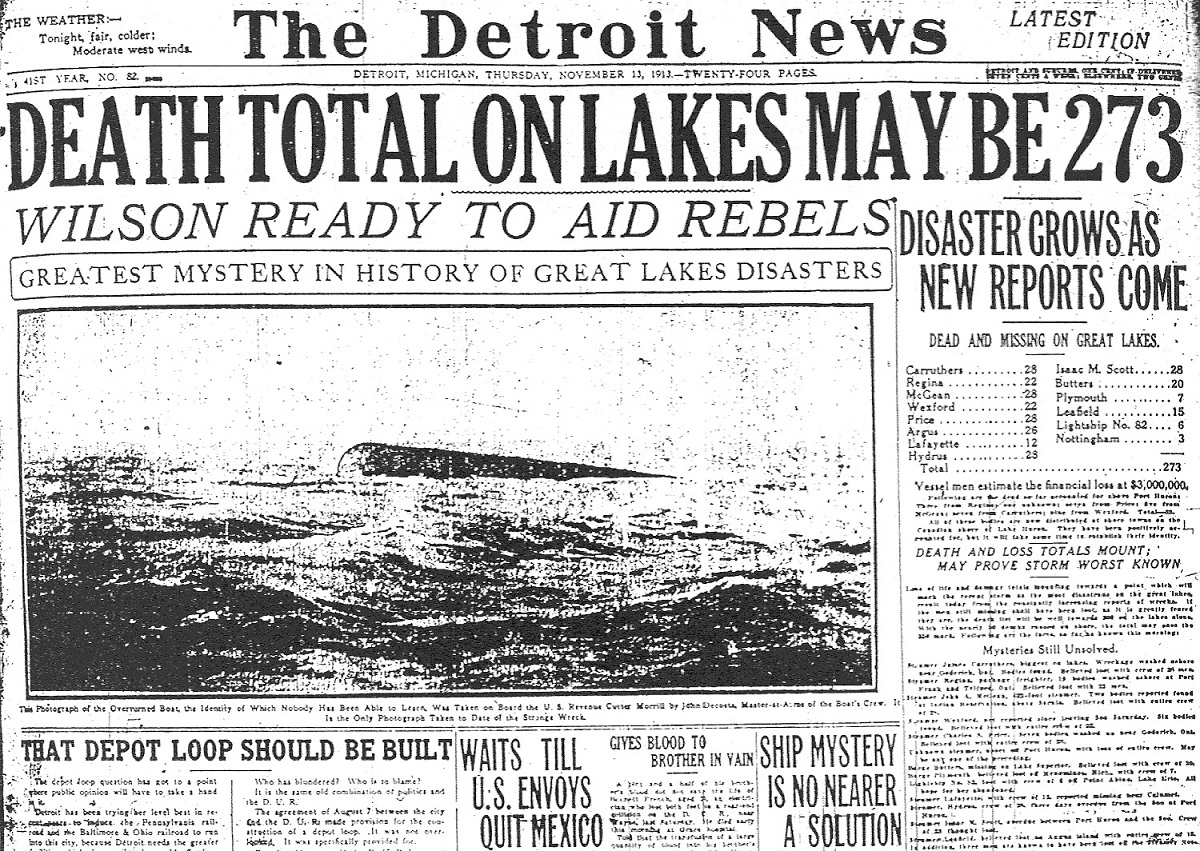
Headline from November 13, 1913.
Some Snow Totals Across Ohio
Cleveland: 22.2″
Akron: 20.0″
Bellefontaine: 8.0″
Lancaster: 8.0″
Columbus: 7.5″
Toledo: 6.5″
Circleville: 5.0″
Dayton: 3.2″
Cincinnati: 0.8″
It should be kept in mind that snow-measuring is an inexact science, and that was especially true in the early 20th Century. By all news accounts at the time, snow drifts were 3′-4′ across most of eastern Ohio, and reports of a foot or more were common for areas east of present-day Rt. 23. Most stations, however, did not report such totals. This is most likely because very strong winds blew the snow around, making it very difficult to measure accurately.
For example, at least 12″ with 4′ drifts were reported at Newark, just east of Columbus, yet official records don’t necessarily account for those reports.