Okay, so a link on Census record transcribing may not be the coolest I’ve put on this site, but it may be one of the most important. The US Census records go back all the way to the 1700s, and a lot of these records have either not been digitized at all, or only rough copies exist in many different formats. Due to age, use, insect and water damage, etc., some of these records are in danger of disappearing forever. Many others are difficult to use because of the varying formats. Because of this, transcribing them into a standardized digital form is critical. This site allows anyone from the general public to choose individual records and volunteer to transcribe them digitally. No experience necessary! The site gives basic walkthroughs and other how-to information, so anyone can do it, and at their own speed in their free time. Just click on the state and area of your choice and go from there.
July’s missed opportunity of the month is just one more entry into the list of dumb ideas, but it isn’t about something bad with the development itself. Rather, it’s instead about the unfortunately common plague of NIMBYism that festers in so many urban neighborhoods, and how it can kill good urbanism because some people have delicate sensibilities that need stroking.
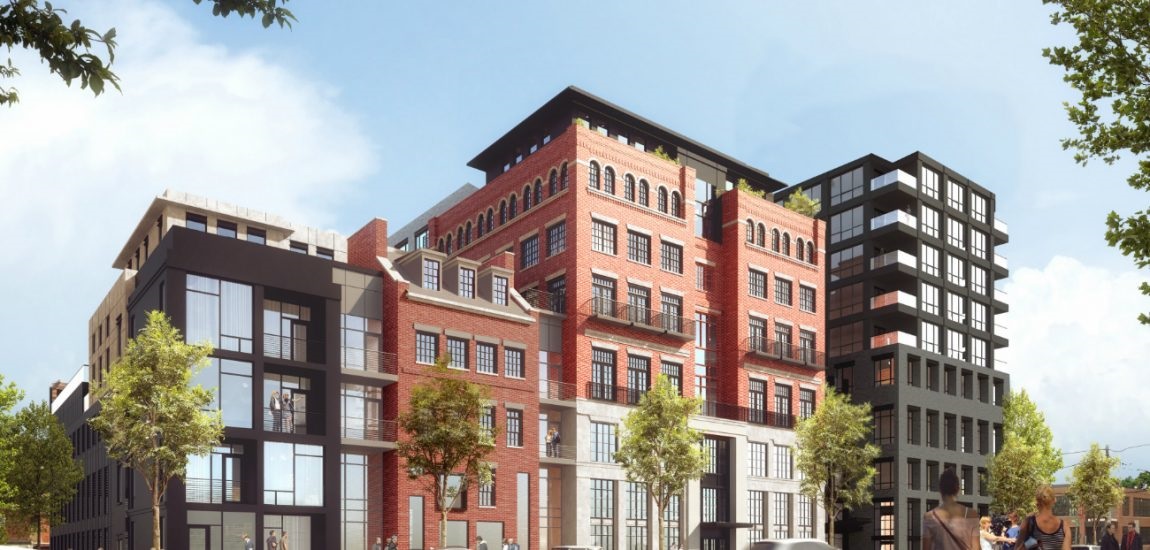
A while back, Kaufman Development proposed a 10-story, mixed-use project at 23 W. 2nd Avenue that spanned part of the block between Price and 2nd, most of which was already a vacant grass lot. The project proposed renovating the 91-year-old IBEW building and incorporating it into the overall project, which included a mix of apartments, retail and office space.
—Last rendering in July 2018.
Victorian Village, the neighborhood of which the project fell under, was of course completely apoplectic about it. After the first neighborhood commission meeting, at which commission members and neighborhood busybodies expressed deep concerns about the design and size, Kaufman went back to the drawing board. Over time, Kaufman redesigned the project more than 20 times, the height changing from 10 to 9 to 14 and then back to 10 stories, with the number of apartments, uses, scale, etc. being changed over and over again to please the fickle nearby residents. These residents (and let’s not forget commission members, which admittedly, faced a 4-4 tie in the vote because the commission was lacking its 9th member, something the City hopes to rectify in the near future) complained about traffic and that the project would “block the sun”, among other roll-of-the-eyes nonsense. It was the kind of shenanigans that even Clintonville might suggest had gone too far.
Instead of continuing to deal with unreasonable people, spending more time and money for something they couldn’t make work, Kaufman decided to walk away from the project altogether. Though they still own the property and may eventually come back to the table with another proposal, it seems unlikely to be anywhere near the scale originally proposed. The NIMBYism aside, this speaks to the disconnect between the real estate conditions in Columbus and the pushback on building new development that would actually help resolve some of the existing problems. Columbus is currently in the midst of a housing crisis. Population estimates show that the city has become one of the nation’s fastest-growing. This growth, combined with a historically-low inventory and record sales, has put a huge strain on the housing market, including pushing prices to ever-higher levels. Simply put, residential construction hasn’t been keeping pace with the influx of population into the city, and this has been the case since at least the 2009 recession. Instead of intentionally limiting developers to go smaller in prime locations- such as in the very-high-demand Short North off of High Street- development commissions across the city should be welcoming more housing. Instead, projects are being downsized or rejected by local populations left and right. Let’s look at a few reasons why commission members and some residents opposed this particular project.
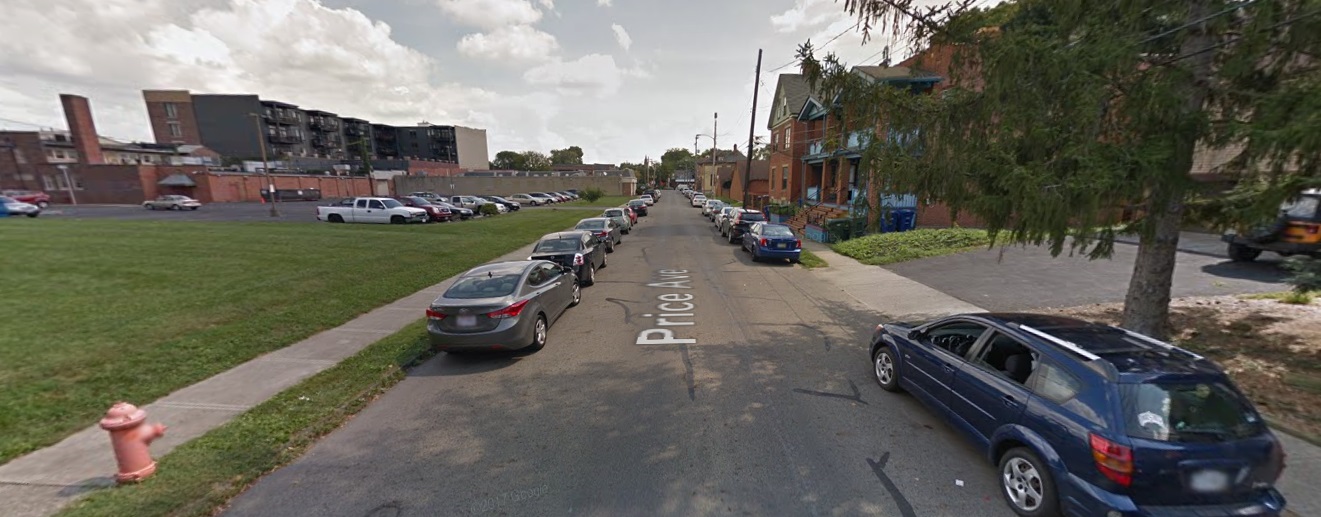
Traffic!!!! The argument that traffic would be a problem is silly and misguided for many reasons, but I’ll just review a few of them. First, the project plan provided parking in a garage for its residents and at least some for retail customers/visitors, and the extra cars driving around wouldn’t have been significant enough to make any noticeable difference in an already busy area. Second, Price Avenue was said to be too small and narrow to handle cars going in and out of the garage entrance per the project, but it’s clearly wide enough for 1-way traffic (its 1-way already) and 2 more lanes of curbside parking, so that reason seems equally bunk. And entrance/exit from the project would not have taken up many existing curb spots, and no configuration changes to the street would’ve been needed except for perhaps a very small end section of Price.
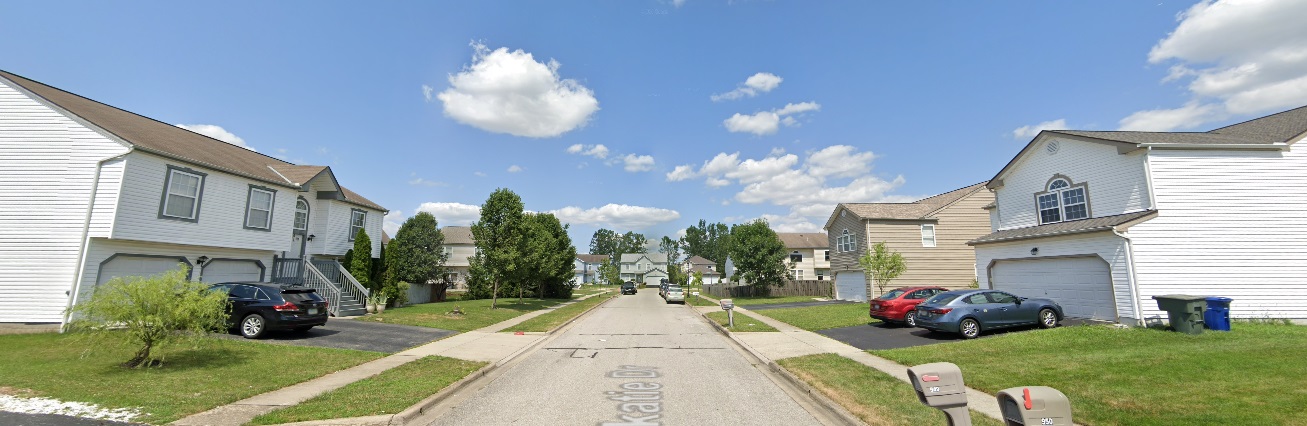
—Price Avenue looking toward High, about where the Kaufman project would’ve gone on the left.
Third, traffic and parking shouldn’t be used as a hammer to squash development, but as the catalyst to demand better transit and pedestrian options. Whether those include buses, rail, bikes, better sidewalks, etc. can be debated, but transit is an important part of the picture in urban neighborhoods, whether people like it or not. Furthermore, this area is already highly served by bus and bike, as well as car-share and Uber. The idea that people even have to drive here, or even to the Short North in general, is simply not true. Given that the Short North is highly walkable, many of the residents that would’ve lived here would’ve been less likely to use their cars for all trips, anyway, thereby further reducing the impact on local roads.
It’s Too Big for the Neighborhood!!! To this, I say, bullshit. Multiple projects just as big or larger have already been built or are under construction on both sides of High Street, including in Victorian Village, which this site falls under. To say that the Kaufman site is not appropriate is completely arbitrary, even if the site is not on High itself, but set back slightly. To the east is the High commercial corridor and to the west is an alleyway. 4 single-family homes exist to the east of the alleyway, and would’ve been the only ones really directly near the project. The complaint that there would be significant “sun blocking” is ridiculous. It wasn’t a 50-story tower, and the orientation of project meant that any sun loss would have been minimal at worst.
The Historic Character of the Neighborhood is Being Lost!!! This one comes up with virtually every single development in this particular neighborhood. Victorian Village is indeed a beautiful neighborhood with some of the city’s best-preserved historic housing. But the Kaufman project would’ve had no impact on that, whatsoever. No demolition would’ve taken place, as this particular land lost all of its historic buildings before 1980. It’s just a vacant lot now. More importantly, the proposal would’ve renovated an actual historic building, the IBEW, helping to preserve it for the future. The histrionics on preserving the neighborhood rings hollow when nothing was actually under threat.
In any case, the project is probably dead. Whatever might be proposed in its place will likely do that much less to help address the housing crisis or to keep the neighborhood progressing. It’s a shame that some people can hold entire neighborhoods hostage with outdated thinking, and how a 40-year-long vacant lot- and counting- can be preferable to the fear of change.
Columbus, as recent estimates show, is clearly becoming a real player on the national stage in terms of its rapid growth and increasing name recognition. There’s a lot to be proud of for a city located in what many people think is just the Rust Belt. But as with every city, Columbus doesn’t get it all right all the time. A while back, I wrote how Columbus could sometimes be a city of missed opportunities when it came to development, and that remains true. For every great project in the Short North, there’s an equally terrible development going up somewhere else. In what I want to be a semi-regular series, I’m going to highlight some projects that simply miss the boat in terms of good urban development. Some are merely not reaching their potential, and then some, like June’s missed opportunity of the month, is an out of left field example that seems to be trying so hard, only to fail equally so.
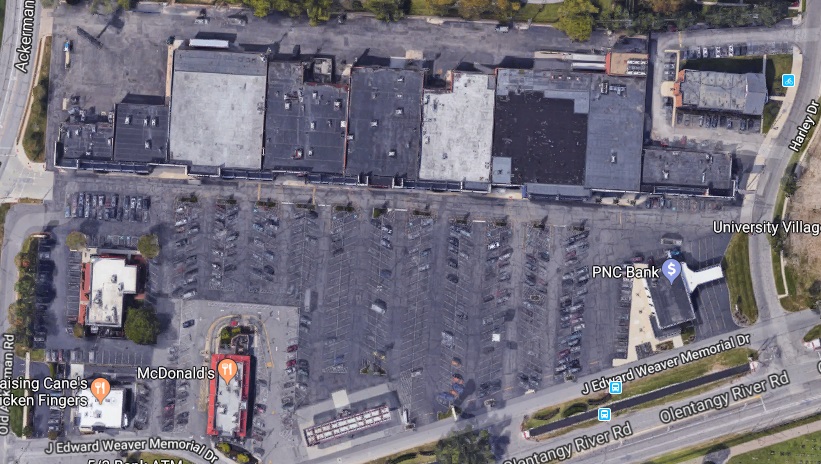
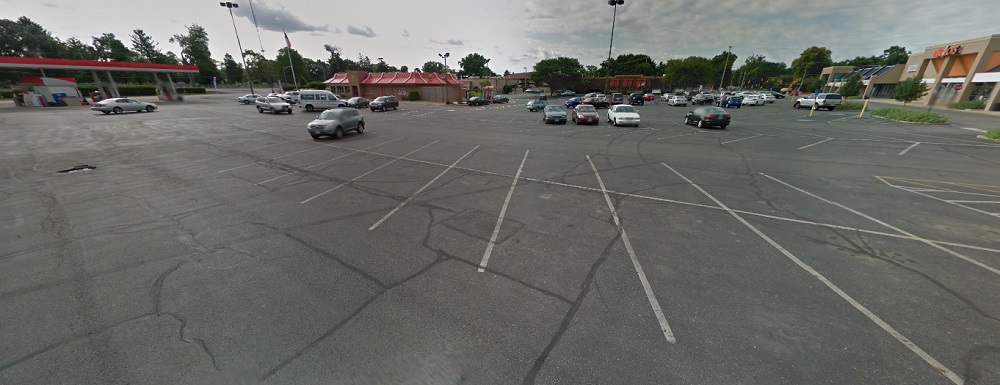
That project is the redevelopment of the University City strip mall off of Olentangy River Road.
Aerial photo.
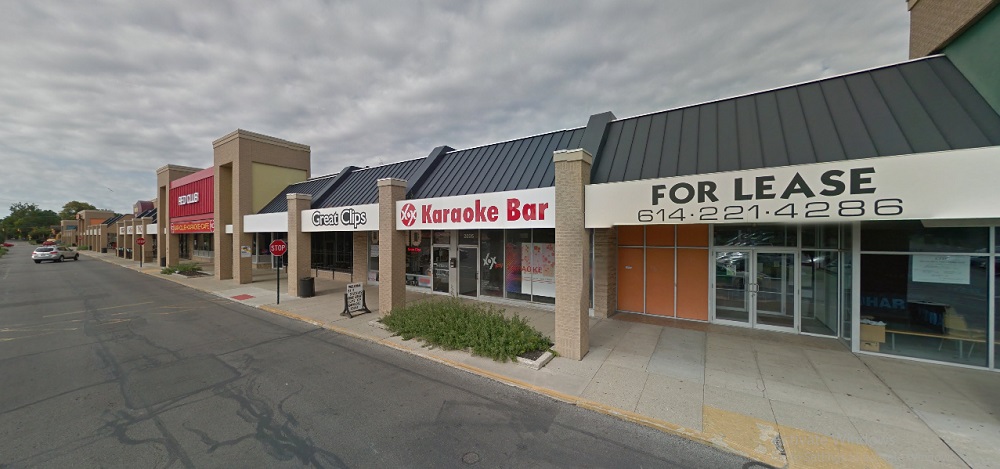
As you can see from the aerial, the site is your typical strip mall. Built in 1961 when such developments were seen as community shopping destinations rather than the dying suburban sprawl they have become, University City is completely nondescript and looks no different than hundreds of others dotting the landscape. Anchored by a Kroger, the strip mall held other stereotypical establishments- a salon, bars, a Chinese restaurant, etc. A handful of out lots contain a McDonald’s, gas station and a bank.
Most of the site, of course, is taken up by enormous amounts of surface parking, most of which sits empty more often than not.
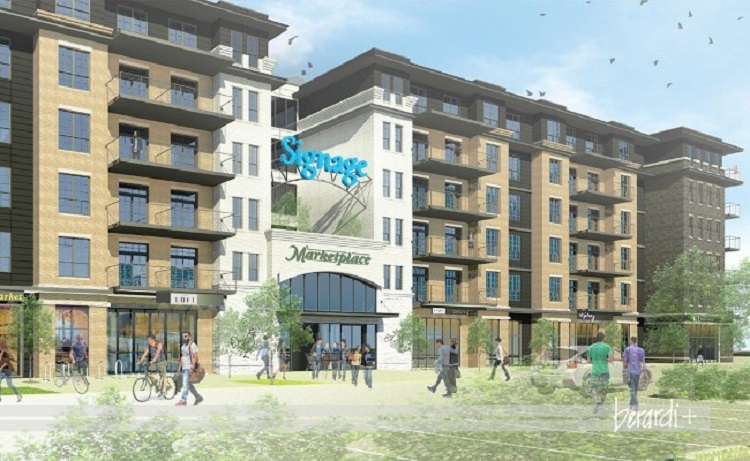
Olentangy River Road is not exactly an urban street. Most of it is lined with hotels, restaurants and offices, all set well back from the road and in a generally unfavorable configuration to encourage walkability. So when it was announced in June of last year that the strip mall would be redeveloped, hope for something substantially different seemed possible. The initial renderings showed a 6-story mixed-use building on the site instead of the strip mall.
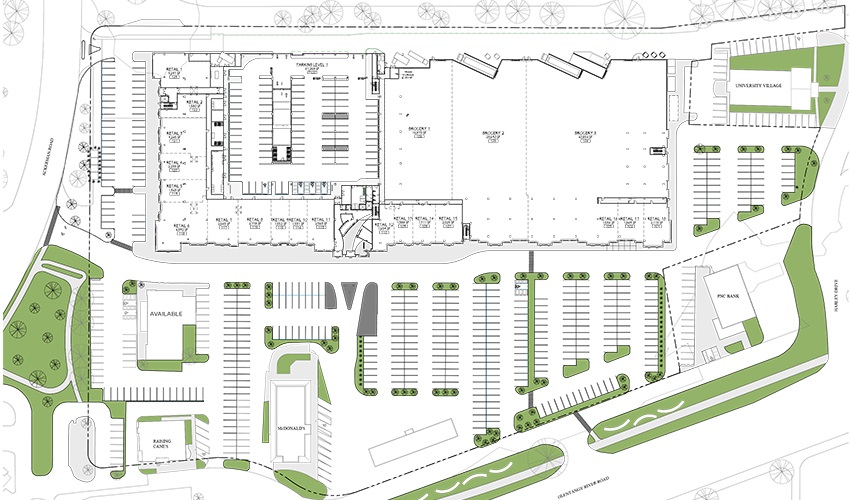
MUCH better, right? Of course, saying it’s much better is a low bar compared to the current situation, but a 6-story, mixed-use project is truly urban, and one of the first of its kind on Olentangy River Road. So why, one might ask, is this a missed opportunity? To answer that, we have to look at the proposed layout of the entire site.
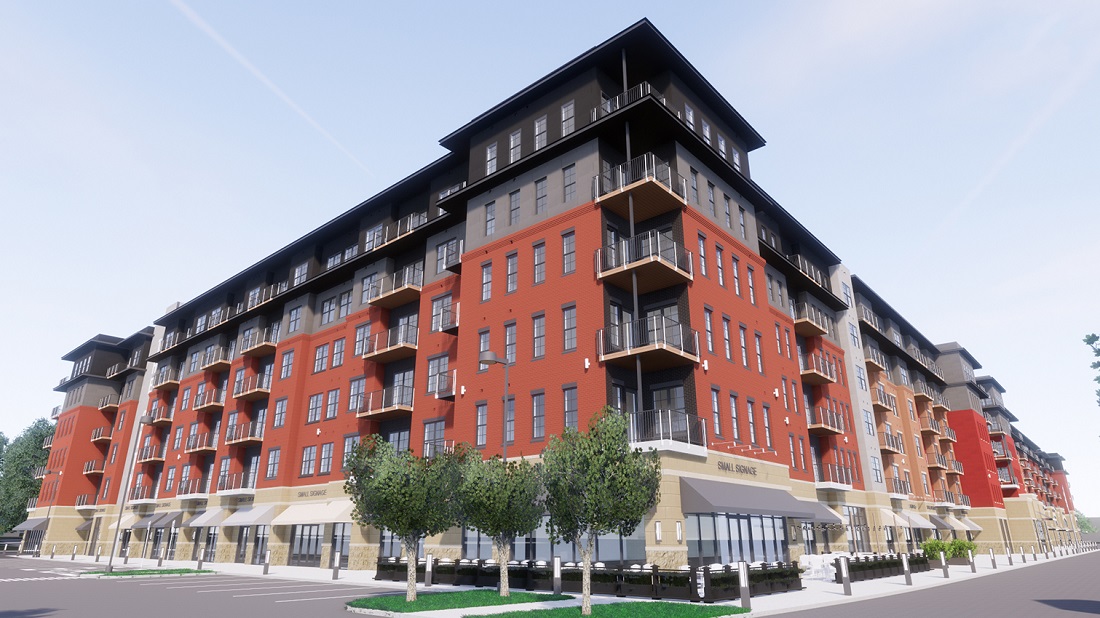
Comparing the proposed layout to the current one is a little confusing, because they look extremely similar. It seems that the 6-story project will only replace the current strip center, but most of the parking and all of the out lots will remain intact. It’s a Frankenstein’s monster of suburban and urban elements that just looks really weird. There is no interaction with any of the nearby roads, and not even a resident pathway from the main building to the multi-use path that was built a few years ago along Olentangy. It’s all still catering to cars. In the most recent rendering of the main building, seen below, there appears to be only 1 patio space for what is clearly a very large project. The view for customers from there, of course, is still just the parking lot, with its noise, pollution and lack of any shade. In fact that’s basically the view out of every window in the building- parking lots.
I suppose that some surface lots and outbuildings could eventually be redeveloped at some point, but as it stands now, there’s a lot to be desired. The main building is decent, but the overall layout and connections are terrible and it makes the whole project just look like a much larger version of the strip mall that’s already there. Maybe that’s a harsh assessment, but I don’t think it’s an unfair one. Casto, the developer, basically invented the strip mall, so they’re clearly playing to their strengths here. They’ve done some really good projects at times, like the renovation of the Julian building on South Front Street in Downtown, and I applaud the effort to go more urban in this location, but I think so much could’ve been done better in this case. No doubt that this development will have no trouble finding tenants to rent the apartments, just due to the lack of housing anywhere in the core, but I question just what this development offers that better ones don’t.
In the end, it is a good example of how Columbus needs more true urban developers that are comfortable and willing to push the envelope on this style of development. Trying to have it both ways, where suburbia reigns in an urban location, gets us nowhere.
So once again, 2017 Ohio city population estimates came out today from the Census. As has been the case for a long time now, Columbus is rocketing upward at record pace. The 2016 comparison numbers have been adjusted by the Census for the 2017 update.
Some milestones include Grove City and Lancaster passing 40,000 for the first time and Johnstown passing the 5,000 mark. 11 places lost population, 8 stayed the same and 83 gained population. The growing portions of the Columbus metro continue to encompass the vast majority of incorporated places.
Nationally, here were the top 20 fastest-growing cities by numerical change between July 1, 2016 and July 1, 2017 1. San Antonio, Texas: +24,208 2. Phoenix, Arizona: 24,036 3. Dallas, Texas: +18,935 4. Fort Worth, Texas: +18,664 5. Los Angeles: 18,643 6. Seattle, Washington: +17,490 7. Charlotte, North Carolina: +15,551 8. Columbus: +15,429 9. Frisco, Texas: +13,470 10. Atlanta, Georgia: +13,323 11. San Diego, California: +12,834 12. Austin, Texas: +12,515 13. Jacksonville, Florida: +11,169 14. Irvine, California: +11,068 15. Henderson, Nevada: +10,534 16. Las Vegas, Nevada: 9,966 17. Denver, Colorado: 9,844 18. Washington, DC: 9,636 19. Tampa, Florida: 9,383 20. Mesa, Arizona: 9,025
Now that we have the full set of 2017 population estimates, I wanted to examine a popular claim a little more closely. The claim is that suburban growth far exceeds that of core cities/counties, and it’s often repeated in media throughout the country. One of the things that always bothered me about this was the constant use of basing this claim largely on % change. This has a major flaw, one that I will go into more below.
For this little study on suburban vs urban growth, I will look at the top 50 largest metro areas.
First, let’s look at the total change in the whole metro area, the core county and the core city between the 2010 Census and July 1, 2017. They will be ranked here by total metro change. 1. Dallas, TX: +973,431 2. Houston, TX: +971,941 3. New York, NY: +754,396 4. Atlanta, GA: +597,993 5. Miami, FL: +592,525 6. Washington, DC: +580,228 7. Phoenix, AZ: +544,141 8. Los Angeles, CA: +524,946 9. Seattle, WA: +427,240 10. Austin, TX: +399,507 11. San Francisco, Ca: +391,784 12. Orlando, FL: +375,432 13. Riverside, CA: +355,705 14. Denver, CO: +344,635 15. San Antonio, TX: +331,458 16. Charlotte, NC: +308,313 17. Tampa, FL: +307,930 18. Boston, MA: +283,935 19. Las Vegas, NV: +252,810 20. Minneapolis, MN: +251,760 21. San Diego, CA: +242,343 22. Nashville, TN: +232,162 23. Portland, OR: +227,167 24. Raleigh, NC: +204,590 25. Columbus: +176,724 26. Sacramento, CA: +175,740 27. San Jose, CA: +161,523 28. Jacksonville, FL: +159,382 29. Indianapolis, IN: +140,524 30. Oklahoma City, OK: +130,746 31. Philadelphia, PA: +130,427 32. Kansas City, MO: +119,574 33. Salt Lake City, UT: +115,297 34. Baltimore, MD: +97,572 35. Richmond, VA: +86,117 36. New Orleans, LA: +85,903 37. Chicago: +71,499 38. Cincinnati: +64,396 39. Louisville, KY: +58,247 40. Virginia Beach, VA: +48,429 41. Memphis, TN: +23,433 42. Birmingham, AL: +21,751 43. Milwaukee, WI: +20,282 44. Providence, RI: +19,912 45. St. Louis, MO: +19,575 46. Detroit: +16,685 47. Buffalo, NY: +1,239 48. Hartford, CT: -2,139 49. Cleveland: -18,427 50. Pittsburgh, PA: -22,924
Now that we have the total growth, let’s break it down a bit more.
How much of the total metro change occurred in the core county of each metro? This will be ranked by the highest to lowest % occurring in the core county.
*New York includes all 5 main boroughs, so it is different than core county, but still represents the urban center of the metro area. **Core County and City are consolidated, or city exists as separate entity.
Going down even further, let’s compare the core city to the total metro, again ranked by %.
*Again, I used the 5 boroughs of New York here, so the numbers don’t change. **See above.
Finally, because core counties and cities can be absolutely huge, like in Phoenix, I wanted to take see the ratio of people moving vs. the area size. To do this, I divided the growth by the land area of each core county and city.
So basically, how many people moved there per each square mile.
So what’s all this mean? Columbus performs particularly well here. Franklin County attracts a high percentage of the total metro population, and Columbus itself is one of only 5 cities with more than 50% of the metro growth entering the city limits. Even accounting for area size, Columbus does fairly well. This suggests that urban growth there is stronger than in most cities.