The 2024 housing market in Columbus was largely one that continued trends of the past several years- generally increasing prices, a shortage of inventory and a quick sales turnaround.
We’ll start this look back by reviewing how the overall metro area and individual county housing markets performed. Total 2024 Home Sales in the Metro Area: 24526
2024 Home Sales % Change in the Metro Area: +3.07%
2024 Metro Area Median Sales Price: $335,555
2024 Metro Area Median Sales Price % Change: +5.34%
Both home sales and median sales prices were up in the overall metro area.
Now let’s look at individual sub-markets within the metro.
First, overall sales.
Next up, here is the median sales price data.
And finally, here are the charts for the fastest and slowest-selling markets in 2024.
If you don’t see data for the market you are looking for, vist the Housing Reports page of the Columbus Realtors site.
A view of permitted residential units in Ohio going back to 1980.
With the Housing Data App, users can access different types of housing data for the state, metro, county and city levels going back to 1980. The housing data comparison can be viewed view residential units permitted, total buildings permitted or overall property values. The data can also be view in total and per-capita. Additionally, if you prefer, you can compare different cities or counties or states and see how their performance compares over time.
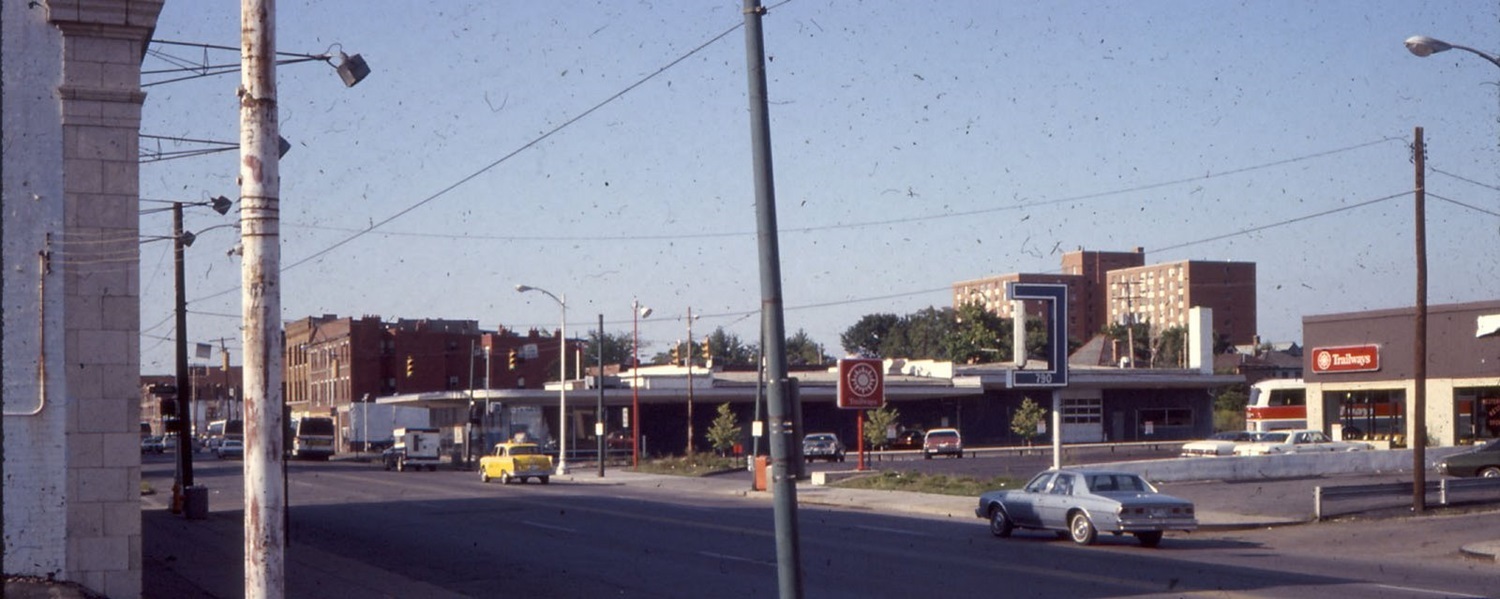
For today’s Random Columbus Photo 12, we don’t go back too far in history, but the before and after are definitely one of the more dramatic comparisons featured so far. Larger versions of both photos are available if you click on them.
Before: N. High Street at Hubbard Avenue looking northeast, around 1980. The Short North by the 1970s was considered a declined neighborhood with significant crime and prostitution problems. Police were called there often, and history tells that it was the police themselves who coined the name of the neighborhood, since it was an area that was just “short of Downtown”. In the photo, you can see buildings at 790 N. High and beyond. At the time, they were a Trailways bus station and some kind of office building. Trailways was eventually replaced by other businesses and restaurants over the years, the last being the restaurant Haiku until it was all demolished for the current hotel building.
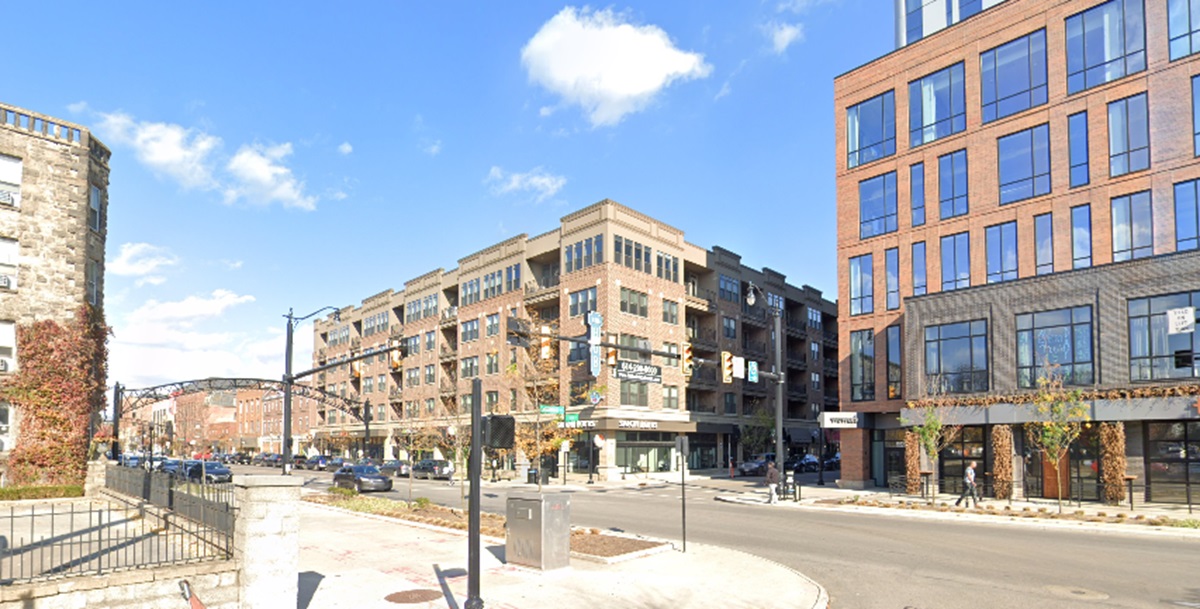
After: The same view in 2024. The picture from 2024 shows a drastically transformed neighborhood. After more than 40 years of renovations, revitalization and construction, the Short North has shed it’s drab and shady past. Crime stubbornly persists despite the improvements, but not nearly to the same degree. The taller apartment building in the older photo was torn down in the 1990s.
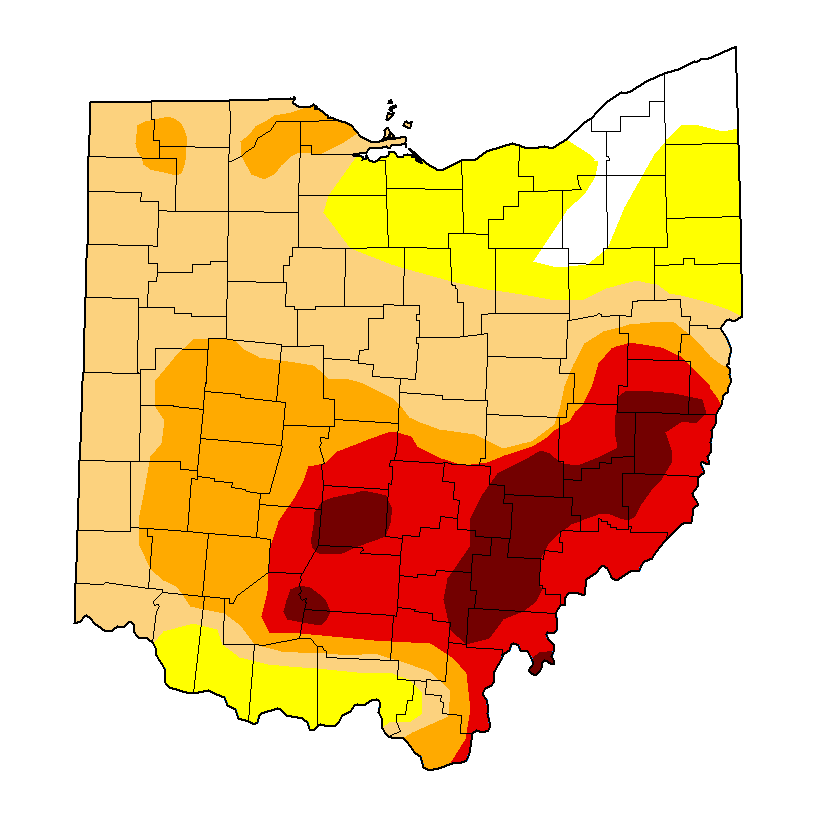
The Columbus area saw very little rain over the summer, and that trend has continued this September. This severe drought is affecting other parts of the state as well. How does the current dry period compare to the worst Columbus droughts historically, though?
2024’s longest period without measurable precipitation was 17 days, from 6/6/2024 to 6/22/2024.
However, having no precipitation at all for a significant period of time is relatively rare, and the formation of a drought usually occurs just because of low precipitation, not just no precipitation. And that’s certainly the case for 2024.
Top 10 Longest Periods with the Most Consecutive Days with 0.1″ or Less 1. 9/13/1963-10/30/1963: 48 2. 10/26/1904-12/9/1904: 45 3. 9/30/1924-11/12/1924: 44 4. 2/9/1969-3/23/1969: 43 5. 8/18/1908-9/27/1908, 6/12/1936-7/22/1936: 41 6. 10/1/1887-11/9/1887: 40 7. 7/17/1910-8/24/1910, 8/19/2024-9/26/2024: 39 8. 12/3/1955-1/9/1956: 38 9. 1/6/1944-2/10/1944, 9/29/1944-11/3/1944: 36 10. 12/14/1985-1/16/1986: 34
2024 produced the 9th longest period where daily rainfall failed to surpass 0.1″ for 39 consecutive days. Only 2 days during that period saw any measurable rainfall whatsoever.
The Summer of 2024 produced the 3rd lowest precipitation amount since reliable records began in 1879, with only the Dust Bowl years of 1930 and 1933 having slightly less. The 5.07″ that fell between June and August is extremely low. June’s precipitation was 6th lowest, July’s was a bit better at 16th lowest, and August’s was better still at 29th lowest. No month, though, saw 2″ or more, and the summer precipitation deficit was 7.68″ below normal, or less than 40% of normal. September is starting off dry as well. It’s already more than an inch below normal through the 11th, and there hasn’t been a single day with 0.1″ or more since August 18th. The forecast doesn’t show much hope, either. No rain- not even a small chance of it- is currently predicted through September 18th. If this pattern continues long enough, reservoirs may become dangerously low.
For Franklin County specifically, as of September 10th, 100% of the county is in the classification of Severe Drought, and 66.4% is classified as being in Extreme Drought.
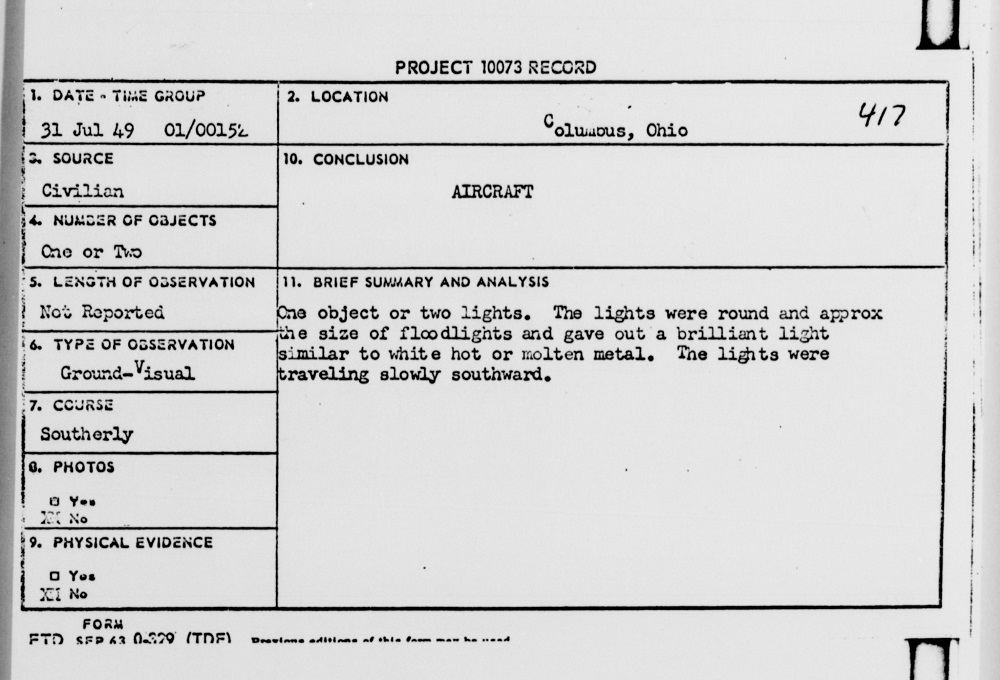
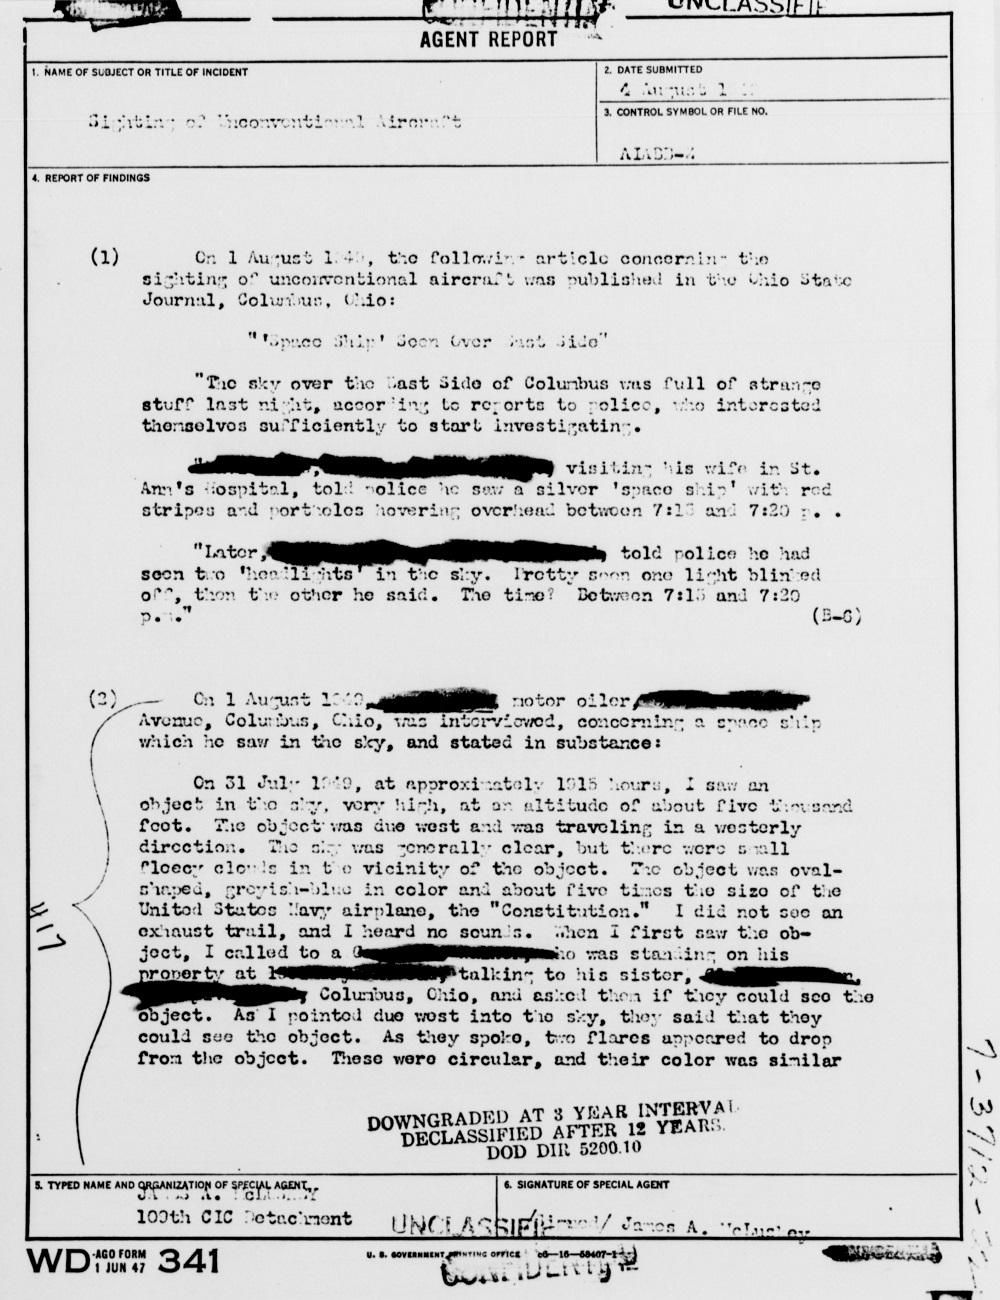
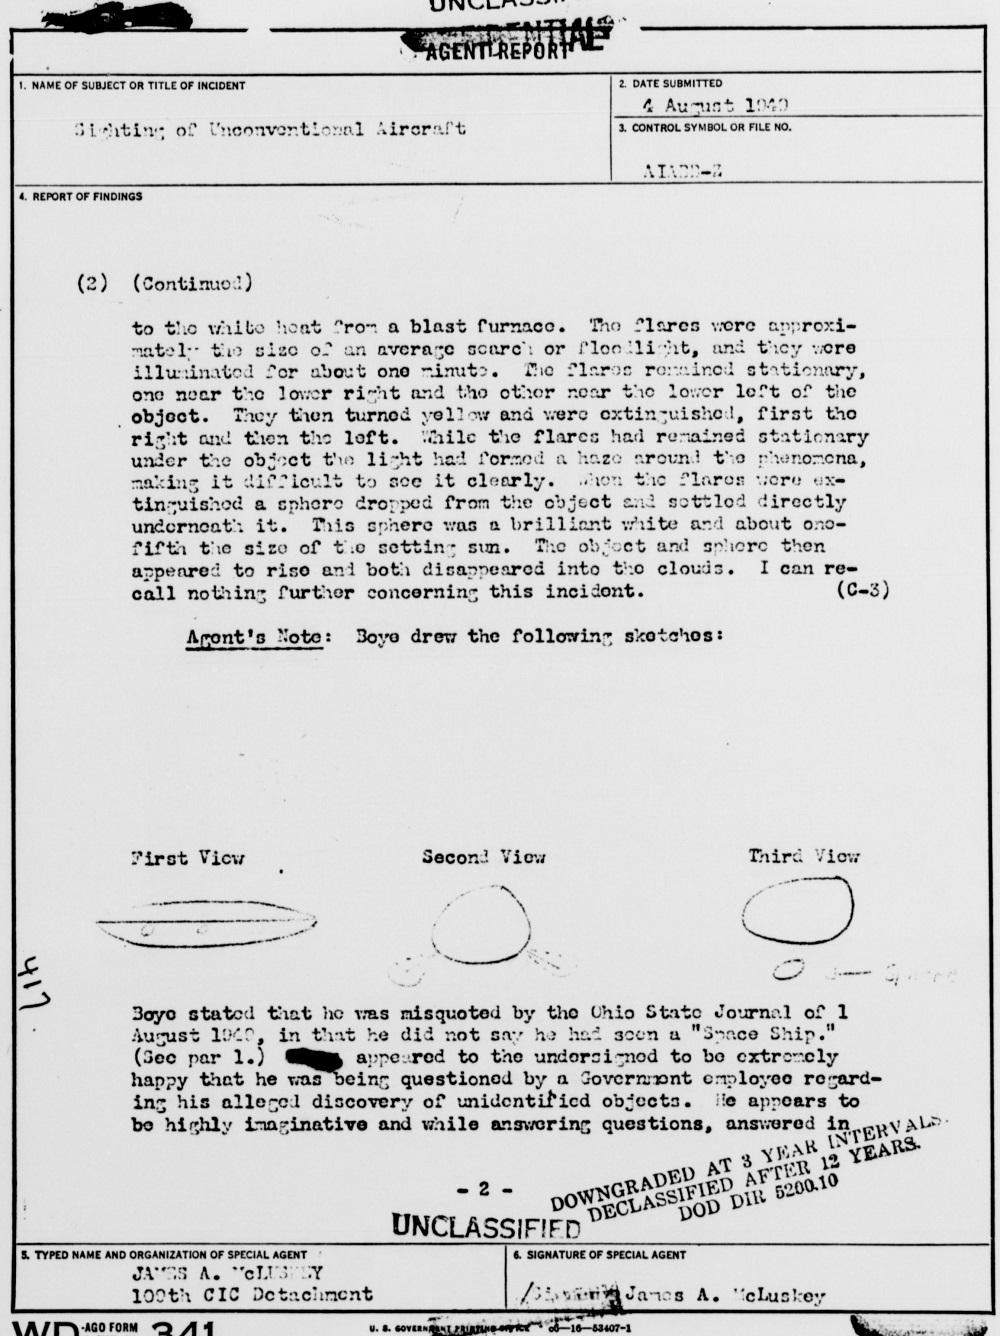
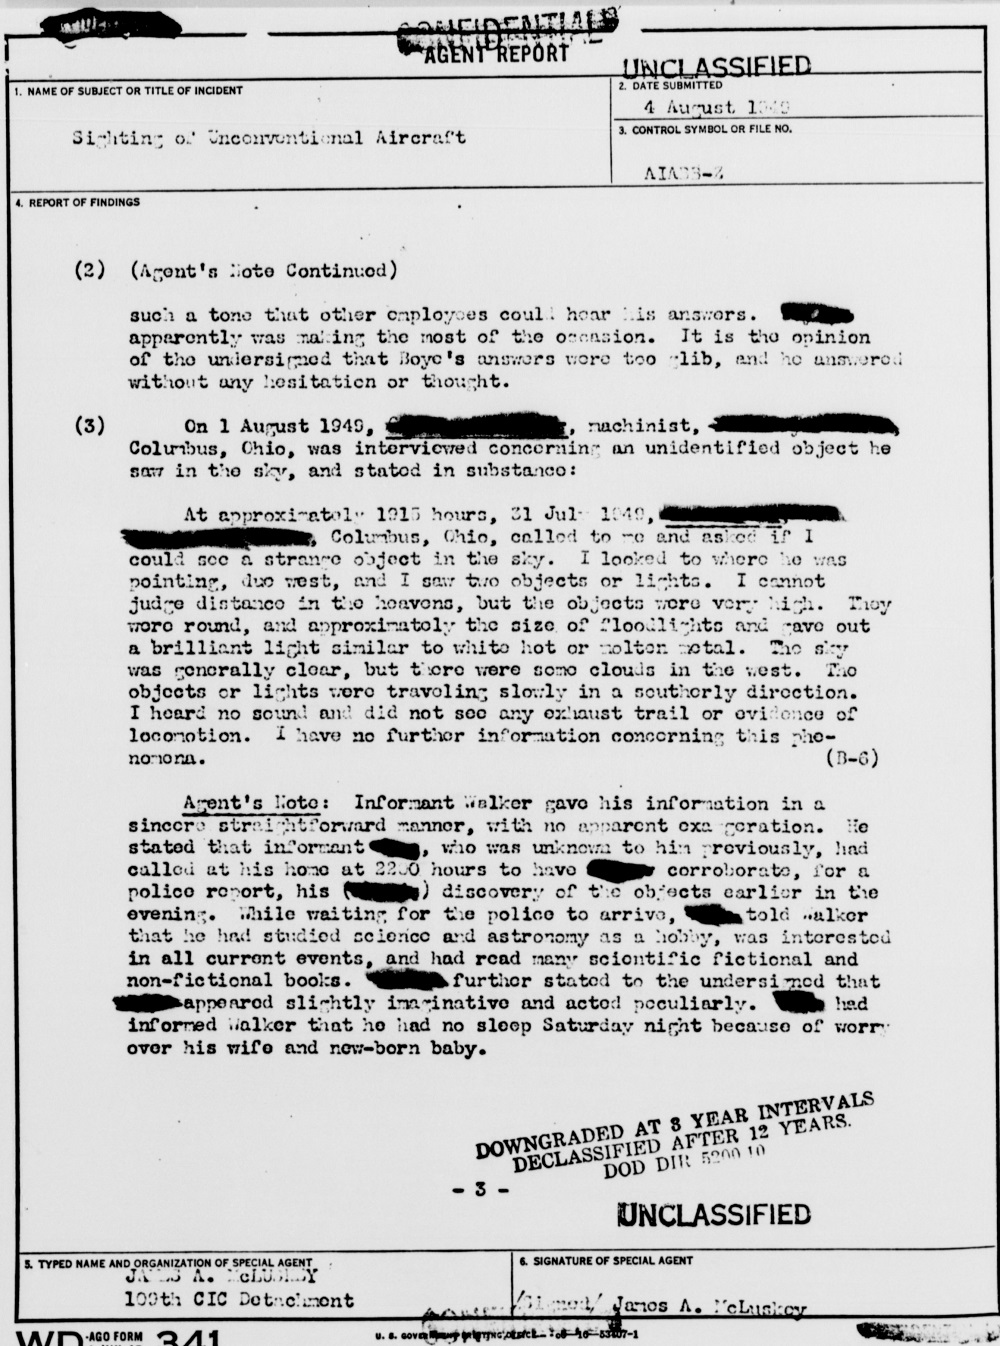
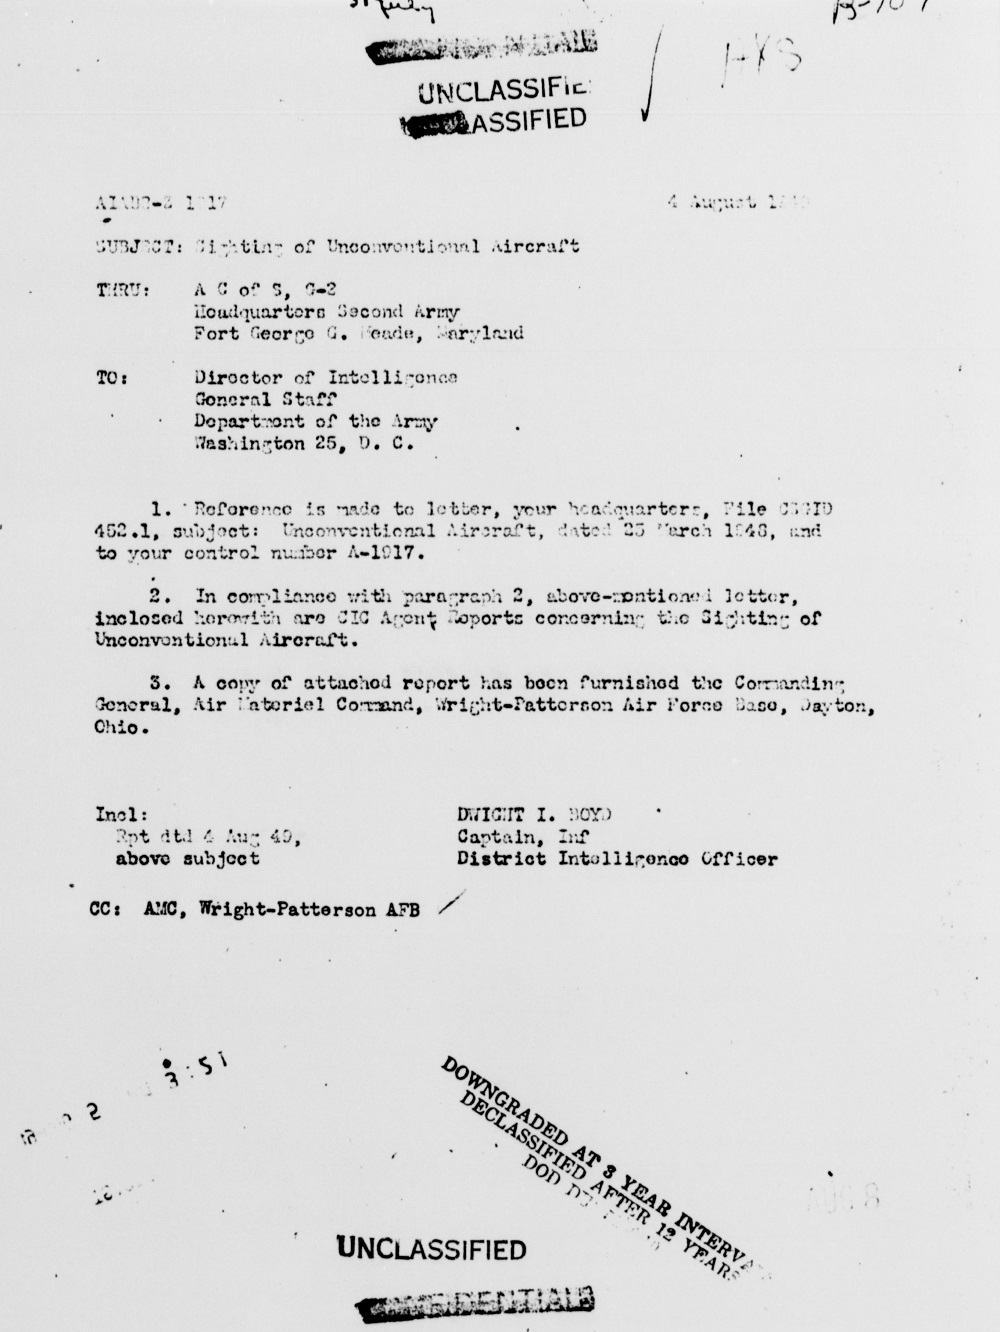
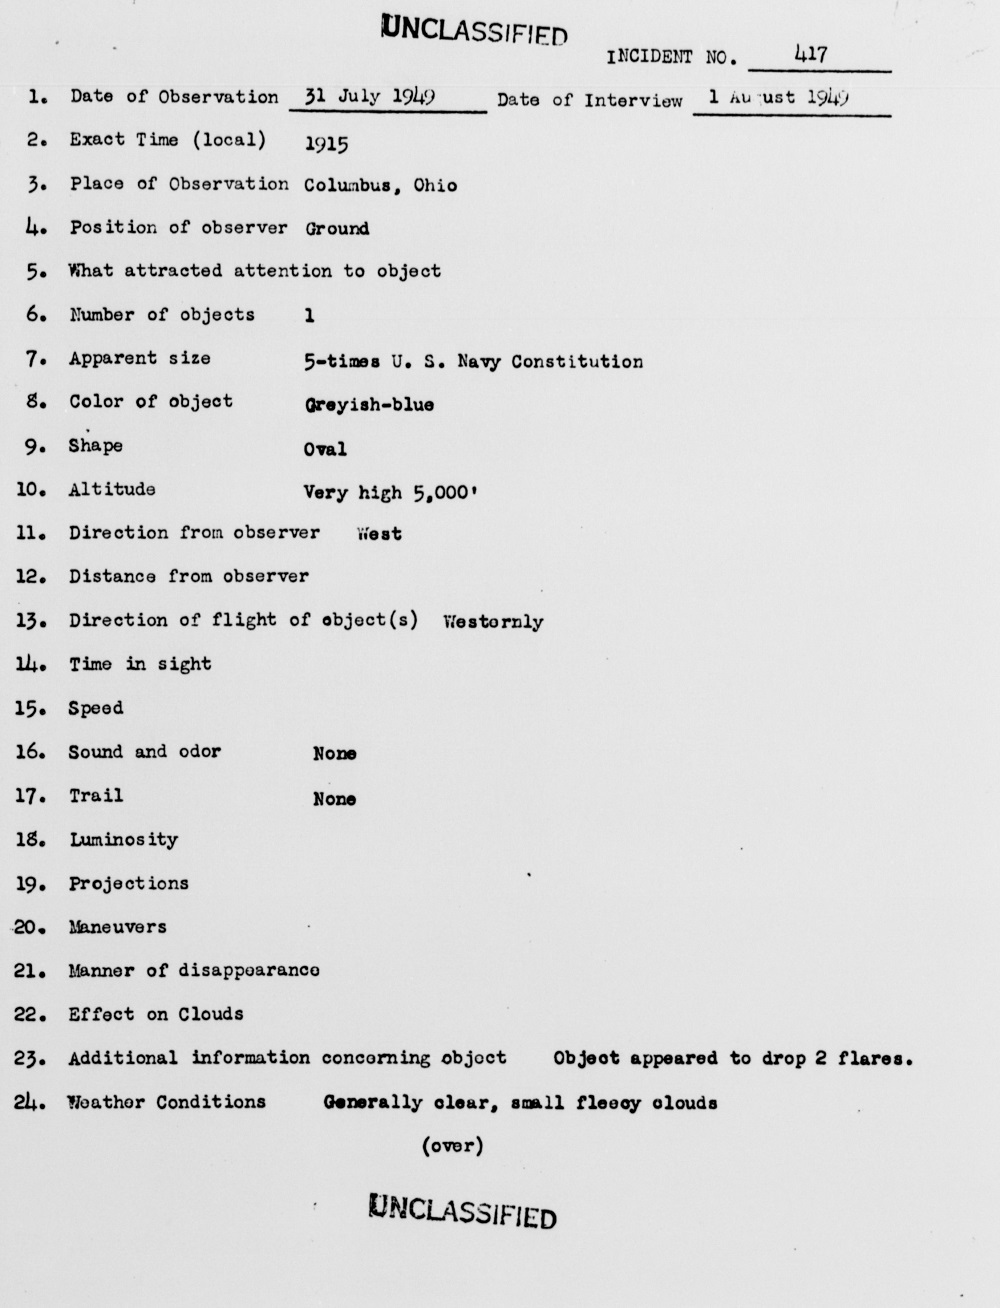
From the files of Project Blue Book, this event had quite a few witnesses, particularly on the East Side of Columbus. The witnesses included local police, and the object was described as “unconventional aircraft”. It was reported by at least two media outlets at the time. Despite the witness accounts, the report concluded it was merely a conventional aircraft.
To view more incidents around the world, visit this link. UFO Database