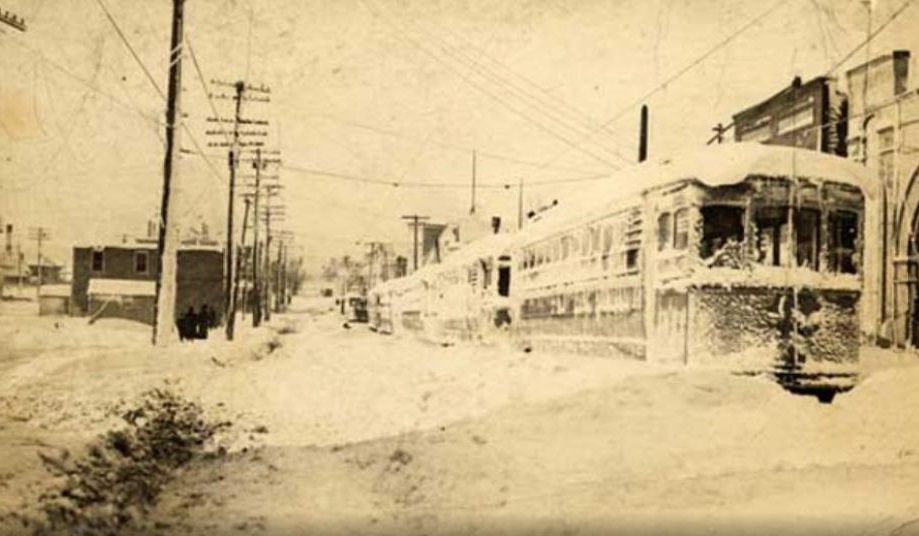
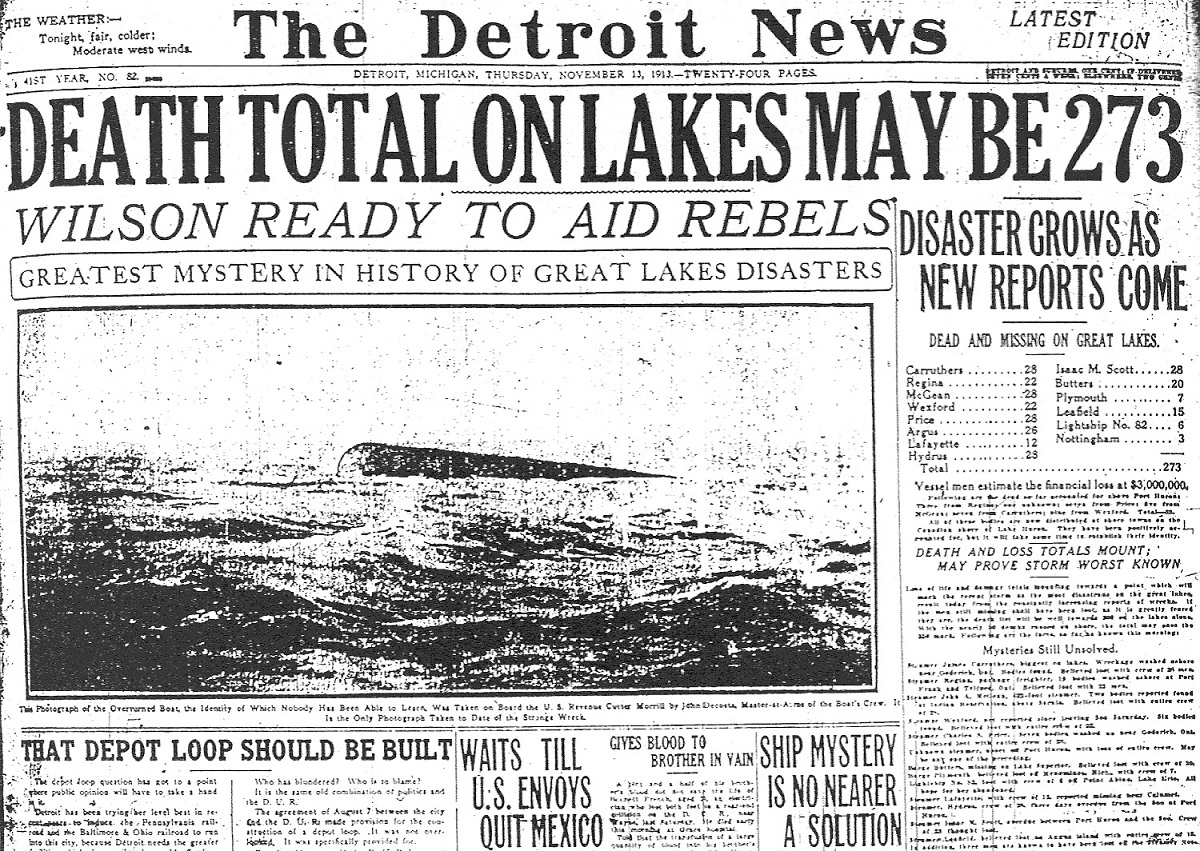
I haven’t done a weather-specific post in a while, and this week marks the 100th anniversary of the infamous Great Lakes Hurricane.. The storm lashed Ohio and other Great Lakes states for 3 days from November 9th-11th, 1913, causing widespread damage and loss of life. More than 250 died, mostly from drowning as 19 ships sank on the Great Lakes.
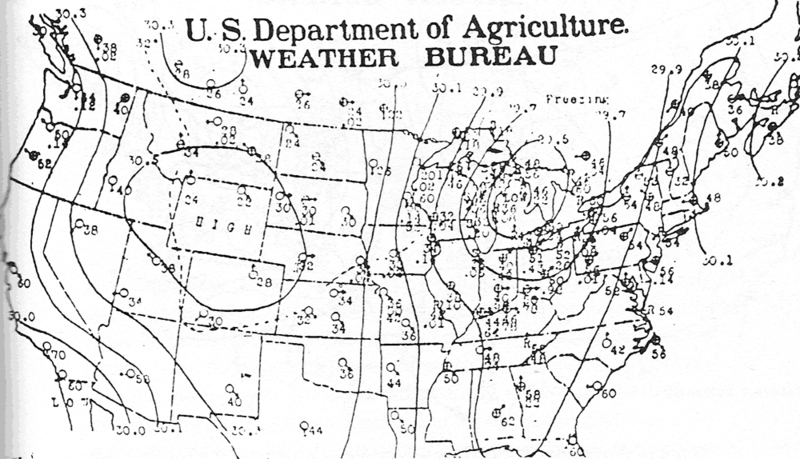
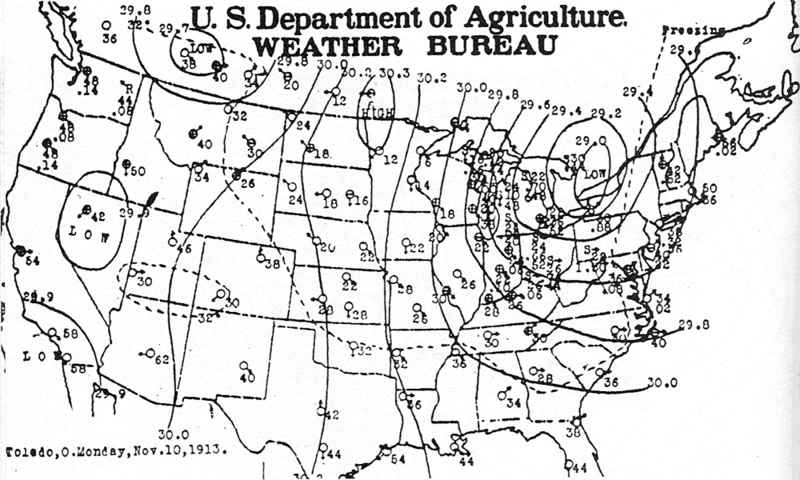
The storm began on the 9th as a pair of low-pressure systems collided over Michigan and the southern Lakes. Temperatures in the 50s and 60s dropped throughout the day on the 8th as the combined storm pulled a cold front across Ohio. A tight pressure gradient caused strong winds and rain turned to heavy snow. While the brunt of the storm hit the Cleveland area and adjacent lakeshore communities, the storm affected 3/4ths of Ohio, including Columbus.
A heavy rain began in Columbus on the 7th as the cold front moved through. Temperatures dropped from the mid-50s early on the 8th to the mid-30s by evening. On the 9th as temperatures dropped to and below freezing, snow began to fall, becoming occasionally heavy throughout the day. Winds of 40mph in the Columbus area combined with the snow to create blizzard conditions throughout the 9th and early into the 10th, though not nearly as severe as they were on Lake Erie. Snowfall totals were 10″-20″ across all of Eastern Ohio, and the Cleveland area had up to 2 feet. Columbus, with its 7.5″ total, got off lucky, while Cincinnati had just 1 inch.
The storm remains as the most severe early winter storm in Ohio history.
It should be kept in mind that snow-measuring is an inexact science, and that was especially true in the early 20th Century. By all news accounts at the time, snow drifts were 3′-4′ across most of eastern Ohio, and reports of a foot or more were common for areas east of present-day Rt. 23. Most stations, however, did not report such totals. This is most likely because very strong winds blew the snow around, making it very difficult to measure accurately. For example, at least 12″ with 4′ drifts were reported at Newark, just east of Columbus, yet official records don’t necessarily account for those reports.
Ohio’s most infamous July 4th weather event, occurred in 1969. Severe thunderstorms developed over southeastern Michigan and moved southeastward into the Ohio lakeshore communities around 7:30PM on July 4th. Every lakeshore community from Toledo to Cleveland was affected, as well as areas further inland. The storms continuously trained over the same areas from Lucas to Wayne counties for several hours, dropping torrential rains, tornadoes, high winds, hail and lightning. Rainfall in a 100-mile stretch from just southeast of Toledo into Wayne County totaled 6″-14″. These rains caused record local flooding. All told, the storms of July 4th-5th, 1969 caused $65 million in damage, damaged or destroyed 10,000 homes, 7,000 cars, 104 businesses, 300 mobile homes and more than 700 boats. 41 people were killed and 559 were injured, mostly from flooding. This was the 3rd most damaging flood in Ohio history, behind January 1959 and March 1913. Columbus was too far south to see any of the storms and received just 0.03″ of rain for the period.
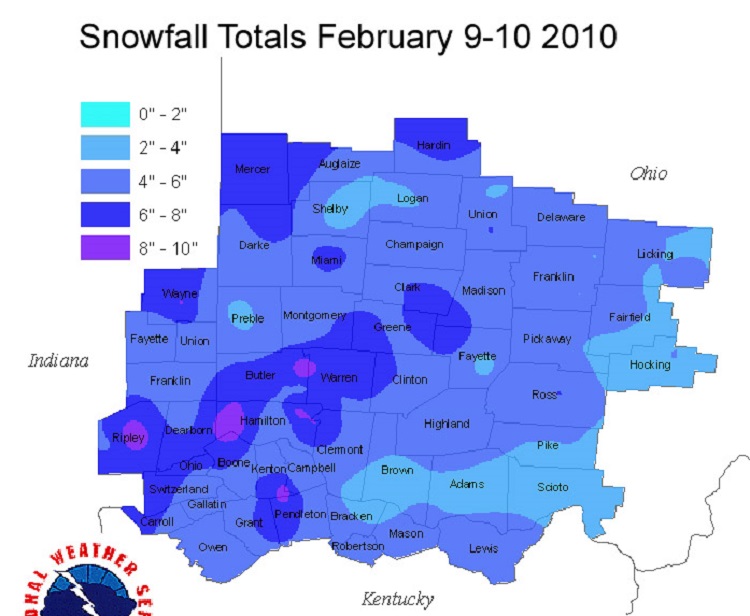
February 2010’s second snowstorm came just 3 days after the month’s first major event. This second low pressure system tracked from Louisville, Kentucky and then up along I-71 to Cleveland. Even though the track was through the heart of the state, the majority of the precipitation in most areas was snowfall. This storm followed so closely on the heels of the February 5th storm that the cold air that first storm had pulled into Ohio was still in place on the 9th. This allowed for snow despite the far north track. While the February 9-10, 2010 snowstorm wasn’t the largest of the month, it helped establish it as one of the snowiest winter months in history.
Snow began in Columbus in the early morning hours of the 9th and continued into the 10th. Snowfall rates reached their peak in the late morning hours of the 9th, falling at 1/2″ per hour at times, but never quite reached the intensities of Storm #1. While some parts of the state had 7-8″, the Columbus area had 5-6″, about half of what it got in Storm #1. Still, cleanup from the first storm was still ongoing, and this latest snowfall severely complicated the process. Traffic and airport delays were common, and many schools were cancelled. Snow depths in Franklin County reached 10-16″ after the storm.
The winter of 2009-2010 will go down as one of the best ever (if you like winter, that is). The biggest reason for that is February 2010 and its cascade of significant winter storms that placed the month as one of the snowiest of all time. The February 5-6, 2010 snowstorm event was one of the capping events of the month and winter as a whole.
The first event started in the morning on February 5th. Forecasts in the days leading up to this event were mixed. Models were showing a lot of precipitation, but also a strong push of upper-level warm air into Ohio. How far north this warm layer reached was the point of contention. In most years, the WTOD, or the “Warm Tongue of Death” as some Ohio weather enthusiasts like to refer to it, is a constant threat each and every winter. When a storm is moving north or northeast south of the state, they tend to pull warm air north, and the Appalachian Mountains act like a funnel directing this warm air straight into Ohio. During winter events, it presents itself as a layer of warm air above the surface, often turning snow to ice, sleet or just plain rain, even if the surface itself is relatively cold. It’s a constant source of frustration for winter weather lovers. It was this phenomenon that was predicted to strike again and the dividing line, as it so often is, was predicted to be along I-70/I-71. North of there, mostly or all snow was predicted, while south was more mix, ice and rain. The I-70 corridor, including Columbus, was to be the northern extent of this mixing, limiting snowfall accumulations. Still, even with the mix predicted, a solid 4″-6″ was predicted, which is a decent event by itself and typically the largest snow event of any given winter.
Precipitation began as snow across southern counties by dawn and spread north, reaching the Columbus area between 9AM and 9:30AM. It started out as flurries, but the flakes were already fairly large. Within 15 minutes, the flurries had turned to very heavy, wet snow. Flakes were as large as quarters at times and stayed large, accumulating quickly despite the above freezing temperatures. Visibility quickly dropped to a half mile or less at times, and traffic quickly snarled with accidents as plows could not keep up with the pace of the inch-per-hour snowfall rates. Between 4PM and 5PM, there was a respite as snowfall lightened and there was a mix of sleet and ice pellets, but all snow resumed once heavier precipitation moved in, concluding the only and very short period of mixing I-70 had. Snow continued through the night of the 5th and into the 6th, finally ending before noon.
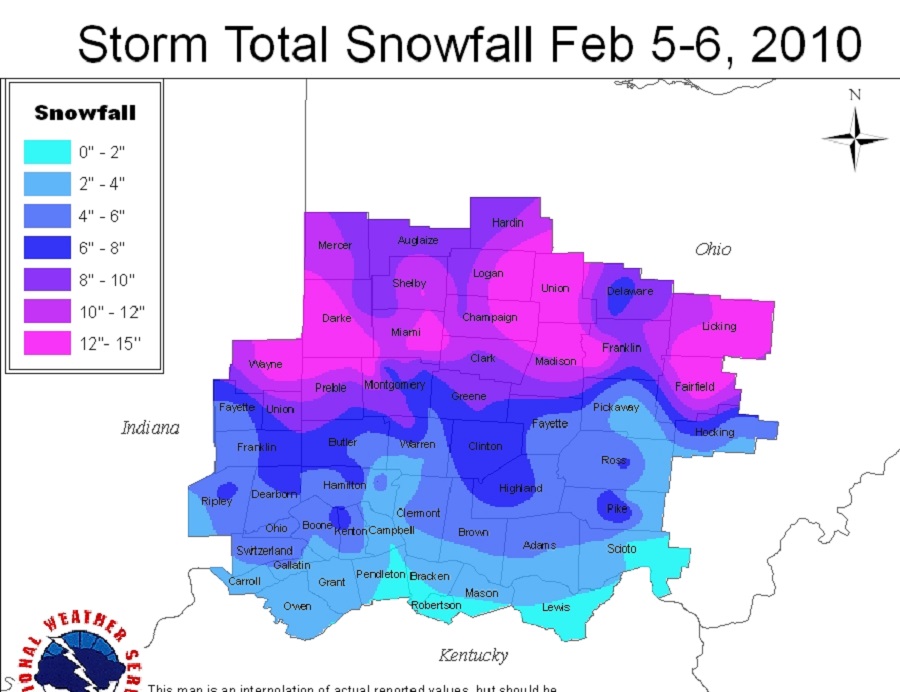
Snowfall totals were impressive, especially along and north of I-70, where little mixing took place, but also in pockets to the southeast of Columbus, like Lancaster. For Columbus, the 9.9″ that fell was good enough to be a top 15 largest snowstorm for the city. It would not, however, be the largest snowfall of the month.
Some snow totals across Ohio from February 5-6, 2010 Greenville: 14.8″ Lancaster: 13.0″ Akron: 12.1″ Bellefontaine: 12.0″ Urbana: 12.0″ Westerville: 11.4″ Dayton: 11.1″ Springfield: 11.0″ Columbus: 9.9″ Youngstown: 8.4″ Delaware: 8.0″ Cleveland: 5.9″ Cincinnati: 4.5″ Circleville: 3.0″ Toledo: 3.0″
Snow totals for the NWS Wilmington area.
This event was the only the beginning of what would be a trio of consecutive snowstorms that would strike the area over the course of 11 days, including the February 9-10, 2010 Snowstorm, which occurred just a few days later.