1900 Debate on Columbus Transit


1900 debate on Columbus transit

Streetcars in 1909.

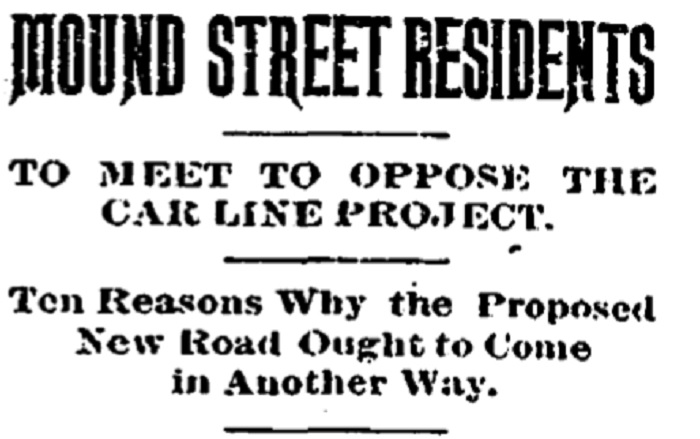
In a January, 1900 debate on Columbus transit, a group of concerned Downtown Columbus residents and business owners voiced their opposition to the Columbus & Newark Traction Company being greenlit to build and operate a streetcar line on Mound Street. Today’s car-dominated environment means most arguments against transit projects would likely revolve around rail being too expensive or that few would ride them. In contrast, 1900 arguments involving transit options showed a very different attitude towards public transit in general.

The opposition group put out a list of 10 reasons why they objected to the project. They were:
1. We believe it to be the interest of prospective passengers of a street railroad from the east over the National Road, that the cars come into the city over the Main Street tracks.
2. Because it would be most direct to the center of the city.
3. Coming over the Main Street line would confine cars of the new line to the established rate of speed while in the city.
4. The proposed line on Mound Street would get but few city passengers.
5. It is not likely that reduced fares would be secured.
6. Transfers over old lines could not likely be had.
7. Cars would be far between.
8. A car line on Mound Street would be useless to residents of the city because too near Main Street where cars are much more frequent than could be expected on a suburban line.
9. Not getting city traffic, cars on the proposed line over Mound Street would run at a high rate of speed, making it dangerous for people in that part of the city and especially so for the residents of Mound Street.
10. We believe that it would be to the general interest of the city and the special interest of the southeastern part, also the interest of a new company that the proposed new line over the National Road from the east should come into the city two or three blocks from, if not on the Main Street line, but never over Mound Street.


Besides being somewhat repetitive in places, the given reasons are more practical than the emotional anti-rail tirades often witnessed today. The group wasn’t so much opposed to rail- just the opposite. Instead, they didn’t like that there were too many lines in the same area, thereby making a new one redundant and financially infeasible. They didn’t bring up construction costs, but objections to the potential lack of transfer stops. They weren’t overly worried about the line interfering with other traffic, but whether the service would run enough cars.

Too often in the current transit debate, proposals tend to get bogged down in politics rather than the basic transit needs of the population. A century ago, even opposition groups seemed to fully understand that the issue was not rail itself, but in ensuring that what got built made the best sense possible. Columbus hasn’t had rail in more than 40 years. In its long absence, we’ve perhaps lost the plot on what really matters.

The opposition group lost the fight and Mound Street got its streetcar line. The East Mound section ended service in 1929 as the car became increasingly dominant.
The last streetcar trip in the city occurred on September 5, 1948.

Columbus Bike and Pedestrian Infrastructure Map

So first up to repost from the data loss will be one of the easiest. As mentioned the first time, I wanted to create a map that included the 10-county metro area highlighting every bit of existing, planned and under construction infrastructure involving biking and pedestrian activities. There are some existing maps that show this, but they are not regularly updated and they lack significant detail in what type of infrastructure exists.

Here is the link to the map: https://www.google.com/maps/d/edit?mid=zjN5g-xqXg7o.kmfXTQGVWudU&usp=sharing

The map is still very much a work in progress. I have neither finished the existing infrastructure level or the planned infrastructure level. I update it a bit more almost every day, so keep checking back!


The Changing Columbus Transit Scene


There’s been some discussion over the last few years about how driving habits are changing nationally. I’ve seen at least a few reports suggesting that overall driving is actually on the decline and has been for some time. This even while the population of the US continues to rise. A http://uspirg.org/sites/pirg/files/reports/US_Transp_trans_scrn.pdf”>new report has come out detailing the changing habits of cities, including the changing Columbus transit scene.

Percent Change in Per-Capita Vehicle Miles Traveled from 2006-2011
Columbus: -5.7%
Dayton: -0.2%
Akron: +1.2%
Cleveland: +5.1%
Youngstown: +5.4%
Cincinnati: N/A
Toledo: N/A

Columbus saw the largest drop in vehicle miles traveled, indicating that people there are driving less. Northeast Ohio all saw increases, which goes against the national trend. Toledo and Cincinnati did not have comparable numbers.

Percent Change in Per-Capita Passenger Miles Traveled on Mass Transit 2005-2010
Columbus: +1.6%
Dayton: -0.6%
Akron: -2.8%
Youngstown: -8.3%
Toledo: -28.8%
Cleveland: -34.2%
Cincinnati: -34.8%

Columbus was the only city to see an increase in its mass transit miles. Cleveland, Cincinnati saw drops of more than 1/3rd.

Change in the Proportion of Workers who Commuted by Car, 2000-2011
Dayton: -1.5%
Columbus: -1.2%
Toledo: -1.0%
Youngstown: -1.0%
Akron: -0.8%
Cleveland: -0.4%
Cincinnati: -0.2%

All 7 saw declines.

Change in the Proportion of Workers who Biked to Work, 2000-2011
Columbus: +0.3%
Akron: +0.1%
Cleveland: +0.1%
Dayton: +0.1%
Toledo: +0.1%
Cincinnati: +0%
Youngstown: +0%

Columbus saw the largest increase of all 7, although the actual changes are all small. No city measured in the US saw a change of more than +1.7%. The majority of cities were less than 0.3%.

Change in the Proportion of Workers Who Worked From Home, 2000-2011
Columbus: +1.4%
Cincinnati: +0.9%
Dayton: +0.8%
Cleveland: +0.6%
Toledo: +0.6%
Youngstown: +0.6%
Akron: +0.5%

Columbus again leads, though all cities saw increases.

Total Per-Capita Vehicle Miles Traveled in 2006
Cleveland: 8,285
Youngstown: 8,806
Akron: 9,379
Columbus: 9,956
Dayton: 10,084
Cincinnati: N/A
Toledo: N/A

Total Per-Capita Vehicle Miles Traveled in 2011
Cleveland: 8,705
Youngstown: 9,284
Columbus: 9,385
Akron: 9,490
Dayton: 10,068
Cincinnati: N/A
Toledo: N/A

Total Per-Capita Mass-Transit Miles Traveled in 2005
Cleveland: 172.0
Cincinnati: 110.0
Dayton: 64.7
Columbus: 52.6
Toledo: 51.6
Akron: 42.9
Youngstown: 17.3

Total Per-Capita Mass-Transit Miles Traveled in 2010
Cleveland: 113.0
Cincinnati: 71.8
Dayton: 64.1
Columbus: 53.4
Akron: 41.7
Toledo: 36.7
Youngstown: 15.9

% of Workers who Traveled by Car, 2011
Cleveland: 89.2%
Columbus: 89.8%
Cincinnati: 90.6%
Dayton: 91.4%
Akron: 92.5%
Toledo: 93.1%
Youngstown: 94.4%

National Rank (of 100 cities) in the % Change for those who Biked to Work, 2000-2011
Columbus: 15th
Dayton: 37th
Cleveland: 38th
Akron: 39th
Toledo: 49th
Cincinnati: 74th
Youngstown: 81st

% Change of Households with No Vehicle, 2006-2011
Akron: +2.2%
Dayton: +1.0%
Cleveland: +0.9%
Columbus: +0.9%
Cincinnati: -0.3%
Toledo: -0.4%
Youngstown: N/A

% Change of Households with 2+ Vehicles, 2006-2011
Toledo: -4.2%
Akron: -3.6%
Dayton: -2.8%
Cleveland: -2.6%
Columbus: -1.4%
Cincinnati: -1.1%
Youngstown: N/A

So what does all this data tell us? Well, for the most part, all Ohio cities are seeing car use decline in some way or another. Columbus performs strongly in car use declines and increases in at-home workers and increases in bike commuting. Mass-transit was where it performed the weakest, where it’s middle of the pack. Yet even there, it saw increases in its use.


Is Columbus Walkable?


Is Columbus Walkable

“Walkability” is the new buzzword when it comes to urban neighborhoods and what new generations want. Based on the WalkScore criteria, and with scores from 0-100 (100 being the most walkable), here are Columbus’ most walkable neighborhoods.

Top 25 Most Walkable Neighborhoods and Total Score
1. Downtown: 86
2. Dennison Place (Short North): 85
3. Italian Village (Short North): 85
4. Weinland Park (Just northeast of Short North): 85
5. Indiana Forest (Northeast Campus Area): 84
6. Necko (South Campus): 81
7. Victorian Village (Short North): 81
8. Old North Columbus: 80
9. Glen Echo (North Columbus): 80
10. North Campus: 80
11. German Village: 79
12. Tri-Village (5th Avenue West): 79
13. Brewery District: 78
14. OSU: 77
15. Iuka Ravine (North Columbus): 76
16. Clintonville: 75
17: King-Lincoln (Near East Side): 74
18. Schumacher Place (Near South Side): 73
19. Busch (Northwest Columbus): 72
20. Indianola Terrace (North Columbus): 71
21. Merion Village: 69
22. Governours Square (Bethel and Henderson): 68
23: Harrison West (Hilltop): 67
24. Old Beechwold (North Columbus): 67
25. Olde Towne East: 67

Together, the top 25 neighborhoods contain a little over 100,000 people.

Overall Columbus Neighborhood Walkability Score Breakdown
90-100 (Walker’s Paradise-daily errands do not require a car): 0
70-89 (Very Walkable- most errands can be done on foot): 20
50-69 (Somewhat Walkable- some errands cand be done on foot): 72
0-49 (Car Dependent- most or all errands require a car): 120
Average Columbus Score: 47

So less than half of Columbus’ neighborhoods are walkable, and only a small amount are very walkable, where most tasks do not require a car. The overall score shows that Columbus is still largely a car-dependent city.

Walkability, however, is just part of the picture. There are also scores for biking and mass transit access, both of which are also measured on the 0-100 scale.

Top 25 Bikeable Neighborhoods
1. North Campus: 89
2. Harrison West: 88
3. Northmoor (North Columbus): 80
4. Old North Columbus: 80
5. Clintonville: 77
6. OSU: 75
7. Brewery District: 74
8. Dennison Place: 74
9. Glen Echo: 74
10. Victorian Village: 74
11. Indiana Forest: 72
12. Iuka Ravine: 72
13. Necko: 71
14. Italian Village: 70
15. Merion Village: 68
16. Tri-Village: 68
17. Weinland Park: 67
18. Downtown: 66
19. Indianola Terrace (North Columbus): 66
20. North Hilltop: 66
21. Whetstone: 66
22. German Village: 64
23. Mount Vernon (Near East Side): 64
24. Riverview (North Columbus): 63
25. Schumacher Place: 63

The majority of Columbus’ most bikeable neighborhoods are also the most walkable.

Bikeable Neighborhood Score Breakdown
90-100: 0
70-89: 14
50-69: 45
0-49: 153
Average Columbus Bikeable Score: 45

Similar to its walkability, the majority of Columbus’ neighborhoods are not particularly bikeable. This has a lot to do with the further out and newer suburban areas of the city being built almost exclusively for cars. Only in the last 10 years has the city become more interested in promoting bike use. The city is adding several hundred miles of bike lanes and bike infrastructure, and it recently launched its own bike-share system.

Finally, we have the transit scores, which are based on access to mass transit options.

Top 25 Most Transit-Friendly Neighborhoods
1. Downtown: 64
2. Brewery District: 57
3. Italian Village: 57
4. German Village: 55
5. Victorian Village: 55
6. Dennison Place: 54
7. Weinland Park: 54
8. Necko: 52
9. Olde Towne East: 52
10. Schumacher Place: 52
11. Indiana Forest: 50
12. Harrison West: 49
13. King-Lincoln: 49
14. North Campus: 49
15. OSU: 49
16. Franklin Park (Near East Side): 49
17. Beechwood: 47
18. Iuka Ravine: 47
19. Milo-Grogan: 47
20. South of Main (Near East Side): 47
21. Livingston Park North (Near South Side): 46
22. Mount Vernon: 46
23. Old North Columbus: 46
24. Woodland Park (Near East Side): 46
25. Franklinton: 45

Transit Score Neighborhood Breakdown
90-100: 0
70-89: 0
50-69: 11
0-49: 201
Average Columbus Transit Score: 29

Clearly, based on these numbers, the city’s transit system needs a ton of improvement. COTA, or the city’s bus system, is really the only form of mass transit available, and beyond a few areas near Downtown, seems to struggle to provide access. The city is currently studying BRT (Bus Rapid Transit) with a first line proposed from Downtown and up along Cleveland Avenue to the North Side, with future lines coming after that. This will help, but there is still much to be done. Some type of rail system should also be part of near future development, as the city remains one of the largest in the US without any type of passenger rail.

So what is the overall picture of the city? First, that too much of the city is built for car use only. The boom in urban development has been significant, but the vast majority of it is occurring in areas that have the highest scores. Correlation or coincidence? Densification of neighborhoods further from the core is entirely possible, and these areas can and should be built with walkability and transit in mind. The city is taking steps for improvement, but it is, at least in my opinion, one of the weakest points of Columbus.


Global Bike-Share System Map


Global bike-share system map

Global Bike Share Map

This map shows the location of every bike share system in the world. The map gives data on system size, bike availability at stations, station totals and locations. You can even pull up ridership reports and run animations! Columbus will be getting a bike share system that opens in July, so expect it to show up on this map in the coming months!