In the last few decades, the Columbus Bhutanese community has grown into one of the largest in the world outside of Bhutan, itself. Many of these immigrants were resettled in other parts of Canada and the US, but an increasing number of them have made their way to Columbus and Central Ohio. According to the Bhutanese Community of Central Ohio, the area’s Bhutanese population now numbers upwards of 27,000, and projected to surpass 30,000 over the next few years.
This community has already made a local impact, opening new restaurants, shops and cultural and religious centers across the city and region.
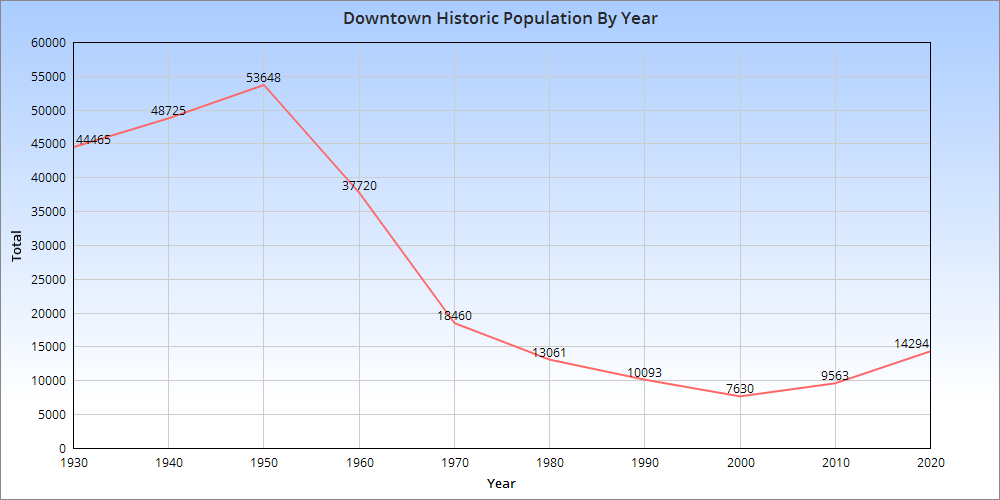
With the latest US Census data for 2020, we can once again take a closer look at how the Downtown area is doing.
Looking at the graph above, we can see that the Downtown population peaked in 1950 and declined through 2000. The last 20 years have seen accelerating growth and the population was the highest in 2020 since 1970. One caveat with this is that the census tract boundaries that are used to make up this graph have changed some over the years. They haven’t changed significantly, but the area that’s being covered in 2020 is slightly different than it was in 1950. As such, it’s more of an approximation per year rather than exact figures based on the exact same area. Still, the rapid decline after 1950 is well-documented. Highways were either being planned or already under construction through the neighborhood during the 1950s, and this also helped the beginning stages of the suburban flight from the urban core.
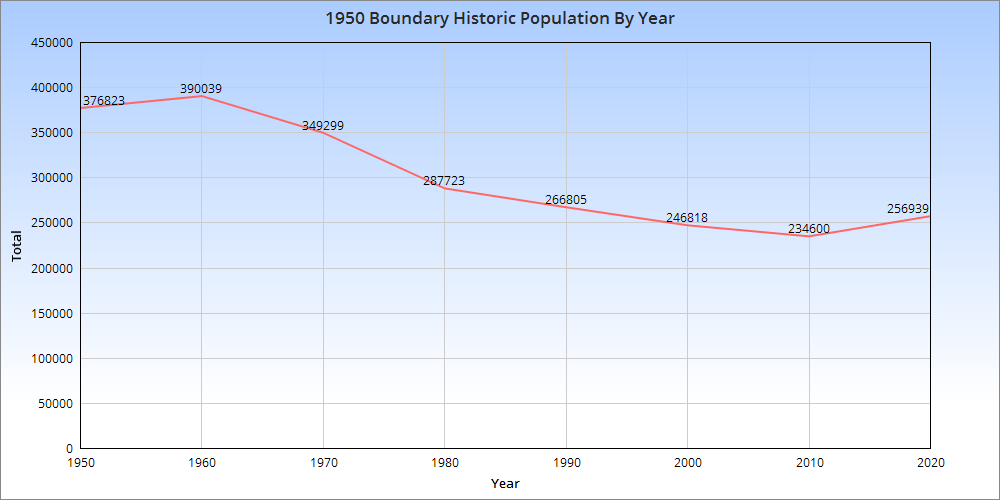
The urban core of the city overall reached its population peak in 1950, and the 1950 boundaries represent the oldest, arguably most urban part of the city today. Let’s examine how the population within that boundary changed over the same time. The 1950 boundary peaked in 1960 and then declined through 2010. Between 2010-2020, the 1950 boundary area gained more than 22,000 new residents, a significant increase which puts the area back to where it was around 1995.
So in both cases, the urban core of Columbus is in recovery, though it is unlikely to ever regain its 1950 population. Average household size is much smaller now than it was 70 years ago, so it would require a massive amount of infill that would be far denser than much of what is getting built in recent years. Outdated zoning codes, among other reasons, have been limiting many projects in the urban core from reaching their potential.
Breaking things down a bit further, let’s look at the census tracts that made up the 1950 boundary in 2020 and rank them for population and growth.
Top 10 Fastest-Growing 1950 Boundary Census Tracts by Total 2010-2020 1. 1121: +4,831 The tract is the main OSU Campus. The explosive growth is mostly due to the recent requirement that sophomores also have to now live on Campus, prompting thousands of students to move to the tract from nearby neighborhoods. 2. 4002: +2,592 This new tract was split off of Tract 40 and includes the southwest area of Downtown, including RiverSouth. 3. 22: +2,428 This tract is the heart of Italian Village and includes the large, new Jeffrey Park development. 4. 1901: +2,028 Includes the 5th Avenue corridor to just east of 5thxNW. 5. 32: +1,353 This tract covers the southern part of Victorian Village/Harrison West, as well as the far western sections of the Arena District where the new White Castle HQ complex is. 6. 17: +1,290 Western Weinland Park, which has seen rapid revitalization in recent years. 7. 30: +1,084 This area includes all of the norther half of Downtown north of Broad Street and west to Neil Avenue in the Arena District. 8. 16: +717 Eastern Weinland Park, which has seen hundreds of new housing units constructed along and near Grant Avenue. 9. 1902: +653 Includes the 5th Avenue corridor through 5thxNW. 10. 21: +648 The heart of the High Street strip in the Short North continued to add people. It reached its highest population in 60 years.
Top 10 Tracts with the Highest Population Densities in 2020 1. 1121: 34,888.8 2. 1810: 28,351.1 3. 1302: 24,740.7 4. 1301: 20,549.1 5. 17: 20,158.6 6. 12: 20,069.6 7. 1110: 18,353.2 8. 10: 16,260.2 9. 16: 12,675.6 10. 21: 12,196.7 All of these tracts are either in the Short North or surrounding Ohio State’s campus. They include the highest densities anywhere in Ohio.
So there you have it. The urban core of Columbus is clearly on a positive path. So long as infill development continues, population growth should also continue to increase. Perhaps someday, this increasing population and density may facilitate the construction of more amenities, including rail lines, BRT and more biking infrastructure, all of which lags in the area. To see Census Tract data in map form, the Census Tract Maps page provides it.
Continuing with the data from the 2020 Census, we break down the population rank for every community and census-designated place in the Columbus metro area. Census-designated places are areas with concentrations of population, but are not part of incorporated villages, towns or cities.
The main story with the 2020 census numbers is that smaller communities in rural counties generally declined the past decade. This followed a similar story with non-metro counties, not only in Ohio, but nationally. Population continues to concentrate closer to more urban areas, which tend to be the job centers. If such population declines continue in the decades ahead, many of these small towns and villages may die out.
These trends also have potential impacts on the upcoming state redistricting. With conservative, rural areas emptying out and more liberal cities and urban areas growing, how will this affect how congressional districts get drawn?
Franklin blew away the competition, adding more than 4x as many people as 2nd place Delaware County. Delaware County may be called the state’s fastest-growing by percent, but it’s clear what the dominant destination is in Ohio.
Core counties in Northern Ohio, as well as pretty much all of Appalachia and rural counties saw large population losses. This pattern of urban/metro counties gaining while exurban and rural counties declined was repeated nationally. 52% of all US counties lost population, with the vast majority of them being exurban and rural. There was clearly a strong trend towards people moving to or near major cities.
After a very long delay, the 2020 Census data has arrived! In this first series of related posts, we will compared Columbus to national peer and Midwest metro areas. Metros used here are those that were within 1.5-2.5 million in either 2010 or 2020, as well as Midwest metros of 500,000 or more in either 2010 or 2020, and all Ohio metros.
Total Population by Metro Area by Year Green metros moved up in the rankings 2010-2020 and red moved down.
Rank
2010
2020
1
Chicago: 9,461,105
Chicago: 9,618,502
2
Detroit: 4,296,250
Detroit: 4,392,041
3
Minneapolis: 3,346,859
Minneapolis: 3,690,261
4
St. Louis: 2,787,701
St. Louis: 2,820,253
5
Pittsburgh: 2,356,285
Orlando: 2,673,376
6
Charlotte: 2,243,960
Charlotte: 2,660,329
7
Portland: 2,226,009
San Antonio: 2,558,143
8
Sacramento: 2,149,127
Portland: 2,512,859
9
San Antonio: 2,142,508
Sacramento: 2,379,382
10
Cincinnati: 2,137,667
Pittsburgh: 2,370,930
11
Orlando: 2,134,411
Austin: 2,283,371
12
Cleveland: 2,077,240
Las Vegas: 2,265,461
13
Kansas City: 2,009,240
Cincinnati: 2,256,884
14
Las Vegas: 1,951,269
Kansas City: 2,192,035
15
Columbus: 1,901,974
Columbus: 2,138,926
16
Indianapolis: 1,887,877
Indianapolis: 2,111,040
17
San Jose: 1,836,911
Cleveland: 2,088,251
18
Austin: 1,716,289
San Jose: 2,000,251
19
Virginia Beach: 1,713,954
Nashville: 1,989,519
20
Nashville: 1,646,200
Virginia Beach: 1,799,674
21
Providence: 1,600,852
Providence: 1,676,579
22
Milwaukee: 1,555,908
Jacksonville: 1,605,848
23
Jacksonville: 1,345,596
Milwaukee: 1,574,731
24
Grand Rapids: 993,670
Grand Rapids: 1,087,592
25
Omaha: 865,350
Omaha: 967,604
26
Dayton: 799,232
Dayton: 809,248
27
Akron: 703,200
Des Moines: 707,915
28
Toledo: 651,429
Akron: 701,449
29
Wichita: 623,061
Madison: 670,447
30
Des Moines: 606,475
Wichita: 643,768
31
Madison: 605,435
Toledo: 641,549
32
Youngstown: 565,773
Lansing: 548,248
33
Lansing: 534,684
Youngstown: 531,420
34
Canton: 404,422
Canton: 396,669
Columbus largely held its own in the rankings this decade, but it poised to eventually pass a few of the metros currently ahead of it.
Columbus had the 2nd highest growth in the Midwest after Minneapolis, and is growing much faster than 3 metros currently ranked ahead of it- Cincinnati, Kansas City and Pittsburgh- which it will likely pass at some point in the future. For Cincinnati, for example, current growth rates would suggest Columbus will pass it sometime around 2027. In any event, Columbus’ metro growth was the highest in its history, and about 10,000 more than occurred during the 2000s.
Data related to metro components of growth, such as immigration and deaths vs. births, have yet to be released. Those should come out sometime next month, and will be posted here when they do.