I have been wanting to do these maps for awhile now, as there have been several searches on the site for them and they weren’t available. The maps look at Columbus murders by zip code 2008-2012, highlighting which zip codes have seen the most murders by year and across the period as a whole.
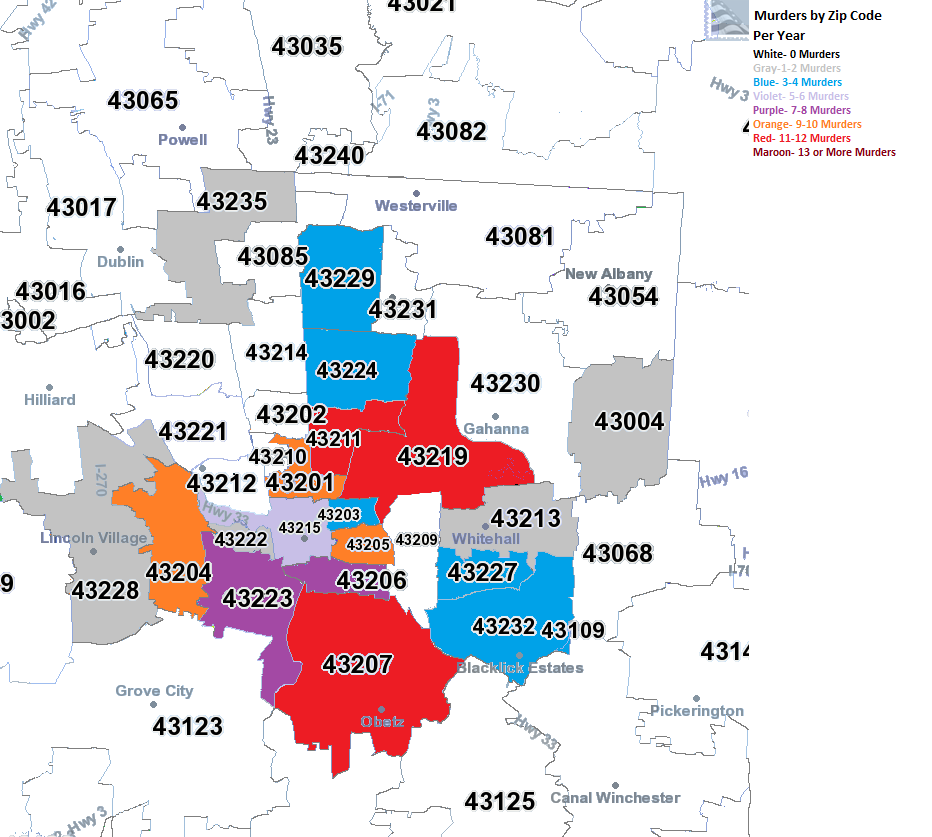
2008 In 2008, almost all murders were contained within the I-270 boundaries. The East and South Sides were the worst areas.
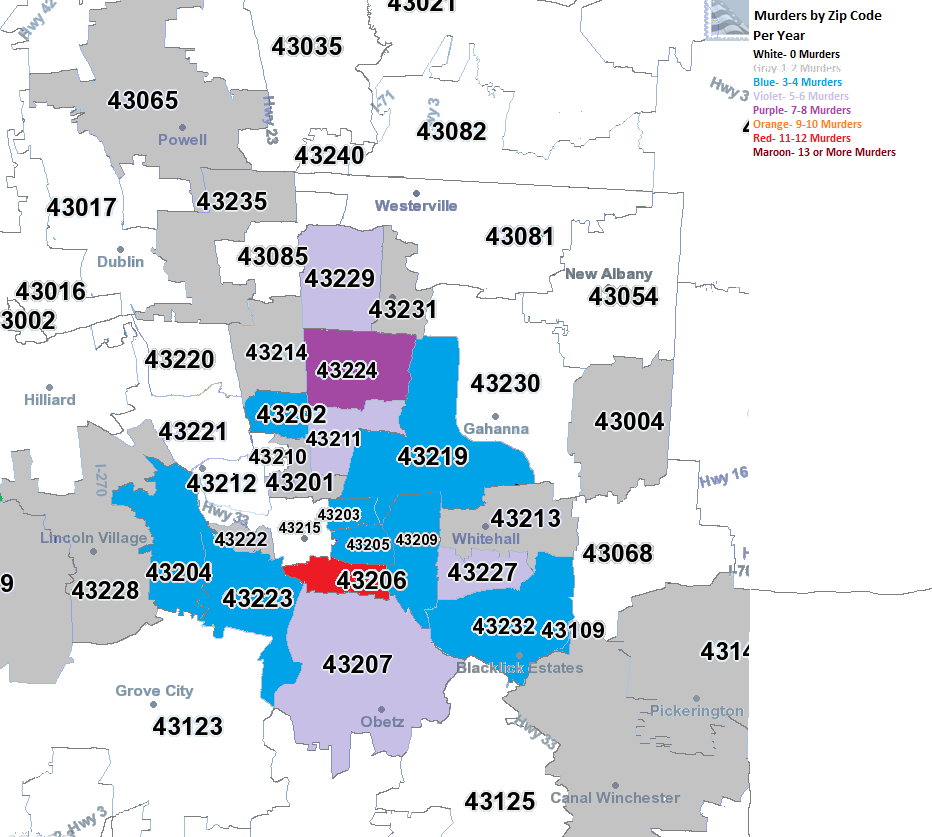
2009 In 2009, there began to be a bit of diffusion on where murder was taking place. While parts of the urban core remained the worst areas, suburban areas also saw the occasional murder.
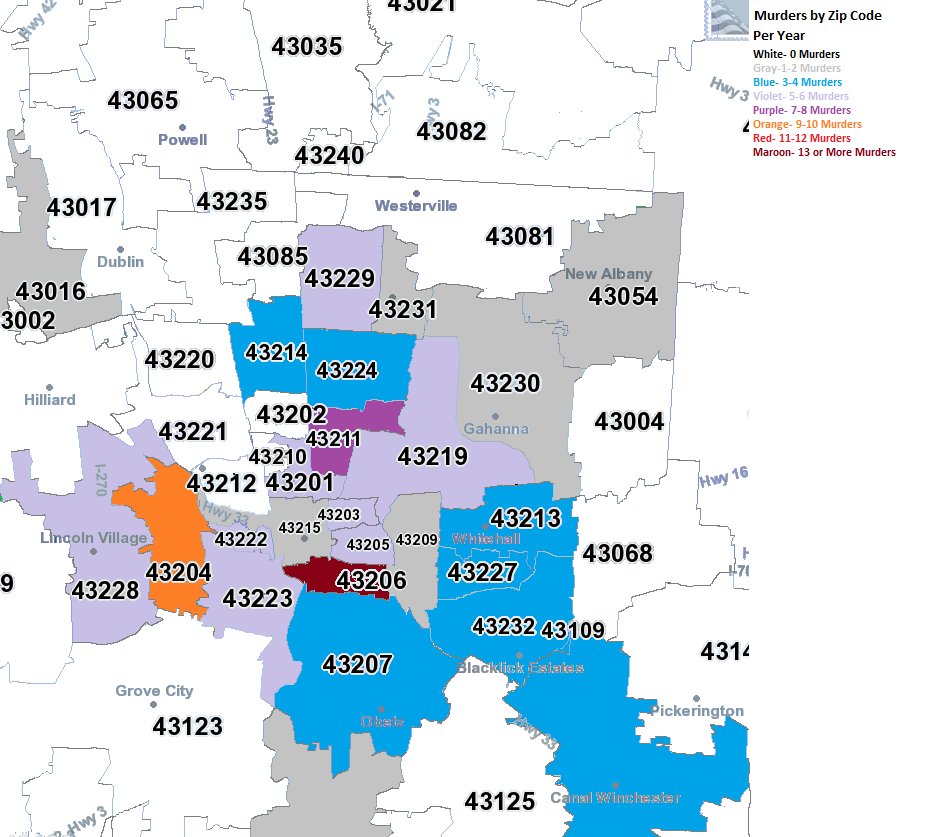
2010 The diffusion continued in 2010.
2011 And in 2011.
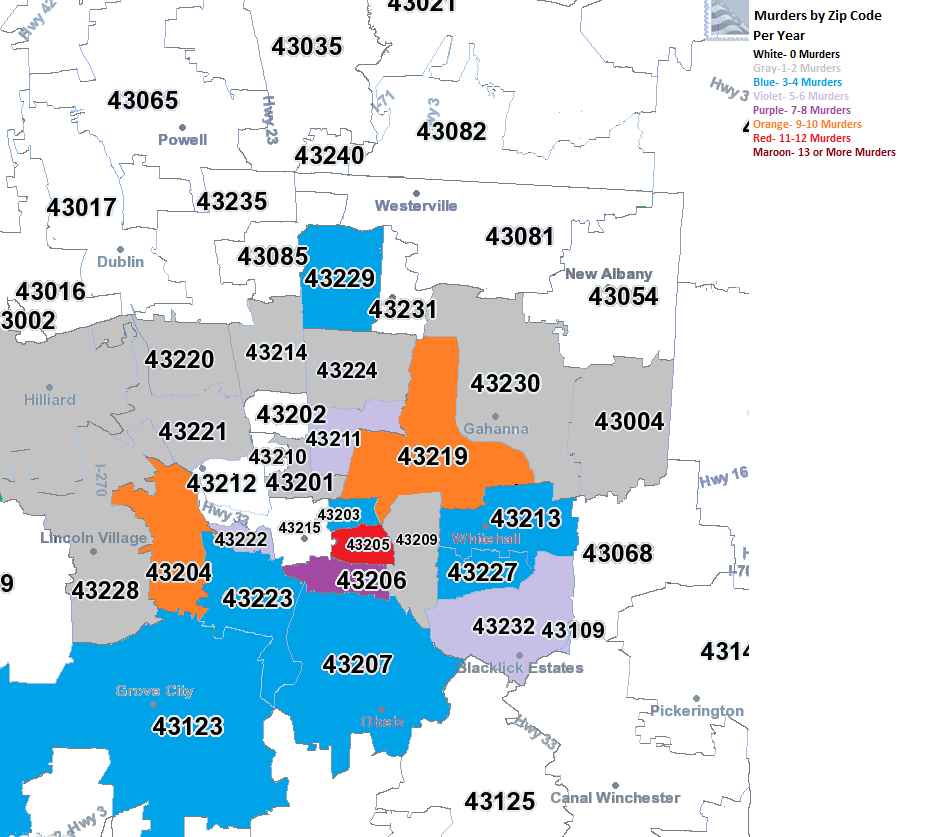
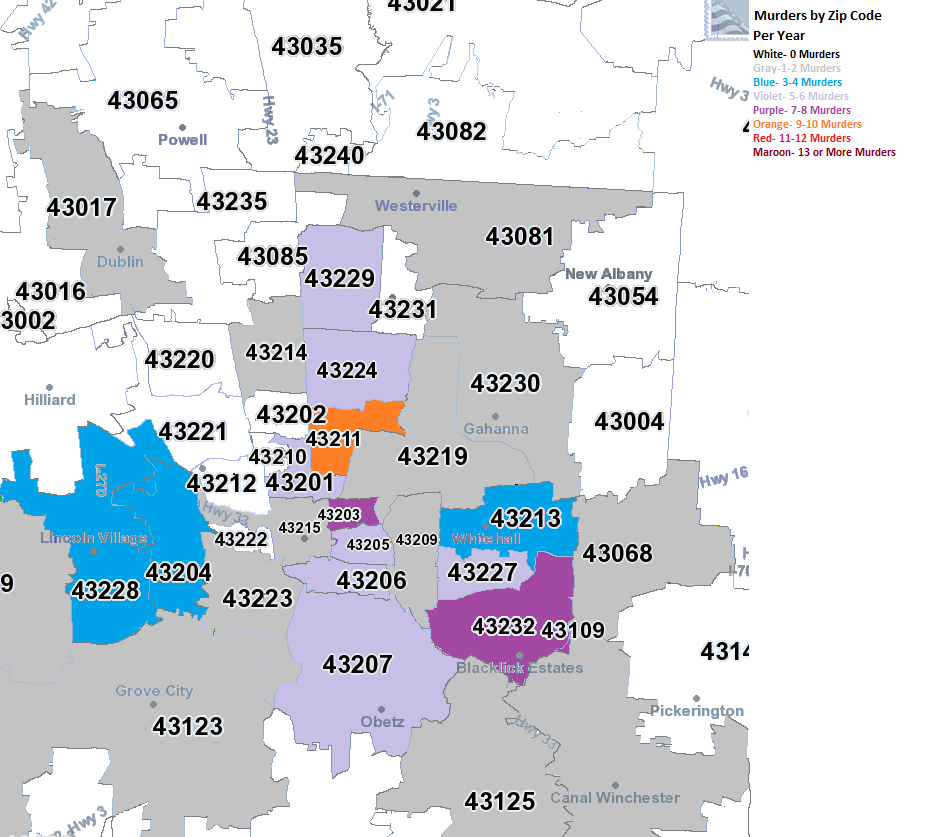
2012 2012 was the most diffuse of all the years, with no heavily concentrated areas, even in the urban core as much. Meanwhile, most of the suburban zip codes within Franklin County saw at least 1 murder.
The question is, what do we make of this? This is only a 5-year data set, but it may be supporting evidence for current urban trends. The first trend being that the urban core is rapidly gentrifying in many areas. The second being that poverty is, through economic and development trends, is spreading further out from the core. Concentrated poverty and crime go hand in hand, so while the suburbs may see a bit of increase in crime, the urban core is starting to see less. Something to watch over time to see if such trends continue.
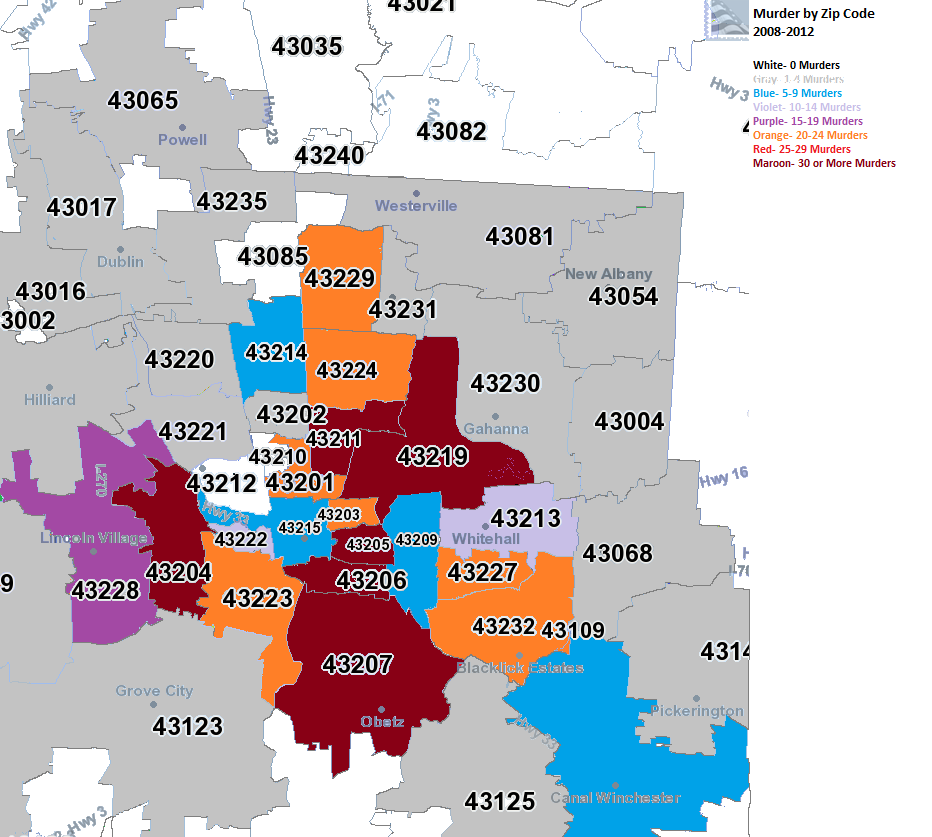
2008-2012 What strikes me about the 5-year map is that Grandview/Upper Arlington have been entirely murder free while every zip around them have had at least one. Also, Downtown is also relatively murder free, as is Bexley and the Clintonville areas.
Of course, zip codes include large areas. What are the neighborhoods that are actually seeing murders and which ones are not? To find out, we’ll have to go down to the tract level. Over the next few days, I’ll post those maps.
This map shows the location of every bike share system in the world. The map gives data on system size, bike availability at stations, station totals and locations. You can even pull up ridership reports and run animations! Columbus will be getting a bike share system that opens in July, so expect it to show up on this map in the coming months!
One of the more interesting things the Census measures is the population from “City Hall”, or basically the metro population by distance from downtown. The metric measure population at every mile out from the center of each city’s downtown area. Since city boundaries come in all different sizes, this is a good way to compare urban populations.
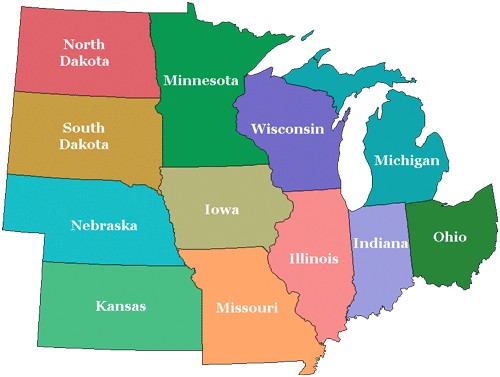
I looked at the 15 largest Midwest metros for these numbers.
First, here is a breakdown of aggregate population at each mile marker in 2010. Aggregate means that with each mile added, the population within all previous miles are added together.
This is a pretty bad showing in this list. In 2010, Columbus had the lowest downtown population, or population at Mile 0, of any of the largest 15 Midwest metros.
So while Columbus’ downtown is down at the bottom in this list to start, it ends up being a top 5 within just a few miles. Clearly, though, the city needs to do better at getting people in the center.
Columbus seems to hold its own from Mile 2 through about Mile 15 or 16, and then begins to fall back as full metro populations begin to take shape.
So now we know the exact populations by distance, but what about how those are changing over time? Here are the same miles and their total change from 2000 to 2010.
The Columbus Board of Realtors released home sales data for April and YTD recently. Their area covers an area a bit larger than the Columbus metro, so I tried to stick with just those areas within it. I also tried to avoid capturing essentially the same area (school district vs city boundary). There are a few exceptions where I wanted to highlight specific areas or neighborhoods of Columbus.
LSD=Local school district CSD=City school district
Top 10 Home Sales % Change since April 2012 1. Bexley city: +137.5% 2. Sunbury city: +125.0% 3. Delaware LSD: +82.4% 4. Lancaster CSD: +74.2% 5. Hilliard city: +66.7% 6. Marysville CSD: +64.3% 7. Pataskala city: +57.1% 8. London CSD: +50.0% 9. Upper Arlington CSD: +48.9% 10. South-Western CSD: +47.8%
Top 10 Home Sales % Change 2013 Year to Date 1. Sunbury city: +78.6% 2. Lithopolis city: +66.7% 3. Bexley city: +50.0% 4. Gahanna city: +46.1% 5. Hilliard city: +45.5% 6. Delaware CSD: +44.3% 7. Westerville city: +40.3% 8. Whitehall city: +37.5% 9. Marysville CSD: +36.7% 10. Lancaster CSD: +36.0%
Bottom 10 Home Sales % Change since April 2012 1. Powell city: -55.6% 2. Minerva Park city: -50.0% 3. Whitehall city: -42.9% 4. German Village: -36.4% 5. Downtown: -29.6% 6. Obetz city: -20.0% 7. New Albany city: -14.3% 8. Worthington city: -12.5% 9. Grandview Heights city: -11.1% 10. Circleville CSD: -11.1%
So it looks like, so far… in the urban core, Bexley, Upper Arlington and Whitehall are all having a good sales year, while Worthington and Grandview Heights are not. Downtown had a bad April, but is doing well for the year. Same with German Village. Suburbs performing well include Delaware, Hilliard and Sunbury. Those performing badly include New Albany and Powell.
Top 10 Turnover (Average # of Days on the Market before Sold) in April 2013 1. Valleyview city: 0 Days 2. Plain City CSD: 25 Days 3. Sunbury city: 27 Days 4. German Village: 29 Days 4. Obetz city: 29 Days 4. Worthington city: 29 Days 5. Powell city: 43 Days 6. Upper Arlington CSD: 47 Days 7. Beechwold/Clintonville: 49 Days 8. Gahanna city: 52 Days 8. Pataskala city: 52 Days 9. Lithopolis city: 54 Days 10. Grandview Heights city: 56 Days
Bottom 10 Turnover for April 2013 1. Circleville CSD: 164 Days 2. London CSD: 131 Days 3. Newark CSD: 123 Days 4. Minerva Park city: 116 Days 5. Downtown: 105 Days 6. Marysville CSD: 102 Days 7. Lancaster CSD: 98 Days 8. Delaware CSD: 92 Days 9. Blacklick: 88 Days 10. Bexley city: 80 Days
Top 10 Turnover 2013 Year to Date 1. Worthington city: 42 Days 2. Plain City CSD: 46 Days 3. Obetz city: 48 Days 4. Upper Arlington CSD: 60 Days 5. Pickerington city: 65 Days 6. Pataskala city: 67 Days 6. Whitehall city: 67 Days 7. Beechwold/Clintonville: 68 Days 7. Grandview Heights city: 68 Days 7. Minerva Park city: 68 Days 8. Groveport LSD: 69 Days 8. Reynoldsburg LSD: 69 Days 8. South Western CSD: 69 Days 9. German Village: 70 Days 9. Powell city: 70 Days 9. Westerville city: 70 Days 9. Worthington city: 70 Days 10. Columbus city: 72 Days
Bottom 10 Turnover 2013 Year to Date 1. Valleyview city: 151 Days 2. Circleville CSD: 148 Days 3. Newark CSD: 117 Days 4. London CSD: 115 Days 5. Bexley city: 97 Days 6. Lancaster CSD: 96 Days 7. Delaware CSD: 90 Days 7. Hilliard city: 90 Days 7. New Albany city: 90 Days 8. Johnstown LSD: 89 Days 9. Downtown: 87 Days 9. Lithopolis city: 87 Days 9. Marysville CSD: 87 Days 10. West Jefferson LSD: 86 Days
# of Months Total On-Market Housing Supply Would Last if No Other Homes Became Available, April 2013- Top 10 1. Valleyview city: 1.6 Months 2. Worthington city: 1.8 Months 3. Grandview Heights city: 2.0 Months 4. Upper Arlington CSD: 2.3 Months 5. Sunbury city: 2.5 Months 6. Hilliard city: 2.7 Months 7. Beechwold/Clintonville: 2.8 Months 8. Powell city: 2.9 Months 8. Westerville city: 2.9 Months 9. Gahanna city: 3.1 Months 10. Johnstown LSD: 3.2 Months
And Bottom 10 1. Granville CSD: 9.2 Months 2. London CSD: 8.7 Months 3. Circleville CSD: 8.6 Months 4. Newark CSD: 7.4 Months 5. Pataskala city: 5.9 Months 6. Lancaster CSD: 5.8 Months 7. Obetz city: 5.0 Months 8. South Western CSD: 4.8 Months 9. Canal Winchester CSD, Marysville CSD, New Albany city, Reynoldsburg CSD: 4.6 Months 10. Columbus city, Grove City city: 4.5 Months
With the supply numbers, generally anything around 5 months is considered a healthy supply. Well over and the market is saturated, well under it’s undersupplied. For the record, Downtown’s supply is 4.1 months.
Top 10 Average Sales Price % Change Year to Date 1. Valleyview city: +52.3% 2. Circleville CSD: +29.8% 3. Johnstown LSD: +26.7% 4. Minerva Park city: +23.7% 5. Gahanna city: +22.6% 6. Marysville CSD: +22.3% 7. Downtown: +19.9% 8. Lancaster CSD: +17.6% 9. Reynoldsburg CSD: +14.0% 10. Bexley city: +11.3%
I have a lot of new additions planned for February. I will continue the ongoing updates on the new Census Tract Data page. This project is probably going to take a few months, as there are literally hundreds of census tracts and I plan to present data for each one. I wanted to do this specifically because it’s so difficult to find one site with this information. The US Census has it, but unfortunately it’s separated into invidual census years. Demographics for them are even harder to find. So I hope that those out there, like myself, who love this kind of stuff will find it useful and interesting.
Also, I plan to add a few more catergories to the Demographics Page.
Other than the tract and demographic page updates, I also plan to highlight at least a few individual projects from the past, present and future in regards to development. I will also update the ongoing yearly development list page, as there have been several new projects announced or that I’ve found that need to be added.
I will also be posting February’s weather records as well as a late report on the Blizzard of 1978.
Finally, I will be posting December’s unemployment and jobs report when it is finalized.
And as always, any major news stories about the city or metro will be posted as they show up.
So yeah, definitely a busy month planned with a ton to get done. I may be setting the bar a bit too high!