A link mapping commuting patterns can be very beneficial if you are curious to know how people get to work in every county in the United States. Luckily, this link does just that. http://flowingdata.com/2015/01/20/how-americans-get-to-work/
The map was constructed using 2013 data, so it’s fairly recent. As for Franklin County? Here’s the breakdown: Drive Alone: 82% Carpool: 8% Public Transit: 2% Walk: 2% Bicycle: 1% Taxi or Other: 1% Work from Home: 4%
The numbers are overwhelmingly auto-centric, as they are nearly everywhere, but what the numbers don’t show are any trends.
The Census released updated 2013 census tract estimates, and they showed some interesting things. There are 285 census tracts that make up Franklin County.
First, let’s take a look at the Franklin County trends 2000-2013.
In regards to the above map, it’s a mix of both the 2013 official estimates and some that I did. For example, the official estimates had the Downtown tracts 30 and 40 losing population, as well as most of the Short North. That’s rather absurd considering the level of residential construction in these areas, as well as population estimates the city has done in the last few years for Downtown. In fact, the 2013 official estimates have Downtown tract population BELOW 2010. That’s just not the reality. So I looked over the tracts and adjusted them according to their long-term growth/decline trends. Most of them I left alone, but some adjustments had to be made. However, I was very conservative with any changes, and several tracts that the official estimates showed gains, I actually had losses.
Here are all the tracts that grew by at least 300 people between 2010 and 2013 in Franklin County, as well as their locations. Blacklick #7395: +1,609 Dublin #6230: +1,214 Columbus-West Side #7951: +1,002 Columbus-Northwest #6372: +966 Columbus Northeast #6931: +963 Hilliard #7921: +955 Columbus-East Side #9361: +952 Columbus-West Side #8350: +951 Columbus-Northwest: #6384: +949 Dublin #6220: +933 Columbus-West Side #8141: +921 Columbus-Easton #7551: +793 Columbus-Southeast #9373: +749 Hilliard #7933: +688 Minerva Park #7112: +675 Columbus-South Side #8340: +652 Hilliard #7954: +643 Columbus North Side #7044: +636 Columbus Northeast #7132: +615 Columbus Northwest #6396: +557 Dublin #6386: +549 Columbus North Side #6921: +540 Columbus Northwest #6393: +492 Columbus-West Side: +489 Gahanna #7492: +473 New Albany #7209: +472 Columbus-Hilltop #8321: +466 Columbus-Southeast #9374: +455 Grove City #9740: +441 Columbus Northeast #6945: +438 Hillard #7931: +432 Columbus-West Side #7812: +427 Columbus-South Side #9590: +411 Columbus-South Side #8710: +407 Hilliard #10602: +407 Columbus-South Side #8822: +403 Whitehall #9230: +398 Columbus-West Side #8163: +397 Columbus-East Side #9362: +389 Columbus-Downtown #30: +387 Hilliard #7953: +382 Columbus-West Side #6330: +371 Columbus-Northwest #6387: +361 Columbus-East Side #9322: +352 Columbus-South Side #8825: +349 Columbus-Southwest #8161: +346 West Side-Marble Cliff #43: +345 Columbus-Southwest #8370: +340 Grandview #85: +332 Columbus-Downtown #40: +321 Hilliard #7922: +320 Dublin #6371: +312 Grove City #9751: +304 Columbus-Campus Area #13: +303
As far as the core of the city, the 1950 boundaries, here are the results.
There are 78 tracts that make up the original 1950 city boundary. Using the official estimates, 38 of the 78 tracts grew between 2010-2013, yet had a total loss of 3,229. However, again, it had all the Downtown and adjacent tracts inexplicably losing population, yet the opposite is occurring in these areas. For Downtown, the combined loss was about 370, and for the Short North, it had the loss at more than 700.
Using my adjusted estimates, 35 tracts are growing, adding 1,166 people 2010-2013. Most of the gains were made in the Downtown and adjacent tracts, and some of the losses were simply not as steep. For example, the official estimates had tract #10, in the Campus area, losing nearly 1,300 people since 2010, which is a ridiculous loss, especially considering it grew by almost 8% 2000-2010. In fact, most of the largest losses from the official estimates were around Campus and the Short North. Nonsense.
For this update, I’m going to do things a bit differently. In previous updates, I have done long ranking lists and it got to be a bit overwhelming. So starting with this update, I’m going to do more charts instead.
In any case, August continued the year-long trend of home sales being down, with the month coming in at more than 11% off from the same time last year. Prices, however, were up more than 6% to reach a monthly record. There continues to be a supply problem, which is the main mechanism driving both lower sales and higher prices.
The Columbus Lank Bank got started back in 1994 to address vacant land and properties, but more specifically, the worst of the worst. Over the years, the number of properties on the list has grown into the hundreds as the city bought the properties to either renovate what could be renovated, or to demolish those that could not be saved and were contributing to the decline of surrounding neighborhoods.
The city provides a few links where these properties can be searched for and purchased. The properties are in various stages of decline and are being sold only to those qualified to renovate the properties or replace them with new development. Many of them are in urban locations, and most of the houses are old, with many retaining elements of their original architecture. In most cases, they need major to moderate rehabs, however. Given the rise of urban living lately and the rapid pace of revitalization happening throughout urban Columbus, these properties maintain some inherent value despite what their overall condition may be.
June’s housing data for the Columbus region was just released. The month continued the same story as the previous 5 months, with home sales down due to a lack of inventory. Prices continued to rise and the number of days to sell a home continued to fall in relation to this problem. As always, I looked at 21 major areas of the Columbus region, both urban and suburban. Here is how those areas performed.
Top 10 June 2014 Sales Totals 1. Columbus: 1,045 2. Upper Arlington: 109 3. Dublin: 108 4. Clintonville: 83 5. Westerville: 77 6. Gahanna: 63 7. Grove City: 62 8. Reynoldsburg: 59 9. New Albany: 38
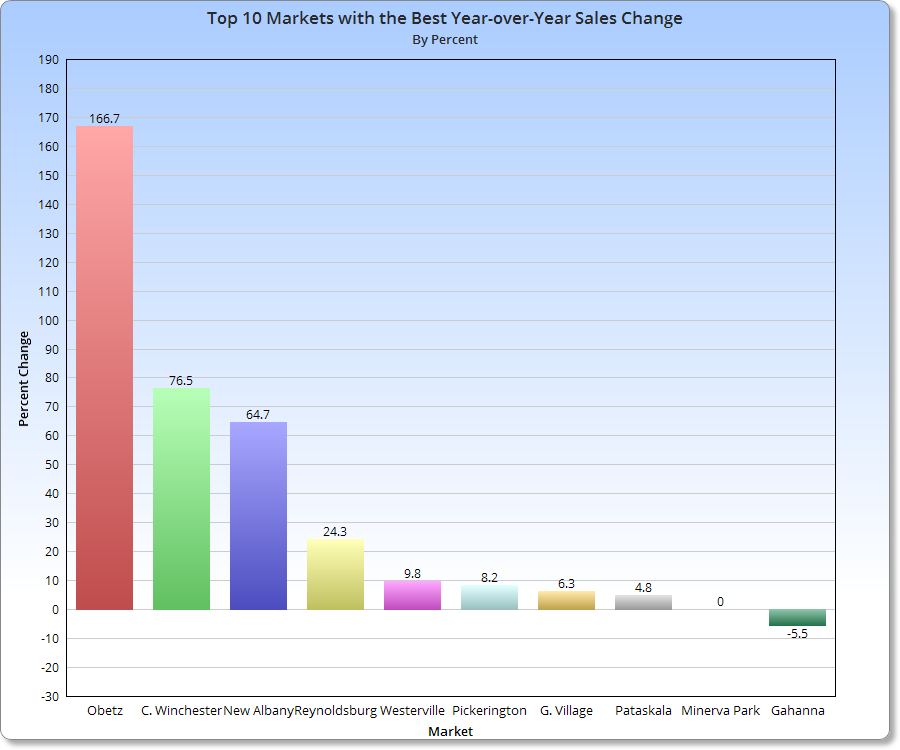
Top 10 June 2014 Sales Increases over June 2013 1. Downtown: +72.0% 2. Grove City: +14.5% 3. Gahanna: +12.7% 4. German Village: +10.5% 5. Grandview Heights: +6.3% 6. Canal Winchester: +3.8% 7. Hilliard: 0.0% 8. Minerva Park: 0.0% 9. Columbus: -1.8% 10. Reynoldsburg: -5.1%
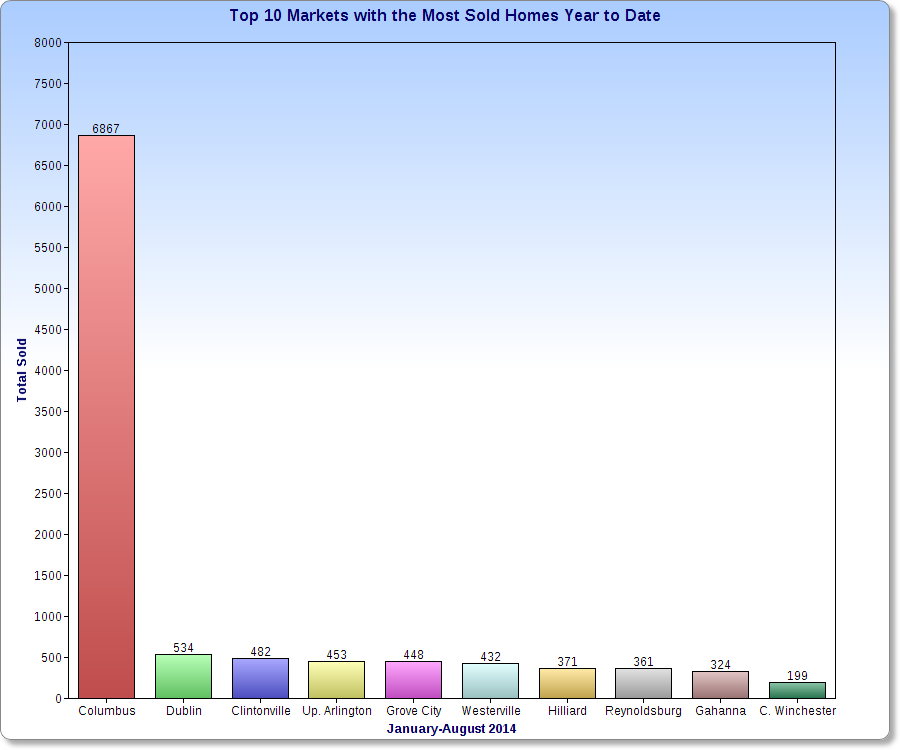
Top 10 Year-to-Date Sales Through June 2014 1. Columbus: 4,803 2. Dublin: 362 3. Grove City: 332 4. Clintonville: 323 5. Westerville: 299 6. Upper Arlington: 294 7. Reynoldsburg: 265 8. Hilliard: 258 9. Gahanna: 221 10. Pickerington: 136
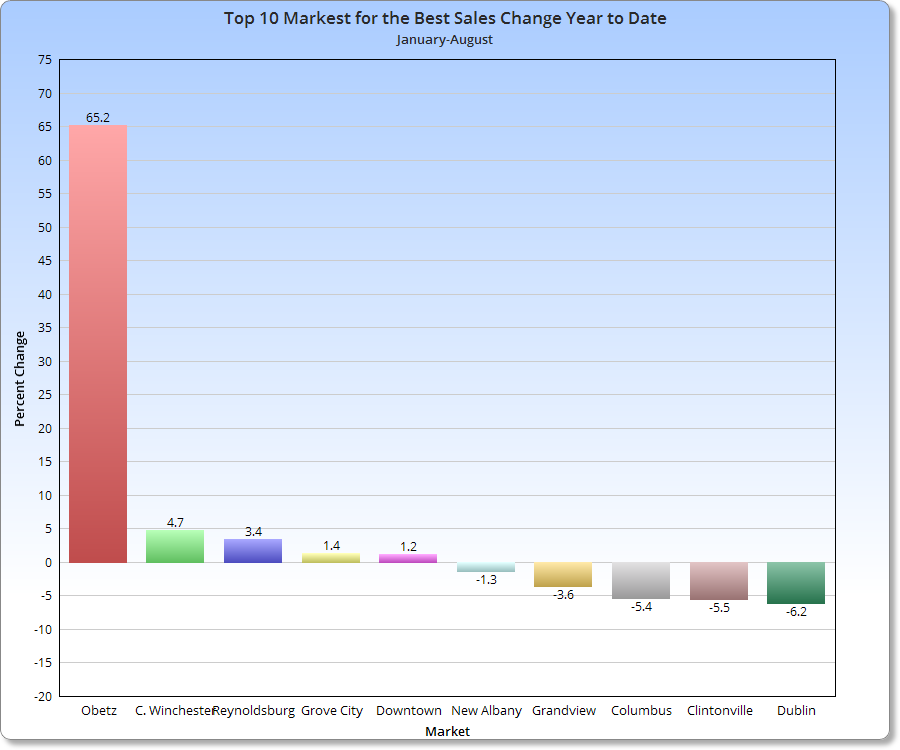
Top 10 Year-to-Date Increases Through June 2014 Over 2013 1. Obetz: +42.1% 2. Downtown: +13.4% 3. Grove City: +11.0% 4. New Albany: +2.8% 5. Reynoldsburg: -0.4% 6. Westerville: -3.2% 7. Pataskala: -3.4% 8. German Village: -3.9% 9. Columbus: -5.3% 10. Clintonville: -5.8%
Average Sales June 2014 Urban: 122.3 Suburban: 55.1 Urban without Columbus: 30
Average % Change June 2014 vs. June 2013 Urban: -5.8% Suburban: -5.1% Urban without Columbus: -6.0%
Average YTD Sales Through June 2014 Urban: 545 Suburban: 222.6 Urban without Columbus: 119.2
Average YTD % Change YTD Through June 2014 Urban: -4.8% Suburban: -5.3% Urban without Columbus: -4.7%
Top 10 Average Sales Price June 2014 1. New Albany: $659,186 2. Upper Arlington: $389,575 3. Bexley: $382,496 4. Dublin: $377,541 5. German Village: $307,753 6. Downtown: $300,582 7. Worthington: $283,209 8. Grandview Heights: $246,271 9. Hilliard: $230,396 10. Gahanna: $229,845
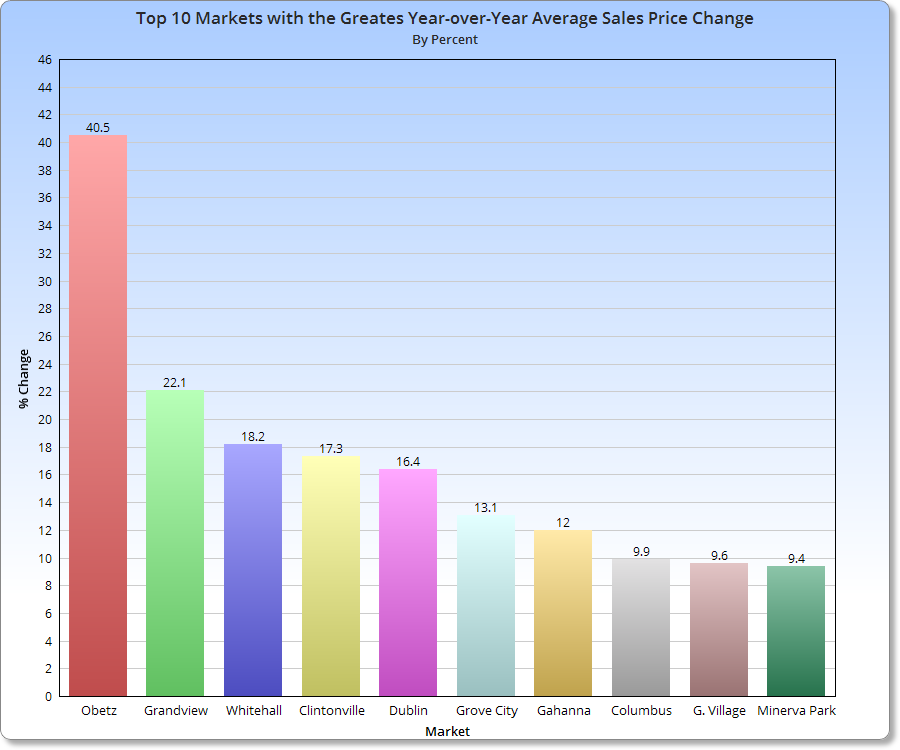
Top 10 Average Sales Price % Change June 2014 vs. June 2013 1. Whitehall: +55.6% 2. Worthington: +17.7% 3. New Albany: +15.8% 4. Bexley: +15.6% 5. Columbus: +12.2% 6. Clintonville: +9.3% 7. Hilliard: +8.5% 8. Canal Winchester: +7.4% 9. Pickerington: +6.7% 10. Gahanna: +6.4%
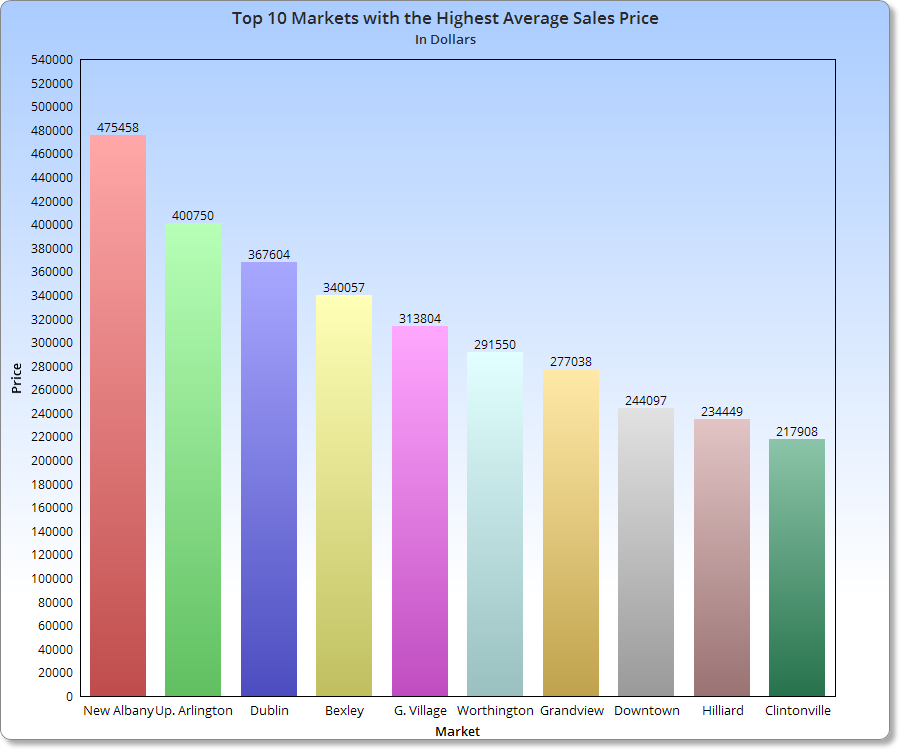
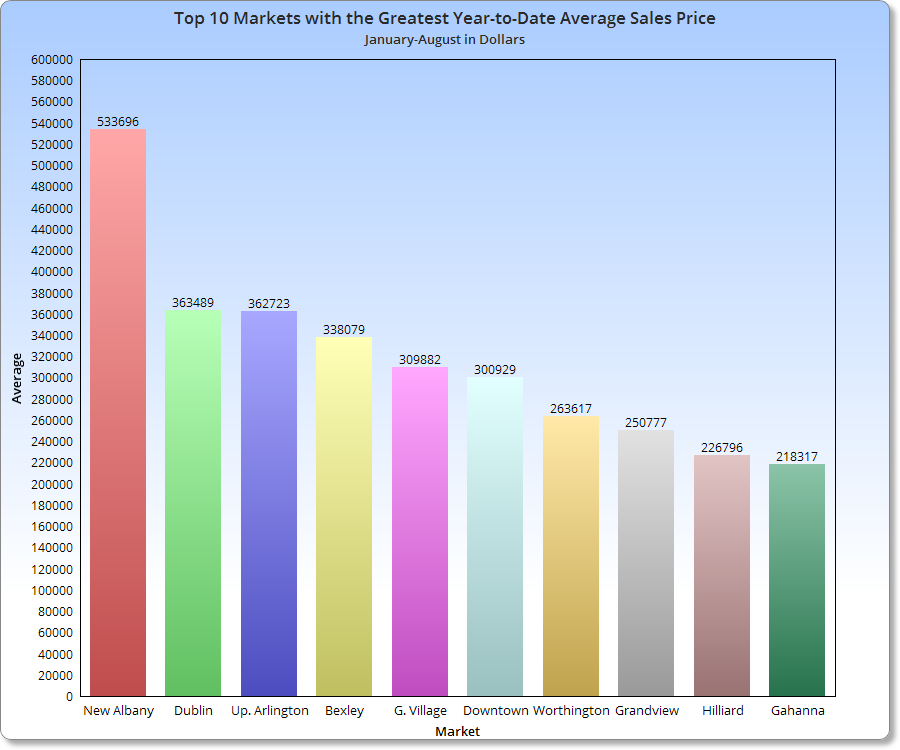
Top 10 Average Sales Prices YTD Through June 2014 1. New Albany: $541,077 2. Dublin: $360,202 3. Upper Arlington: $348,160 4. Bexley: $334,491 5. Downtown: $305,215 6. German Village: $302,117 7. Worthington: $261,659 8. Grandview Heights: $245,946 9. Hilliard: $225,849 10. Gahanna: $213,782
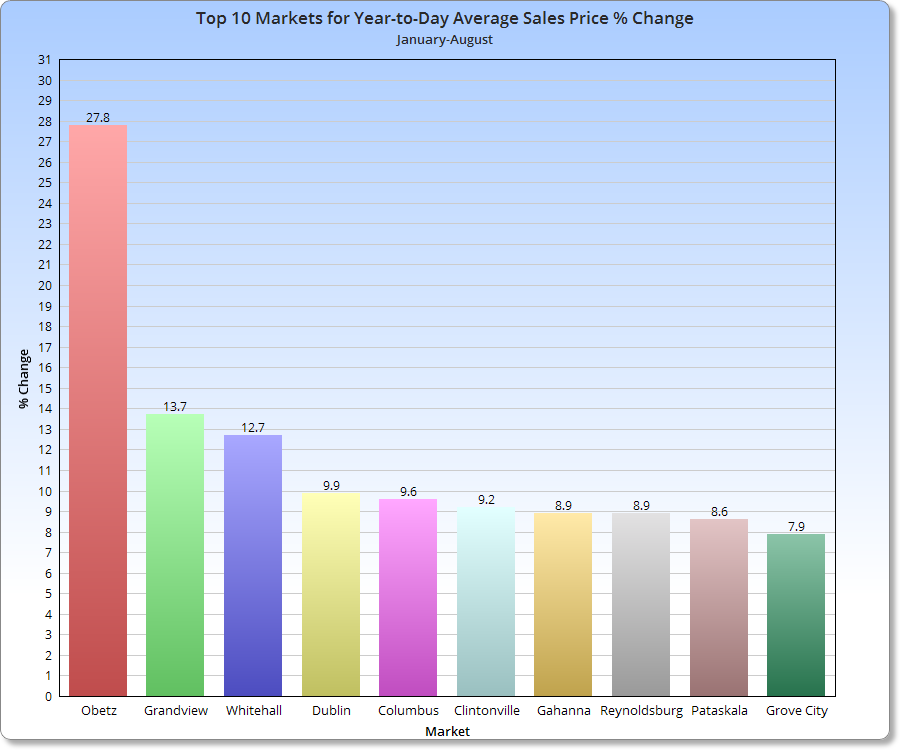
Top 10 Average YTD Sales Price % Change Through June 2014 vs. 2013 1. Obetz: +24.7% 2. Grandview Heights: +15.5% 3. Worthington: +11.3% 4. Pataskala: +10.8% 5. Columbus: +10.6% 6. Pickerington: +9.9% 7. Canal Winchester: +9.5% 8. Downtown: +9.5% 9. Dublin: +9.2% 10. Westerville: +8.5%
Average Sales Price June 2014 Urban: $232,965 Suburban: $253,488 Urban without Columbus: $240,917
Average Sales Price Change June 2014 vs. June 2013 Urban: +7.6% Suburban: +5.0% Urban without Columbus: +7.1%
Average Sales Price YTD Through June 2014 Urban: $220,893 Suburban: $234,492 Urban without Columbus: $229,327
Average Sales Price % Change YTD Through June 2014 Urban: +6.6% Suburban: +7.5% Urban without Columbus: +6.2%
Top 10 Fastest Selling Markets June 2014 (Based on Average # of Days for Listings to Sell) 1. Worthington: 21 2. Upper Arlington: 36 3. Clintonville: 38 4. Gahanna: 39 5. Hilliard: 39 6. Dublin: 40 7. German Village: 42 8. Obetz: 45 9. Bexley: 46 10. Pataskala, Westerville: 47
Average # of Days Before Sale, June 2014 Urban: 47.8 Suburban: 54.3 Urban without Columbus: 47.3
Average # of Days Before Sale YTD Through June 2014 Urban: 58.6 Suburban: 67.8 Urban without Columbus: 57.4
Top 10 Lowest Market Housing Supplies June 2014 (Based on # of Months to Sell all Listings) 1. Grandview Heights: 1.0 2. Worthington: 1.4 3. Westerville: 2.0 4. Clintonville: 2.1 5. German Village: 2.1 6. Gahanna: 2.3 7. Hilliard: 2.5 8. Minerva Park: 2.7 9. Obetz: 2.7 10. Upper Arlington: 2.7
A healthy housing supply is considered to be around 5-6 months. Anything less than 3 months is considered very low. Grandview’s 1 month is ridiculously low and the lowest reading I’ve seen for any area.
Average # of Months to Sell All Listings, June 2014 Urban: 2.7 Suburban: 3.5 Urban without Columbus: 2.6
Average % Change of Single-Family Home Sales June 2014 vs. June 2013 Urban: +33.2% Suburban: -5.4% Urban without Columbus: +36.8%
Average % Change of Single-Family Home Sales YTD Through June 2014 vs. YTD 2013 Urban: -8.8% Suburban: -5.4% Urban without Columbus: -8.9%
Average % Change of Condo Sales June 2014 vs. June 2013 Urban: -4.0% Suburban: +41.0% Urban without Columbus: -5.0%
Average % Change of Condo Sales YTD Through June 2014 vs. YTD 2013 Urban: +19.3% Suburban: +7.0% Urban without Columbus: +21.0%