King-Lincoln Neighborhood Profile


King-Lincoln neighborhood profile Columbus, Ohio

The Lincoln Theater.

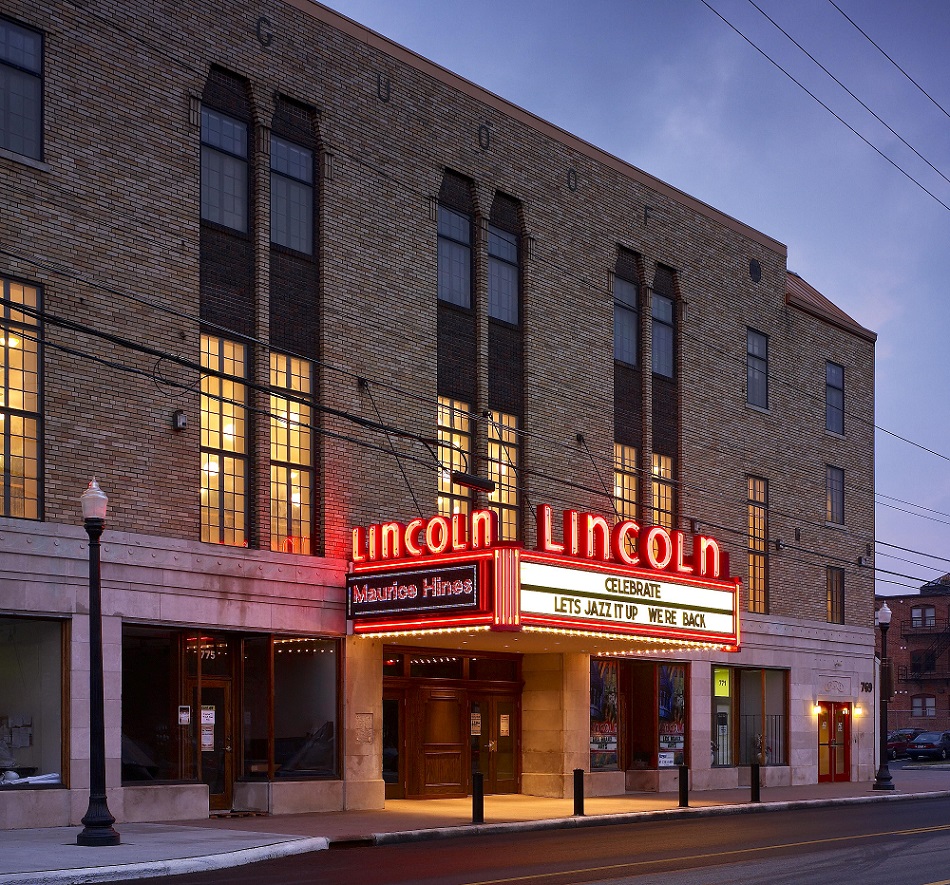
This week is Demographics week. First up, ACD’s second neighborhood profile, featuring the King-Lincoln District, Columbus’ historically African American cultural heart.

I was going to write a history for the area, but this video tells it better than I ever could.

History aside, what I can do is provide a more detailed demographic picture from the past, present and possible future of the neighborhood.

Population
1930: 17,970
1940: 18,282
1950: 20,527
1960: 17,746
1970: 11,627
1980: 9,291
1990: 8,456
2000: 8,025
2010: 6,439

Population peaked around 1950, but during the 1950s began its long-term decline. Some might say this was a product of White Flight, but in this case, the neighborhood was already almost entirely non-White. The White Flight movement was more than just about racial demographic changes in neighborhoods, it was a factor of urban neglect. Just like in the rest of urban Columbus, King-Lincoln lost its urban appeal due to infrastructure deterioration, lack of city-focused leadership, decline of schools and increasing crime rates (among other things). One of the biggest blows to the area, just like what occurred with Olde Towne East to its south, was the construction of I-71 in the early 1960s. The highway cut the neighborhood off from Downtown, demolished hundreds of historic buildings, and allowed more people to effectively leave the neighborhood altogether. This is a good reason why the population dropped by almost 35% between 1960 and 1970.

The population loss rate had been slowing down each decade through 2000. During the 2000s, the city cleared out Poindexter Village, one of Columbus’ first public-housing projects and home to several hundred residents. This accounted for a very large chunk of the loss that occurred from 2000-2010 and why the loss increased during that time. The city is now tearing the complex down with plans for mixed-use development on the site. If not for this action by the city, it’s very likely that King-Lincoln would’ve had it’s lowest total population loss since the decline began in the 1950s.

Demographics
White
1990: 6.1%
2000: 6.2%
2010: 9.6%
Black
1990: 90.7%
2000: 87.7%
2010: 84.0%
Asian
1990: 2.4%
2000: 0.7%
2010: 0.5%
Hispanic
1990: 0.6%
2000: 1.1%
2010: 2.2%
Other
1990: 0.9%
2000: 5.4%
2010: 5.9%

% Change By Demographic for Each Decade
1990-2000

White: -3.7%
Black: -8.2%
Asian: -71.6%
Hispanic: +63.0%
Other: +501.4%
2000-2010
White: +24.5%
Black: -23.1%
Asian: -42.1%
Hispanic: +60.2%
Other: -11.8%
The demographics for the last 30 years show Hispanic and White populations are becoming an ever larger chunk of the neighborhood, while Asians have declined significantly. The African American population is still, by far, the largest demographic, but it too is on a long-term decline. This suggests a gradual gentrification of the neighborhood.

And what of the future of the area? Significant revitalization news has been coming out in recent months. As mentioned above, the 36-building Poindexter Village, long a hot spot for crime and concentrated poverty, is currently in the process of being torn down. The site will be replaced with residential, retail, office and arts space over time. A larger area plan was recently announced here: http://www.columbusunderground.com/pact-plans-165-million-strategic-redevelopment-for-near-east-side. The $165 million plan will focus on King-Lincoln’s main thoroughfares: East Long Street, Mount Vernon Avenue and Taylor Avenue. Increasing density with mixed-use development and revitalizing the commercial corridors is a big part of the plan, as well as infrastructure and green space improvement. Smaller developments include Homeport’s housing renovations, which have been very successful so far.

So while King-Lincoln has seen better days, the neighborhood is currently in transition. 5-10 years from now, the neighborhood should be radically changed, hopefully for the better. Its proximity to Downtown and other central neighborhoods give it a great advantage as the city has become fairly popular again.


Housing Impact of Immigration


Housing impact of immigration

The Impact of Immigration on the Housing Market

For this link, you can zoom to county level and see the housing impact of immigration. Basically, the more immigration, the greater the impact.

Columbus Housing Market May 2013


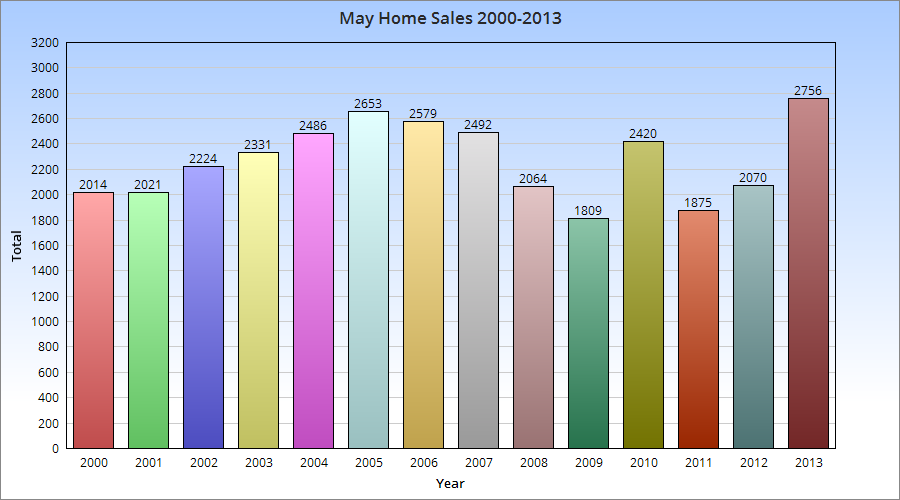
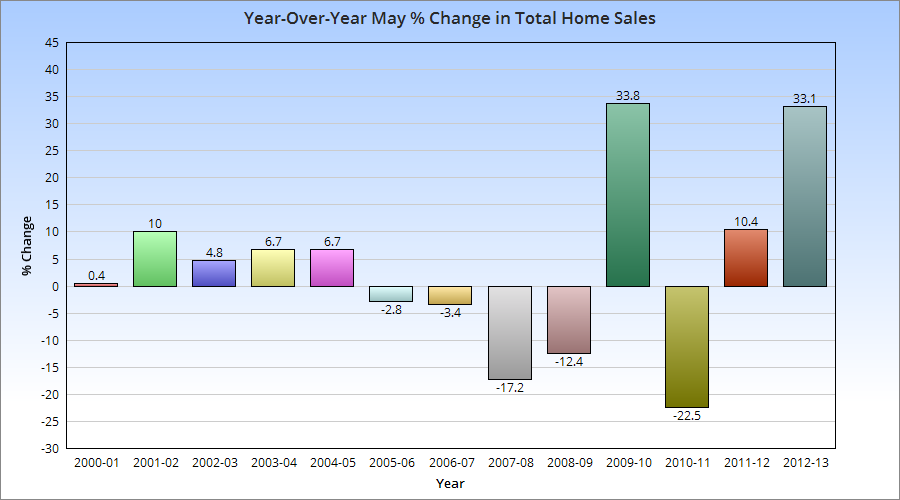
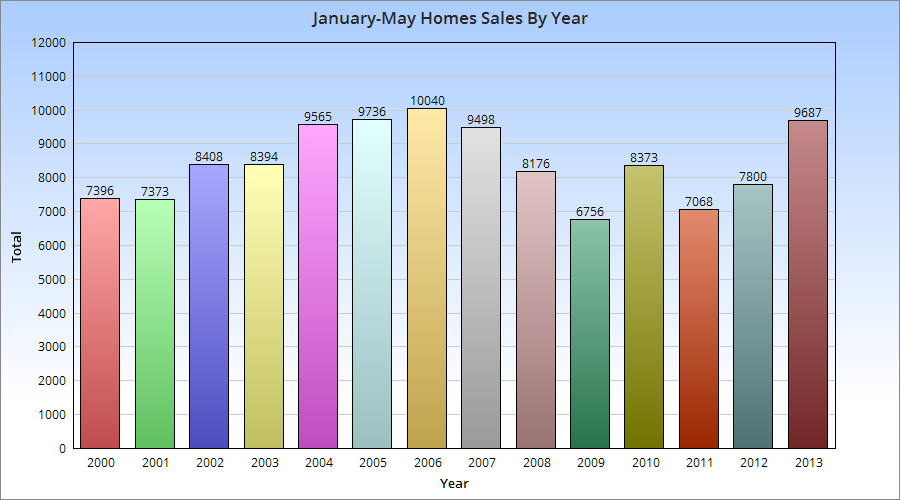
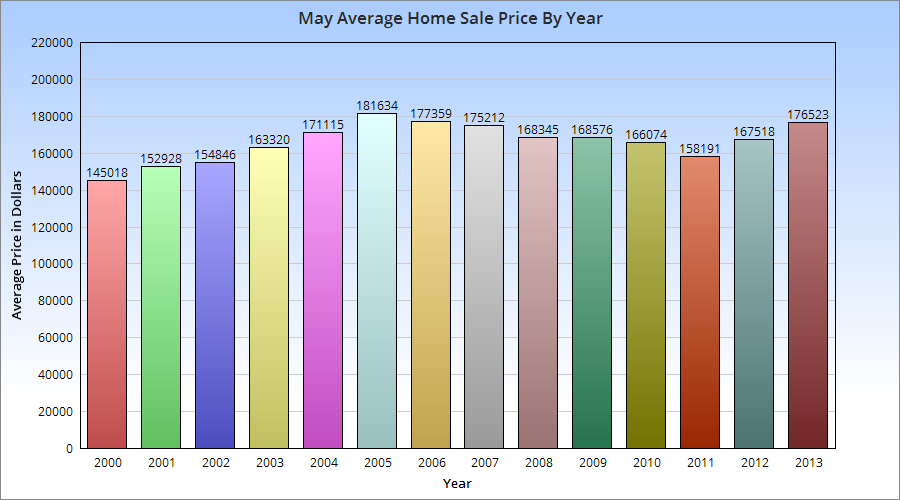
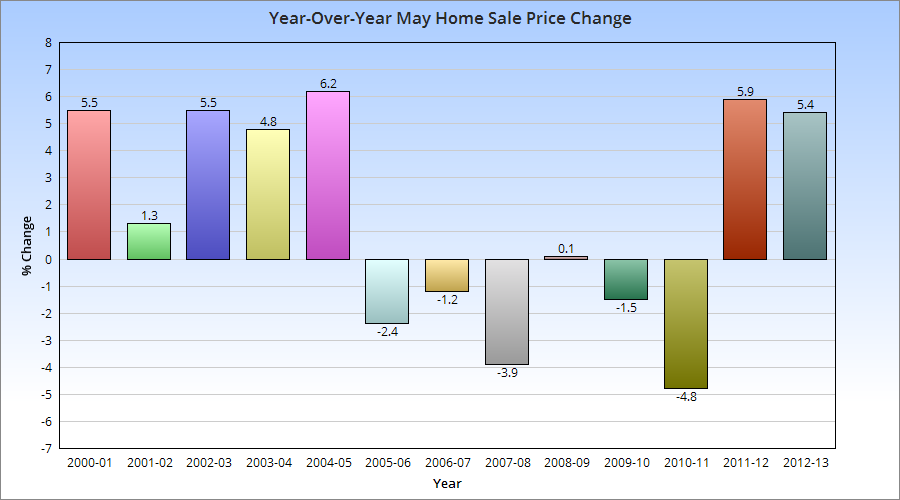
May home sales set a record for the month.
Columbus housing market May 2013

Through May, total sales are also way up, and were the 2nd highest for the 2000-2013 period.

The average May home sales price was the highest since 2006.

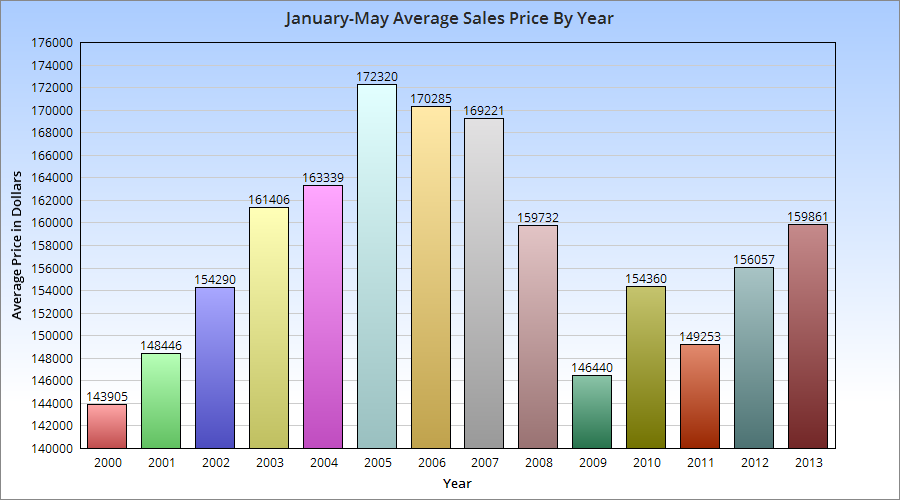
The average January-May sales price was also up.

To me, all this shows is that after the Recession’s downturn, housing in the Columbus area is seeing a strong recovery. In some cases, the recovery is already surpassing the market that existed pre-Recession.


Global Bike-Share System Map


Global bike-share system map

Global Bike Share Map

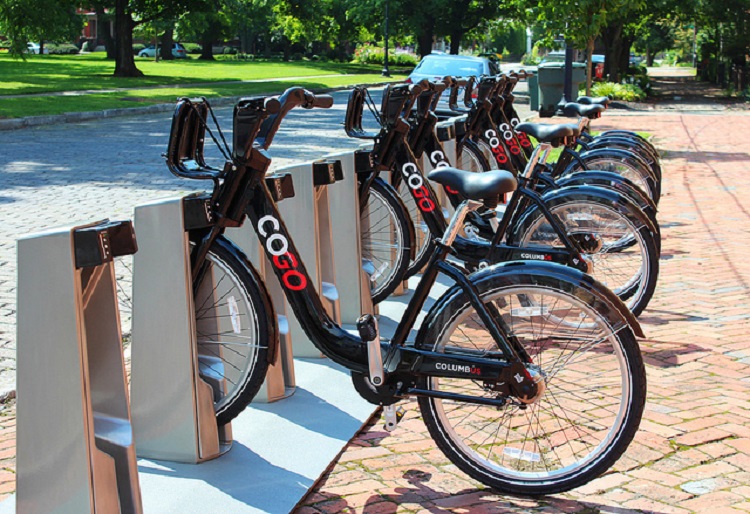
This map shows the location of every bike share system in the world. The map gives data on system size, bike availability at stations, station totals and locations. You can even pull up ridership reports and run animations! Columbus will be getting a bike share system that opens in July, so expect it to show up on this map in the coming months!

Metro Population by Distance from Downtown


Metro population by distance from downtown

One of the more interesting things the Census measures is the population from “City Hall”, or basically the metro population by distance from downtown. The metric measure population at every mile out from the center of each city’s downtown area. Since city boundaries come in all different sizes, this is a good way to compare urban populations.

I looked at the 15 largest Midwest metros for these numbers.

First, here is a breakdown of aggregate population at each mile marker in 2010. Aggregate means that with each mile added, the population within all previous miles are added together.

Mile 0
1. Chicago: 63,120
2. Minneapolis: 31,036
3. Milwaukee: 21,587
4. Cincinnati: 17,681
5. St. Louis: 17,359
6. Grand Rapids: 16,099
7. Omaha: 15,582
8. Indianapolis: 14,058
9. Kansas City: 13,709
10. Akron: 12,479
11. Cleveland: 9,471
12. Dayton: 9,182
13. Detroit: 8,709
14. Toledo: 8,304
15. Columbus: 7,416

This is a pretty bad showing in this list. In 2010, Columbus had the lowest downtown population, or population at Mile 0, of any of the largest 15 Midwest metros.

Mile 1
1. Chicago: 181,714
2. Minneapolis: 123,526
3. Milwaukee: 86,261
4. Grand Rapids: 75,613
5. Cincinnati: 65,264
6. Omaha: 56,244
7. Toledo: 55,739
8. Akron: 53,715
9. Columbus: 49,667
10. Indianapolis: 45,079
11. Dayton: 41,053
12. St. Louis: 40,184
13. Kansas City: 32,900
14. Detroit: 32,810
15. Cleveland: 32,193

By Mile 1, Columbus starts to move up rapidly, however.

Mile 2
1. Chicago: 318,522
2. Minneapolis: 228,927
3. Milwaukee: 208,776
4. Cincinnati: 138,235
5. Columbus: 134,826
6. Grand Rapids: 127,535
7. Akron: 122,395
8. Omaha: 113,044
9. Indianapolis: 102,412
10. Dayton: 101,817
11. Toledo: 94,058
12. St. Louis: 94,038
13. Kansas City: 77,388
14. Cleveland: 64,721
15. Detroit: 64,046

Mile 3
1. Chicago: 508,949
2. Minneapolis: 325,198
3. Milwaukee: 319,111
4. Columbus: 221,466
5. Cincinnati: 205,624
6. Grand Rapids: 184,887
7. Akron: 177,674
8. Omaha: 168,724
9. Toledo: 166,569
10. Indianapolis: 166,266
11. St. Louis: 160,117
12. Kansas City: 155,802
13. Dayton: 152,789
14. Cleveland: 139,945
15. Detroit: 109,104

Mile 4
1. Chicago: 764,400
2. Minneapolis: 448,499
3. Milwaukee: 438,629
4. Cincinnati: 315,665
5. Columbus: 314,557
6. Omaha: 253,723
7. St. Louis: 251,432
8. Grand Rapids: 247,473
9. Indianapolis: 240,970
10. Akron: 227,825
11. Cleveland: 227,309
12. Kansas City: 216,483
13. Dayton: 214,614
14. Toledo: 213,529
15. Detroit: 198,341

Mile 5
1. Chicago: 1,067,434
2. Minneapolis: 585,588
3. Milwaukee: 552,064
4. Columbus: 404,642
5. Cincinnati: 400,254
6. Cleveland: 361,475
7. St. Louis: 336,573
8. Indianapolis: 320,919
9. Omaha: 311,189
10. Grand Rapids: 305,307
11. Akron: 296,787
12. Detroit: 282,986
13. Toledo: 271,187
14. Kansas City: 269,936
15. Dayton: 262,069

So while Columbus’ downtown is down at the bottom in this list to start, it ends up being a top 5 within just a few miles. Clearly, though, the city needs to do better at getting people in the center.

What about further out? Let’s keep going.

Mile 10
1. Chicago: 2,763,025
2. Minneapolis: 1,312,640
3. Detroit: 1,053,920
4. Columbus: 993,957
5. Milwaukee: 944,415
6. Cleveland: 918,511
7. Indianapolis: 871,050
8. St. Louis: 864,336
9. Cincinnati: 862,932
10. Kansas City: 797,442
11. Omaha: 588,484
12. Dayton: 586,178
13. Akron: 502,710
14. Grand Rapids: 482,599
15. Toledo: 454,859

Mile 20
1. Chicago: 4,738,903
2. Detroit: 2,663,489
3. Minneapolis: 2,542,565
4. St. Louis: 1,878,365
5. Kansas City: 1,618,823
6. Cincinnati: 1,592,905
7. Cleveland: 1,549,799
8. Indianapolis: 1,511,675
9. Columbus: 1,432,067
10. Milwaukee: 1,317,062
11. Omaha: 788,498
12. Dayton: 757,623
13. Akron: 673,654
14. Grand Rapids: 602,220
15. Toledo: 558,219

Columbus seems to hold its own from Mile 2 through about Mile 15 or 16, and then begins to fall back as full metro populations begin to take shape.

So now we know the exact populations by distance, but what about how those are changing over time? Here are the same miles and their total change from 2000 to 2010.

Aggregate Change 2000-2010
By Mile 1

1. Chicago: 48,288
2. Minneapolis: 7,969
3. St. Louis: 5,881
4. Cleveland: 3,174
5. Milwaukee: 2,250
6. Kansas City: 1,009
7. Omaha: -53
8. Columbus: -1,049
9. Detroit: -3,601
10. Indianapolis: -4,739
11. Grand Rapids: -5,236
12. Cincinnati: -6,112
13. Akron: -8,916
14. Toledo: -10,118
15. Dayton: -10,165

By Mile 2
1. Chicago: 31,824
2. Minneapolis: 3,462
3. Omaha: 408
4. St. Louis: -1,523
5. Milwaukee: -2,399
6. Cleveland: -3,388
7. Kansas City: -4,807
8. Columbus: -6,004
9. Grand Rapids: -9,279
10. Detroit: -11,019
11. Indianapolis: -15,532
12. Cincinnati: -15,749
13. Akron: -15,874
14. Toledo: -16,771
15. Dayton: -20,826

By Mile 3
1. Chicago: 13,414
2. Minneapolis: 257
3. Omaha: -28
4. Milwaukee: -4,550
5. Columbus: -8,509
6. Grand Rapids: -8,818
7. St. Louis: -12,153
8. Kansas City: -14,528
9. Akron: -18,107
10. Toledo: -21,469
11. Cleveland: -23,287
12. Indianapolis: -23,973
13. Cincinnati: -24,548
14. Dayton: -27,652
15. Detroit: -29,905

By Mile 4
1. Minneapolis: 2,381
2. Omaha: 1,376
3. Milwaukee: -4,943
4. Grand Rapids: -8,612
5. Columbus: -9,650
6. Chicago: -12,130
7. Kansas City: -17,813
8. Akron: -18,533
9. Toledo: -22,039
10. St. Louis: -22,415
11. Indianapolis: -27,912
12. Dayton: -31,173
13. Cincinnati: -32,342
14. Cleveland: -41,948
15. Detroit: -61,209

By Mile 5
1. Omaha: 1,800
2. Minneapolis: 1,798
3. Milwaukee: -4,090
4. Columbus: -7,924
5. Grand Rapids: -8,112
6. Akron: -19,405
7. Kansas City: -21,986
8. Toledo: -26,094
9. Indianapolis: -28,401
10. Dayton: -33,066
11. St. Louis: 35,038
12. Cincinnati: -38,698
13. Chicago: -48,898
14. Cleveland: -70,067
15. Detroit: -89,973

By Mile 10
1. Columbus: 59,873
2. Indianapolis: 37,721
3. Omaha: 25,330
4. Grand Rapids: 10,284
5. Minneapolis: -1,544
6. Milwaukee: -2,369
7. Akron: -6,207
8. Dayton: -17,223
9. Kansas City: -19,048
10. Toledo: -21,636
11. Cincinnati: -39,767
12. St. Louis: -58,549
13. Cleveland: -120,862
14. Chicago: -172,571
15. Detroit: -239,616

By Mile 20
1. Indianapolis: 213,270
2. Columbus: 183,014
3. Kansas City: 144,634
4. Minneapolis: 141,652
5. Omaha: 97,813
6. Cincinnati: 46,813
7. Milwaukee: 27,876
8. Grand Rapids: 24,505
9. Akron: 8,625
10. Dayton: -7,484
11. Toledo: -9,112
12. St. Louis: -21,917
13. Cleveland: -88,522
14. Chicago: -215,802
15. Detroit: -291,258

Metro Area Demographics provides a greater picture of the Columbus metro’s population and demographic data.