The weekly update for June 3-6 continues to show progress on the site’s restoration. This included the following: -The Completed Development page received extensive additions for the years 2015-2019. -The January Weather records page was fully restored and includes 2019 data. -The Columbus Tornado History page got a large addition. -A few new graphs were added to the Columbus City Demographics page. -Columbus Transportation History received multiple entries. -Odds and ends were added to several other pages across the site.
On April 22nd of this year, All Columbus Data suffered a major hack. Several attempts were made to restore the website in full and to save the content through backups. At least twice, the site was restored only for it to fall back into the hacked configuration- some kind of jewelry website. Eventually, it was determined that there was corruption within the core files themselves, and since it could not be safely determined which ones, the host refused to restore any of the original content, as the attack was malicious enough to threaten the hosting servers themselves. So, the site was completely scrubbed and at least some of the original content that was not otherwise saved on archived websites was lost. After 7 years of work, it was a sickening result. Now, the rebuilding process has begun. Fortunately, a lot of the core lost data much of the site was built upon still existed in my own personal files, so for many of the pages, it’s simply a matter of putting that information back up on new pages. That is what I’ve been working on this week. Here is what I’ve done so far this week:
-2 new articles were added. -Monthly weather pages for April and May have been restored, complete with updated data for 2019. -Several pages within the Historic Building Database have had at least a few buildings added. -Partially restored the Completed page for Columbus Development . -Added several population graphs to the Columbus city, county and metro area demographics pages. -Partially restored- and expanded- the Columbus Tornado History page, one of All Columbus Data’s most popular.
I will continue to work to restore more pages and posts over time, but it will be an extended process.
And here were the top 25 cities with the highest numeric growth 2010-2018. 1. Columbus: +105,500 2. Hilliard: +7,979 3. Dublin: +6,896 4. Grove City: +6,050 5. Cincinnati: +5,662 6. Delaware: +5,177 7. North Ridgeville: +4,424 8. Westerville: +4,267 9. New Albany: +3,165 10. Pickerington: +2,910 11. Mason: +2,874 12. Newark: +2,456 13. Reynoldsburg: +2,385 14. Gahanna: +2,303 15. Wadsworth: +2,214 16. Beavercreek: +2,198 17. Marysville: +2,173 18. Avon: +2,070 19. Powell: +1,809 20. Grandview Heights: +1,785 21. Upper Arlington: +1,751 22. Harrison: +1,711 23. Lancaster: +1,634 24. Oxford: +1,514 25. Sunbury: +1,485
Columbus’ growth is very impressive in Ohio, but it has also been a top 15 fastest-growing city in the country for the past few years now, and there appears to be little standing in the way of that continuing.
Columbus’s foreign-born population origins are much more varied, and the overall population larger, than what one might expect. As of 2017, they made up 12% of the city’s population, the highest in more than 100 years. I’ve looked at such numbers before, but I wanted to update for the most recent available numbers.
A lot has happened in the past week, so Week in Review 4 is jammed full with site updates.
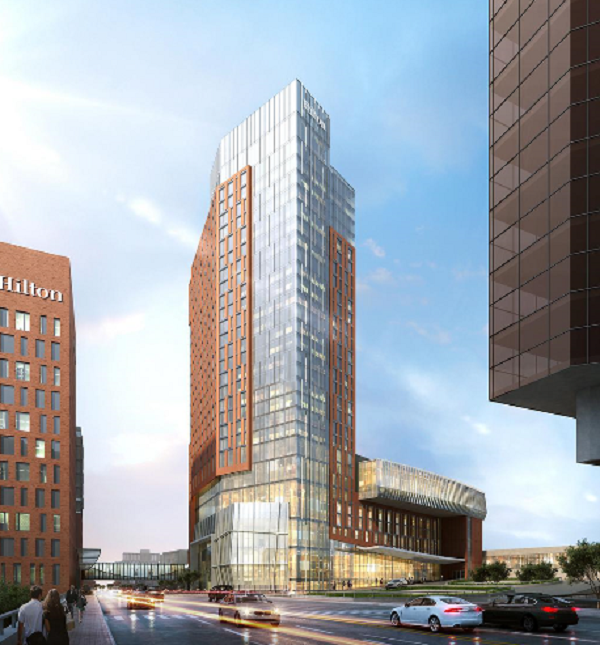
First up, the proposed new Hilton Hotel at the Convention Center continues to get taller, and now stands currently proposed for 28 stories. Construction is not set to begin until possibly next fall, so we have a while to see if any further changes occur.
The latest rendering.
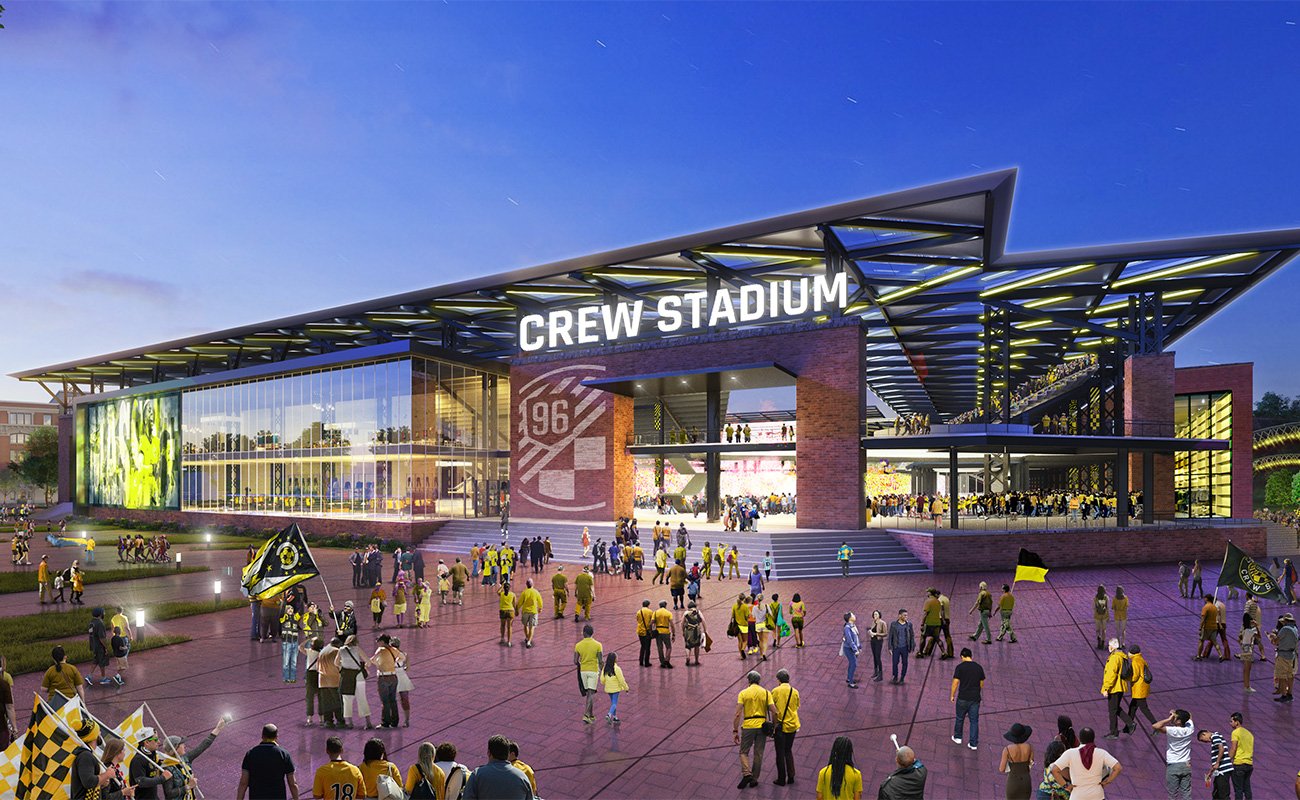
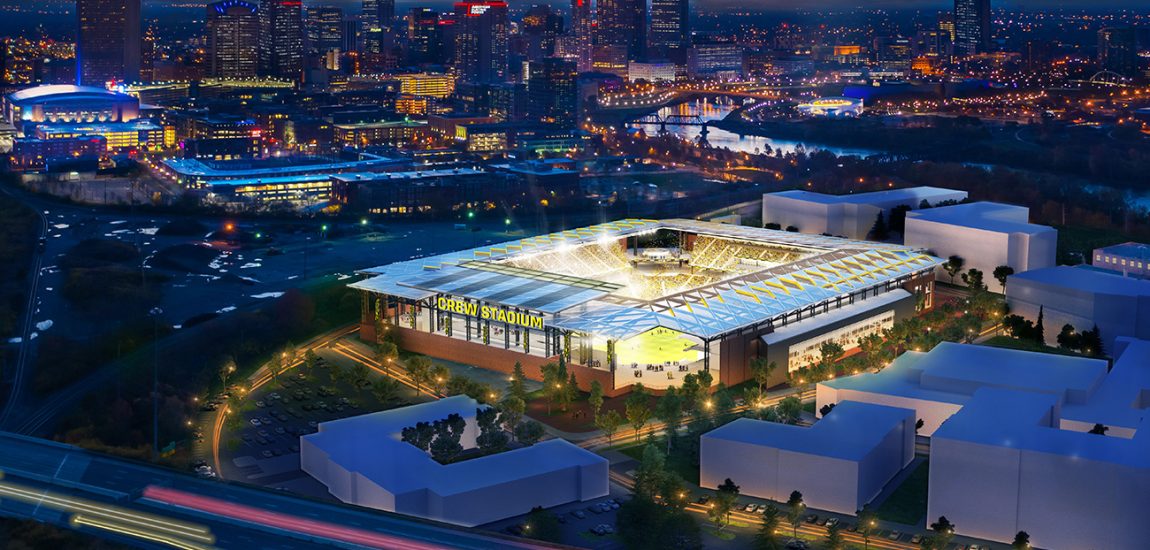
Crew fans got huge news a few months back that a new ownership group was looking to buy the team and keep them in Columbus. This week, it was announced as to what would happen to both Mapfre Stadium, as well as the first renderings and location of a brand new Arena District stadium. The new stadium would be built along with a new mixed-use neighborhood called Confluence Village. It would include offices, restaurant/retail space, 885 apartments and a riverfront park.
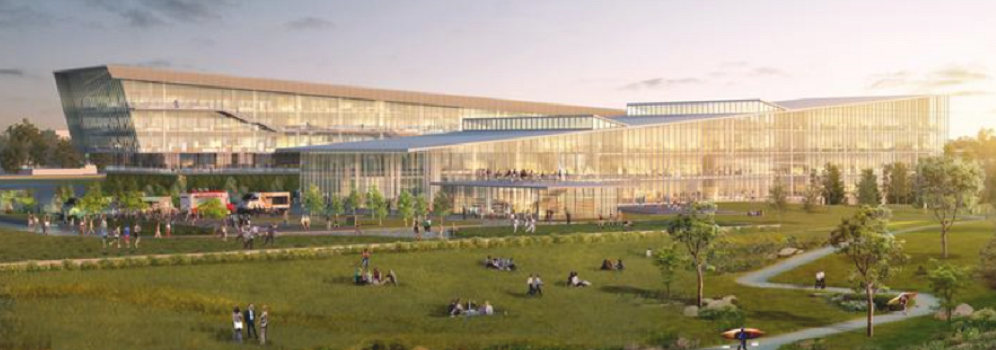
Franklinton continues to move up in the world with the new renderingsof the CoverMyMeds campus. The $240 million project would be one of the largest investment in the neighborhood in perhaps… ever.
Other news… Google may build a $600 million data center in New Albany.
And “Planet Oasis”, the proposed $2 billion entertainment complex in Delaware county, still looks unlikely to happen as the feud between its former development partners continues.
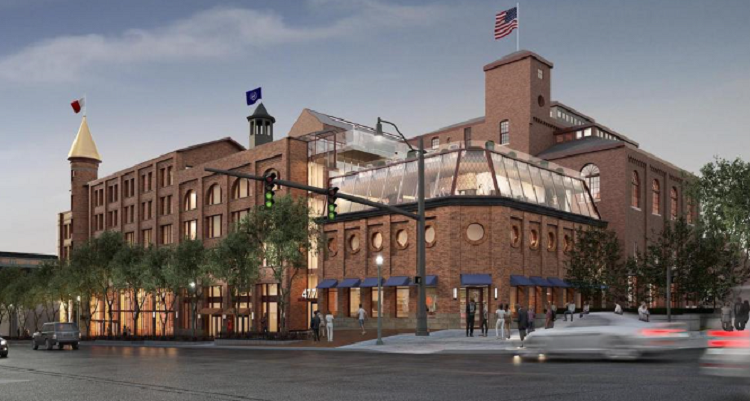
The oldest buildings on Capital Square finally received some funding for the proposal to renovate them into office space. The buildings date to 1869 and 1901.
The former Graham Ford dealership in Franklinton was purchased by Pizzuti Companies. The 7-acre site is to the west of 315, away from where recent development has been concentrated, so the site may remain undeveloped for a while yet. But it indicates where the future of Franklinton overall is headed.