In this first Week in Review series, we will do a quick rundown of the past week in Columbus.
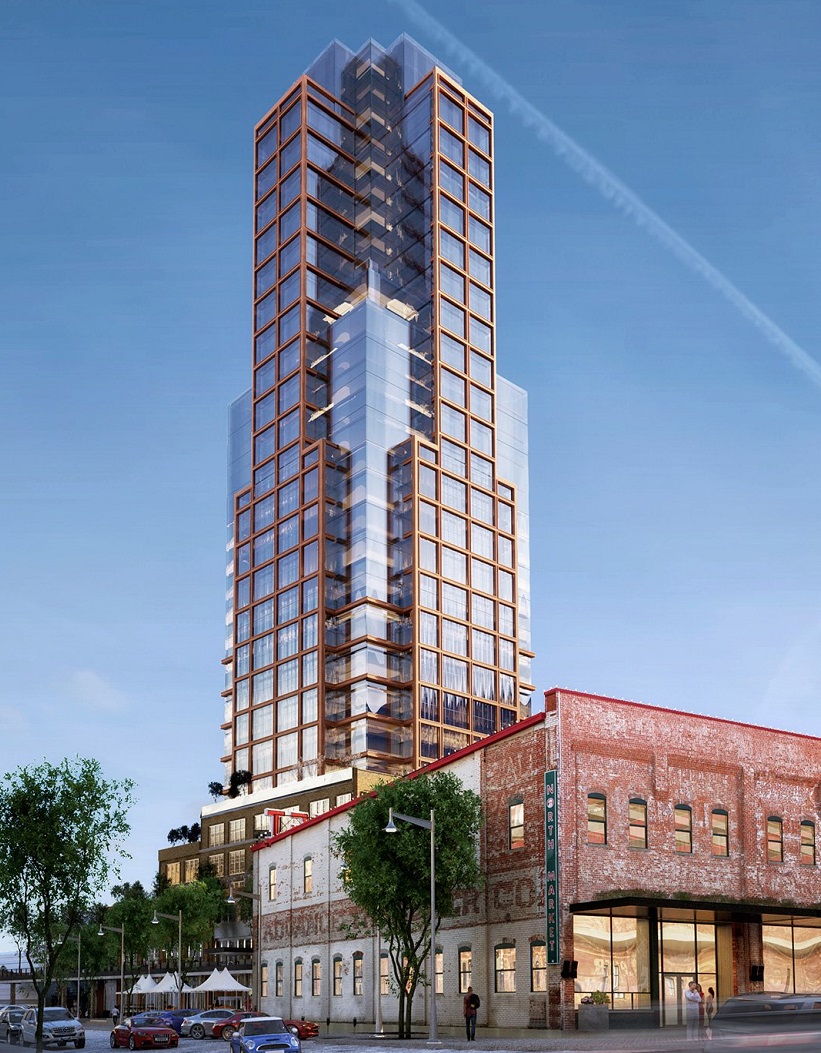
First, in terms of development, we had a few updates. -The Market Tower project at the North Market has apparently gotten a new design. It’s gone from this-
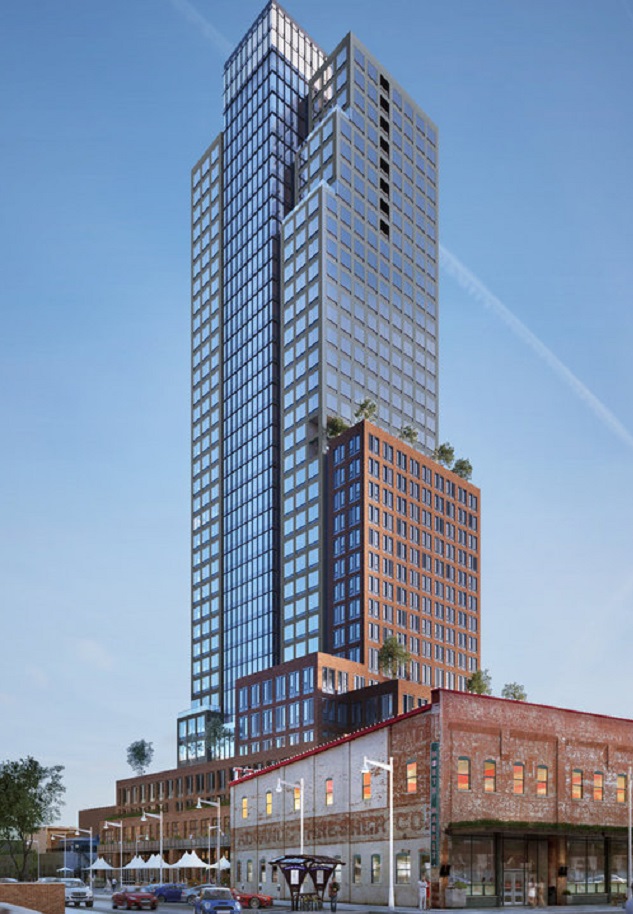
To this-
The new design may actually be at least 40 stories instead of the originally-proposed 35. No official announcements on the height increase have been released, but I suspect we’ll be hearing something soon on this.
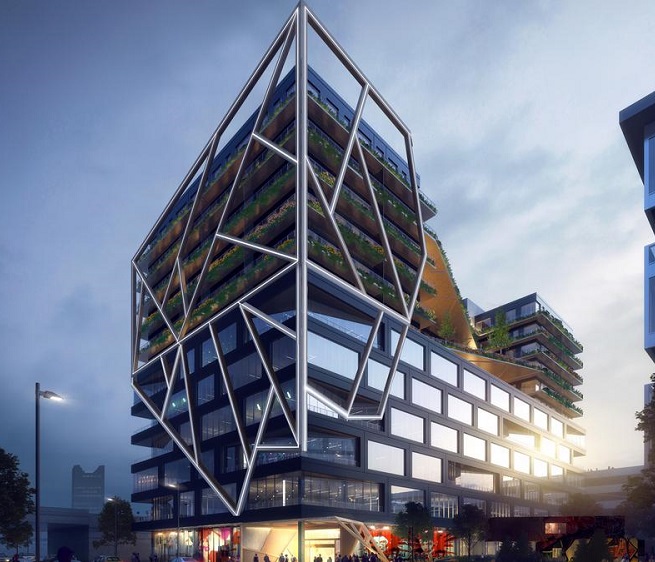
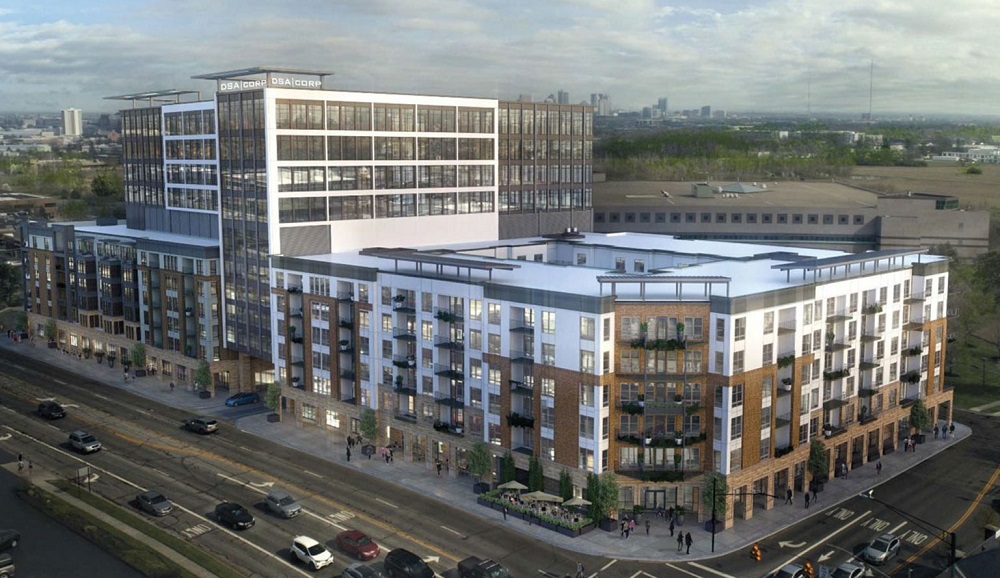
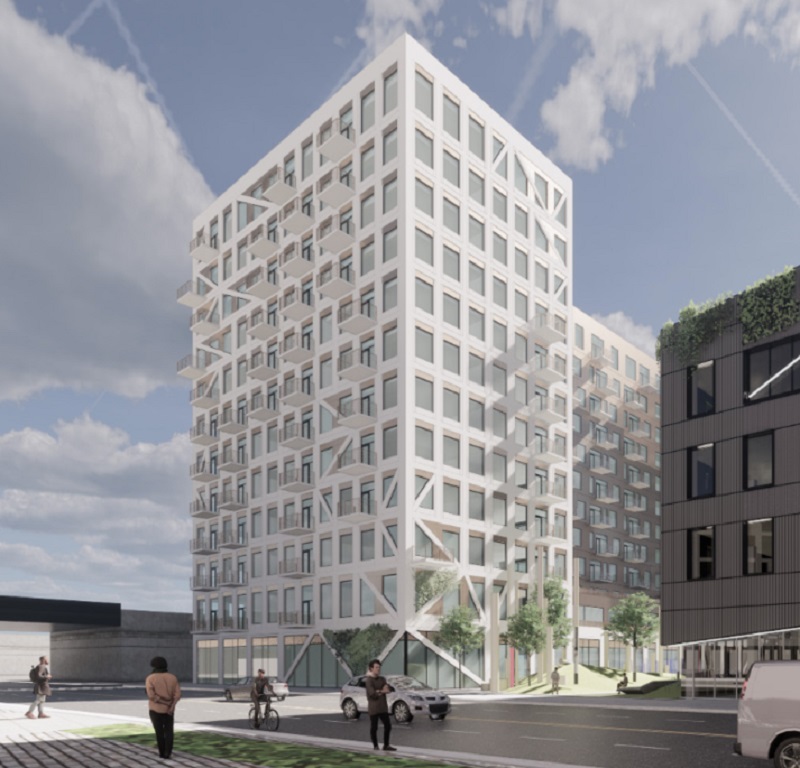
-The Gravity 2.0 project in Franklinton got its initial approvals from the neighborhood development commission, including approval on the 12-story tower, which has also gotten an updated rendering, seen below.
Given that the 2017 demographic information was released yesterday by the US Census, it’s time to revisit this Columbus foreign-born population comparison and update it with the new data.
First up, let’s take a look at total foreign-born populations. I have looked at this topic some in the past, but I have never done a full-scale comparison for this topic.
Total Foreign-Born Population Rank by City 2000, 2010 and 2017 2000—————————————-2010———————————-2017 1. Chicago, IL: 628,903———–1. Chicago: 557,674—————1. Chicago: 563,688 2. San Jose, CA: 329,750——–2. San Jose: 366,194————-2. San Jose: 417,148 3. San Antonio, TX: 133,675—-3. San Antonio: 192,741———-3. San Antonio: 212,109 4. Austin, TX: 109,006————4. Austin: 148,431——————4. Austin: 177,844 5. Las Vegas, NV: 90,656——-5. Las Vegas: 130,503————-5. Charlotte: 147,074 6. Sacramento, CA: 82,616—–6. Chalotte: 106,047—————6. Las Vegas: 139,790 7. Portland, OR: 68,976———7. Sacramento: 96,105————-7. Sacramento: 111,904 8. Charlotte, NC: 59,849——–8. Columbus: 86,663—————-8. Columbus: 105,826 9. Minneapolis, MN: 55,475—–9. Portland: 83,026—————–9. Indianapolis: 89,465 10. Columbus: 47,713———–10. Indianapolis: 74,407———–10. Portland: 89,050 11. Milwaukee, WI: 46,122—–11. Nashville: 73,327—————11. Nashville: 86,271 12. Detroit, MI: 45,541———–12. Minneapolis: 57,846———–12. Minneapolis: 69,567 13. Providence, RI: 43,947—–13. Milwaukee: 57,222————-13. Orlando: 68,811 14. St. Paul, MN: 41,138——-14. Providence: 52,920————14. St. Paul: 64,056 15. Nashville, TN: 38,936——-15. St. Paul: 50,366—————-15. Milwaukee: 59,443 16. Indianapolis, IN: 36,067—-16. Orlando: 43,747—————-16. Providence: 54,520 17. Virginia Beach, VA: 28,276–17. Virginia Beach: 40,756—–17. Omaha: 51,041 18. Wichita, KS: 27,938———18. Omaha: 39,288—————18. Virginia Beach: 42,319 19. Orlando, FL: 26,741——–19. Wichita: 39,128—————–19. Detroit: 41,374 20. Omaha, NE: 25,687———-20. Kansas City: 35,532———20. Wichita: 40,427 21. Kansas City, MO: 25,632—21. Detroit: 34,307—————-21. Kansas City: 37,833 22. Cleveland: 21,372————22. Madison: 24,929————–22. Madison: 32,066 23. Grand Rapids, MI: 20,814—23. St. Louis: 23,011————23. Des Moines: 29,876 24. St Louis, MO: 19,542——–24. Lincoln: 22,214—————24. Pittsburgh:26,504 25. Pittsburgh, PA: 18,874——-25. Des Moines: 20,798——–25. Grand Rapids: 26,014 26. Madison, WI: 18,792———26. Pittsburgh: 18,698———–26. Lincoln: 25,689 27. Des Moines, IA: 15,713—–27. Cleveland: 17,739————27. St. Louis: 23,659 28. Lincoln, NE: 13,246———-28. Grand Rapids: 16,615——-28. Fort Wayne: 22,186 29. Cincinnati: 12,461————29. Cincinnati: 16,531————29. Cleveland: 21,992 30. Fort Wayne, IN: 10,187—–30. Fort Wayne: 15,286———30. Cincinnati: 19,085 31. Toledo: 9,475——————31. Toledo: 11,159—————31. Akron: 13,423 32. Akron: 6,911——————-32. Akron: 8,524——————-32. Toledo: 11,260 33. Dayton: 3,245—————–33. Dayton: 5,102——————33. Dayton: 6,743 34. Youngstown: 1,605———-34. Youngstown: 3,695———–34. Youngstown: 1,401
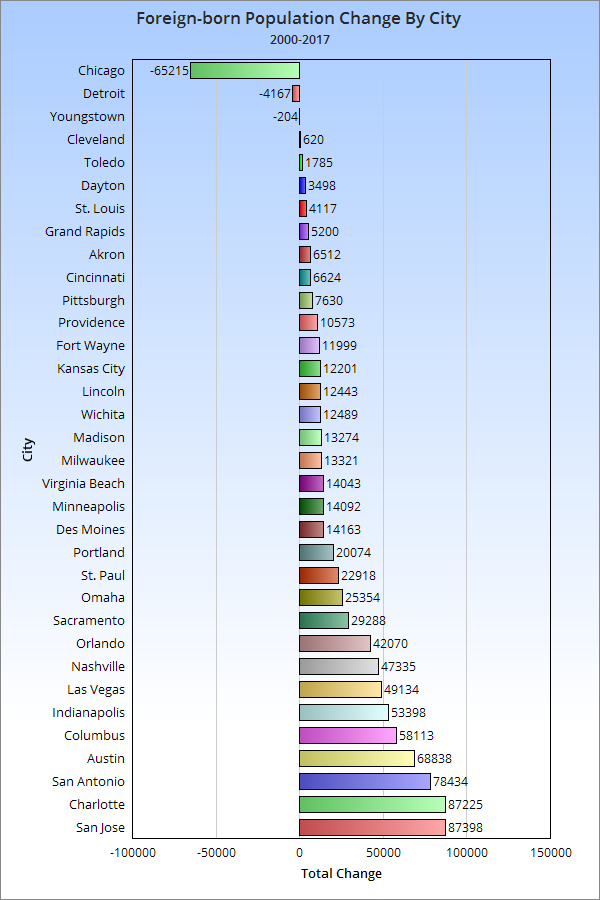
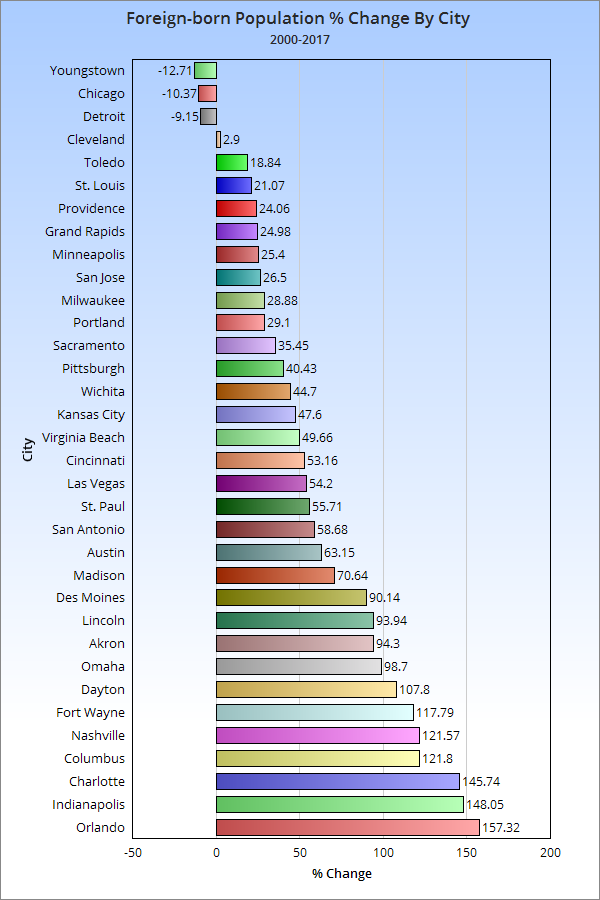
Here’s the 2000-2017 total change. And the 2000-2017 change by %.
So Columbus has had above average total and % growth compared to its peers nationally since 2000. What about more recently?
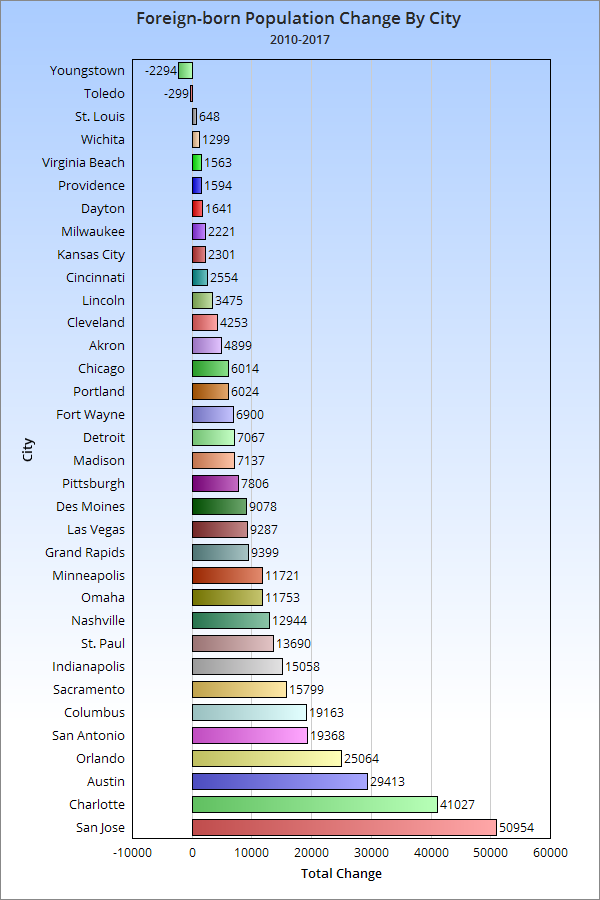
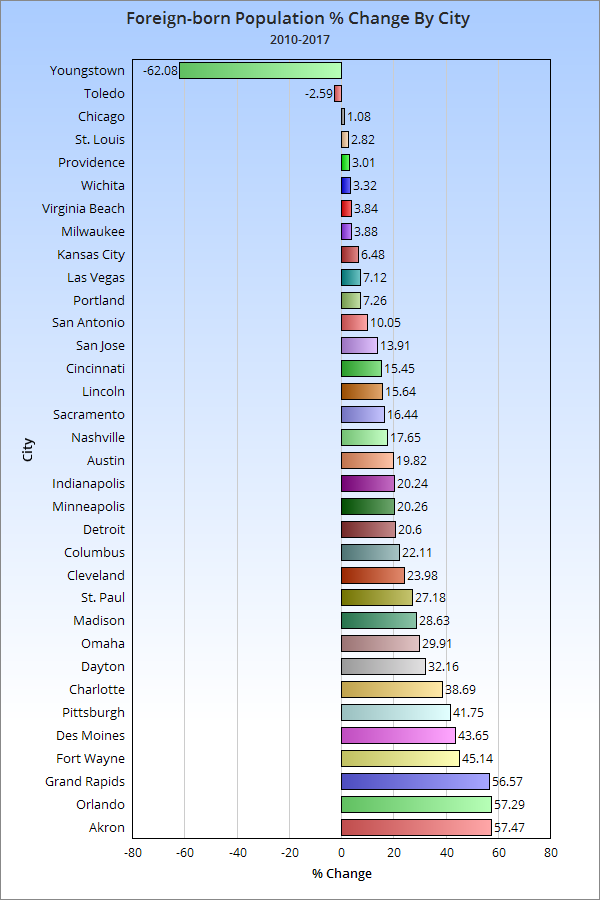
Total change 2010-2017. And the 2010-2017 change by %. So now that we know how many foreign-born immigrants are arriving, let’s take a look at where they are coming from.
Total Foreign-Born Residents From Europe in 2000 and 2017 2000———————————————–2017 1. Chicago: 145,462———————1. Chicago: 96,656 2. San Jose: 21,904———————2. San Jose: 25,147 3. Portland: 17,572———————-3. Portland: 16,548 4. Las Vegas: 9,070———————4. Austin: 13,337 5. Cleveland: 8,796———————-5. Charlotte: 9,775 6. St. Louis: 8,543———————–6. Las Vegas: 8,536 7. San Antonio: 8,323——————7. San Antonio: 7,852 8. Sacramento: 8,204——————8. Virginia Beach: 7,368 9. Milwaukee: 7,841——————–9. Columbus: 6,860 10. Charlotte: 7,487——————–10. Indianapolis: 6,344 11. Austin: 7,474————————11. Sacramento: 6,008 12. Pittsburgh: 7,413——————-12. Nashville: 5,778 13. Columbus: 7,017——————-13. Orlando: 5,516 14. Indianapolis: 6,543—————-14. Minneapolis: 5,477 15. Virginia Beach: 6,333————-15. Milwaukee: 4,388 16. Detroit: 5,600————————16. Pittsburgh: 4,265 17. Minneapolis: 5,409—————–17. Providence: 4,022 18. Providence: 5,126——————18. Lincoln: 3,908 19. Nashville: 4,859——————–19. St. Louis: 3,680 20. Cincinnati: 3,851——————-20. Cincinnati: 3,556 21. Grand Rapids: 3,396————–21. Omaha: 3,483 22. Omaha: 3,320———————–22. Cleveland: 3,399 23. St. Paul: 3,255———————-23. Kansas City: 3,362 24. Des Moines: 3,216—————-24. Madison: 2,867 25. Kansas City: 2,985—————-25. St. Paul: 2,394 26. Madison: 2,871——————–26. Detroit: 2,393 27. Lincoln: 2,701———————-27. Fort Wayne: 2,388 28. Akron: 2,687———————–28. Des Moines: 2,156 29. Orlando: 2,509——————–29. Wichita: 1,660 30. Fort Wayne: 2,076—————30. Grand Rapids: 1,517 31. Toledo: 2,020———————31. Akron: 1,286 32. Wichita: 2,004———————32. Toledo: 1,242 33. Dayton: 901———————–33. Dayton: 877 34. Youngstown: 870—————-34. Youngstown: 173
Columbus had a high number of Europeans versus most peers, but almost all cities saw drops in this demographic between 2000 and 2017, some quite drastic. Columbus’ drop was relatively minor.
Total Foreign-born Population from Asia 2000 and 2017 2000————————————————–2017 1. San Jose: 182,712—————————1. San Jose: 262,208 2. Chicago: 112,932—————————-2. Chicago: 140,434 3. Sacramento: 40,253————————-3. Austin: 57,584 4. Portland: 26,271——————————4. Sacramento: 53,731 5. Austin: 25,036——————————–5. Charlotte: 46,698 6. St. Paul: 23,245——————————6. Columbus: 43,706 7. Columbus: 22,354—————————7. San Antonio: 40,642 8. Minneapolis: 17,376————————8. Portland: 38,224 9. Las Vegas: 17,062————————–9. Las Vegas: 35,087 10. San Antonio: 15,840———————-10. St. Paul: 34,678 11. Charlotte: 15,734————————–11. Nashville: 26,155 12. Virginia Beach: 15,176——————-12. Indianapolis: 23,934 13. Detroit: 15,114——————————13. Virginia Beach: 23,625 14. Nashville: 12,573—————————14. Madison: 18,795 15. Milwaukee: 12,114————————-15. Detroit: 18,681 16. Wichita: 10,826—————————–16. Milwaukee: 17,838 17. Madison: 9,736—————————–17. Minneapolis: 15,967 18. Indianapolis: 9,190————————-18. Pittsburgh: 15,873 19. Pittsburgh: 7,938—————————-19. Wichita: 15,466 20. Providence: 7,871————————–20. Omaha: 14,504 21. Kansas City: 7,312————————-21. Lincoln: 13,804 22. Lincoln: 6,691——————————-22. Kansas City: 12,043 23. St. Louis: 6,425—————————–23. Fort Wayne: 10,972 24. Omaha: 6,302——————————-24. Des Moines: 10,691 25. Cleveland: 6,213—————————25. St. Louis: 9,632 26. Des Moines: 5,239————————26. Orlando: 8,122 27. Orlando: 4,530—————————–27. Akron: 7,862 28. Cincinnati: 4,326————————–28. Cleveland: 7,450 29. Toledo: 3,847——————————29. Providence: 6,668 30. Grand Rapids: 3,206———————30. Grand Rapids: 6,585 31. Akron: 3,099——————————-31. Toledo: 6,196 32. Fort Wayne: 2,792————————32. Cincinnati: 6,002 33. Dayton: 903———————————33. Dayton: 1,614 34. Youngstown: 338————————–34. Youngstown: 448
Columbus ranks even higher with its foreign-born Asian population.
Total Foreign-born Population from Africa 2000 and 2017 2000—————————————————2017 1. Minneapolis: 12,765——————–1. Columbus: 33,607 2. Chicago: 12,613————————-2. Chicago: 26,995 3. Columbus: 9,530————————3. Minneapolis: 25,286 4. San Jose: 5,189————————-4. Nashville: 18,387 5. Charlotte: 4,722————————–5. Charlotte: 18,234 6. St. Paul: 4,697—————————-6. Indianapolis: 17,452 7. Nashville: 4,183————————–7. St. Paul: 15,926 8. Detroit: 3,249—————————–8. Omaha: 7,496 9. Providence: 3,138———————–9. San Jose: 7,400 10. Indianapolis: 2,650——————–10. Portland: 7,059 11. Portland: 2,430————————-11. Austin: 6,469 12. Austin: 2,263—————————-12. Des Moines: 6,124 13. Kansas City: 2,192——————–13. San Antonio: 5,718 14. Cincinnati: 1,781———————–14. Kansas City: 5,051 15. St. Louis: 1,500————————-15. St. Louis: 4,977 16. Omaha: 1,497—————————16. Providence: 4,697 17. San Antonio: 1,358——————–17. Milwaukee: 4,423 18. Milwaukee: 1,332———————-18. Cincinnati: 4,207 19. Cleveland: 1,075———————–19. Grand Rapids: 3,754 20. Sacramento: 1,051——————–20. Sacramento: 2,955 21. Des Moines: 1,038——————–21. Pittsburgh: 2,731 22. Madison: 991—————————22. Cleveland: 2,728 23. Orlando: 983—————————23. Orlando: 2,552 24. Wichita: 946—————————-24. Akron: 2,311 25. Las Vegas: 916———————–25. Madison: 2,180 26. Pittsburgh: 905————————26. Wichita: 2,142 27. Virginia Beach: 840——————27. Las Vegas: 1,846 28. Grand Rapids: 718——————-28. Lincoln: 1,680 29. Toledo: 638—————————-29. Dayton: 1,397 30. Lincoln: 637—————————30. Detroit: 1,082 31. Dayton: 522—————————-31. Virginia Beach: 847 32. Fort Wayne: 384———————-32. Fort Wayne: 628 33. Akron: 197—————————–33. Toledo: 615 34. Youngstown: 50———————-34. Youngstown: 0
Columbus has claimed the number 1 spot in its foreign-born African population, passing previous top city Minneapolis.
And finally, the total foreign-born population from the Americas in 2000 and 2017 2000—————————————————-2017 1. Chicago: 357,235————————–1. Chicago: 297,926 2. San Jose: 117,989————————2. San Antonio: 157,629 3. San Antonio: 107,906——————–3. San Jose: 120,657 4. Austin: 73,935——————————4. Austin: 99,482 5. Las Vegas: 63,277————————5. Las Vegas: 93,693 6. Charlotte: 31,625————————–6. Charlotte: 72,211 7. Sacramento: 28,927———————-7. Orlando: 52,421 8. Providence: 27,649———————–8. Sacramento: 42,632 9. Milwaukee: 24,781————————9. Indianapolis: 41,554 10. Detroit: 21,527—————————10. Providence: 39,093 11. Portland: 20,939————————-11. Nashville: 35,719 12. Minneapolis: 19,648——————–12. Milwaukee: 32,630 13. Orlando: 18,639————————-13. Portland: 25,417 14. Indianapolis: 17,530——————–14. Omaha: 25,385 15. Nashville: 17,125————————15. Minneapolis: 22,688 16. Omaha: 14,467————————–16. Columbus: 21,578 17. Wichita: 13,988—————————17. Wichita: 20,983 18. Grand Rapids: 13,477——————18. Detroit: 19,143 19. Kansas City: 12,948———————19. Kansas City: 17,377 20. St. Paul: 9,804—————————-20. Grand Rapids: 14,158 21. Columbus: 8,596————————21. St. Paul: 10,878 22. Des Moines: 6,201———————-22. Des Moines: 10,627 23. Virginia Beach: 5,754——————23. Virginia Beach: 10,415 24. Cleveland: 5,192————————24. Cleveland: 8,386 25. Madison: 5,080————————–25. Fort Wayne: 8,198 26. Fort Wayne: 4,930———————-26. Madison: 8,031 27. Lincoln: 3,106—————————-27. Lincoln: 6,190 28. St. Louis: 2,961————————–28. Cincinnati: 5,320 29. Toledo: 2,942—————————-29. St. Louis: 5,008 30. Pittsburgh: 2,463————————30. Pittsburgh: 3,443 31. Cincinnati: 2,432————————31. Toledo: 3,207 32. Dayton: 919——————————32. Dayton: 2,855 33. Akron: 891——————————-33. Akron: 1,699 34. Youngstown: 333———————–34. Youngstown: 780
Columbus does the worst with this group, but even here it moved up 5 spots in the rankings.
The rest of the foreign-born population is made up of small groups of people from Oceania- or basically island nations.
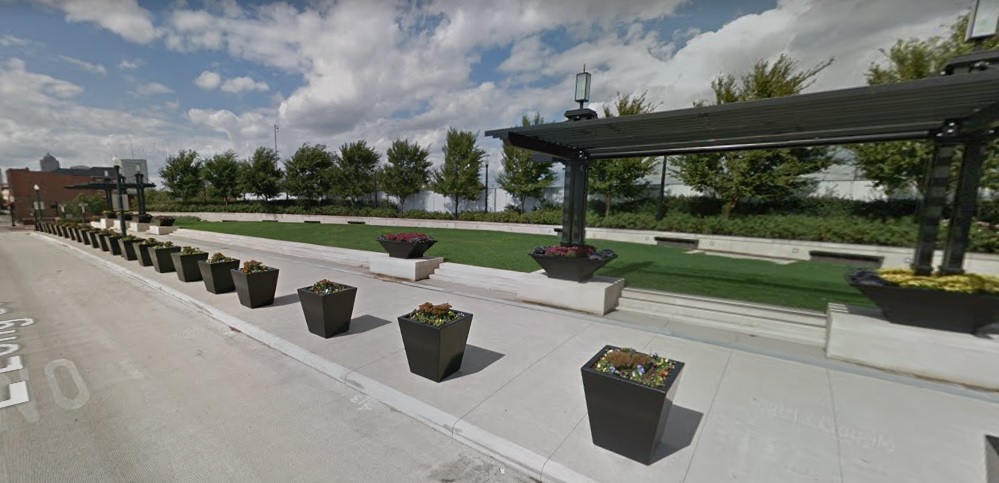
Given the popularity of the Weinland Park Before and After, I am finally getting around to posting this one for the Near East Side, which is a combination of Olde Towne East and King-Lincoln. Like Weinland Park, the NES has seen its fair share of struggles over the years, but unlike Weinland Park, its revitalization has been decades in the making. It has seen steady house-to-house renovations since at least the 1980s, and is now at the point where the pace of larger scale redevelopment is picking up. There are currently at least a dozen infill projects in the works, with even more renovations.
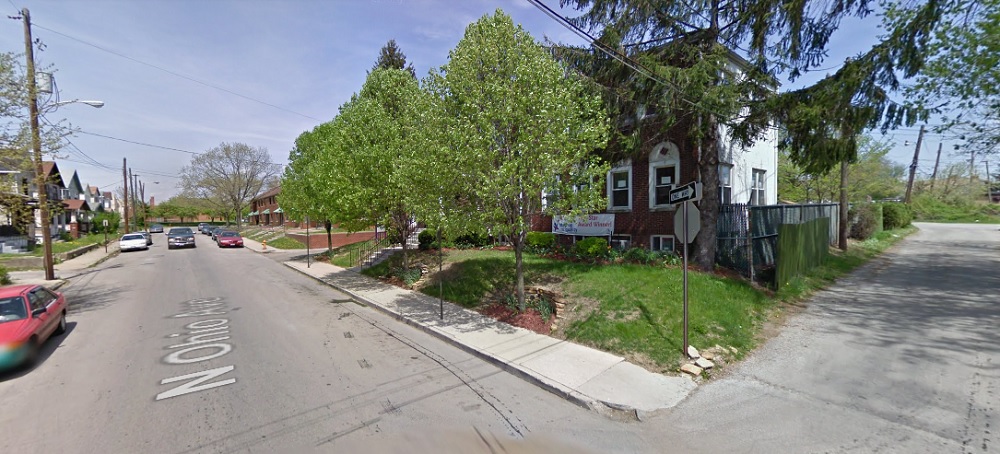
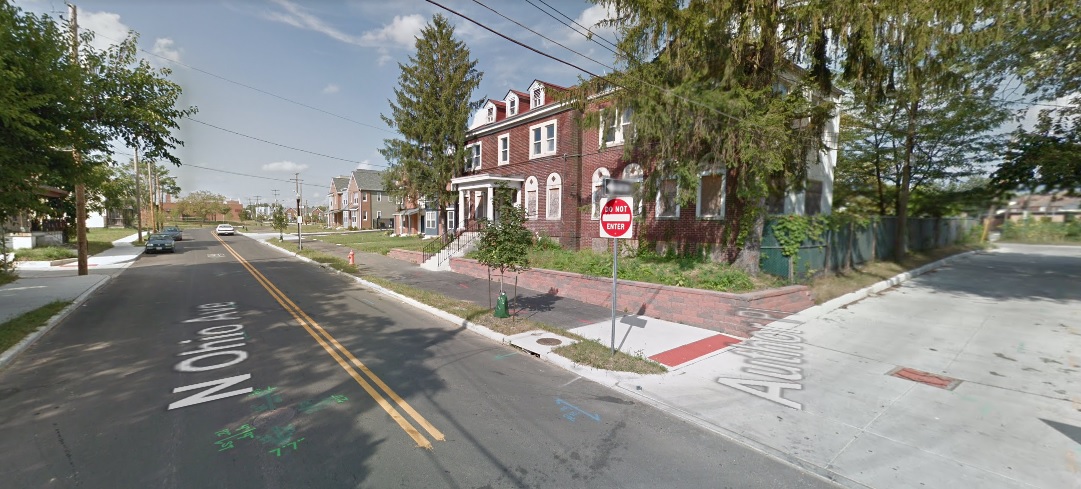
North Ohio Avenue Before: 2009 North Ohio Avenue looking north. After: 2017 These photos don’t represent all that big a change, but it shows some of the infrastructure improvements going on around the neighborhood. This picture is just south of the Poindexter Place development on North Ohio Avenue. The photos show the addition of a multi-use path, new sidewalks and pavement. Bike lanes, which aren’t shown in the Google image, were also striped.
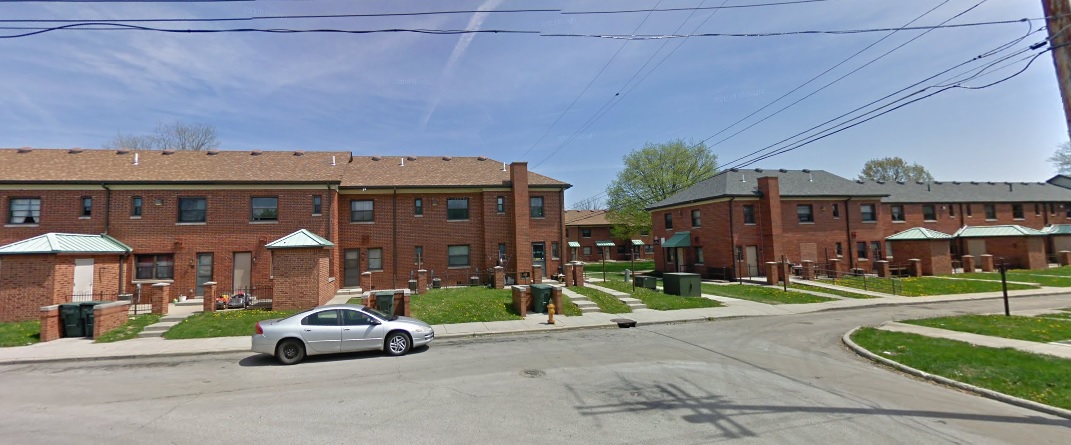
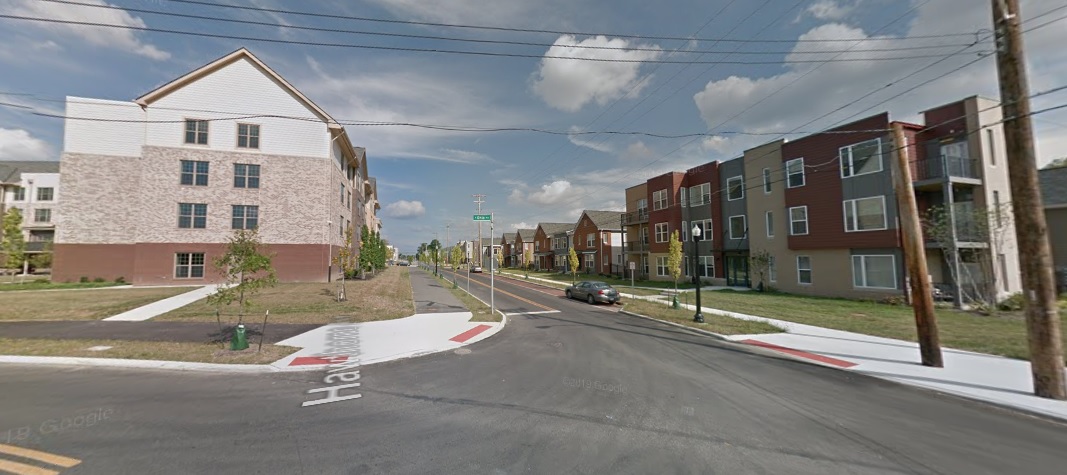
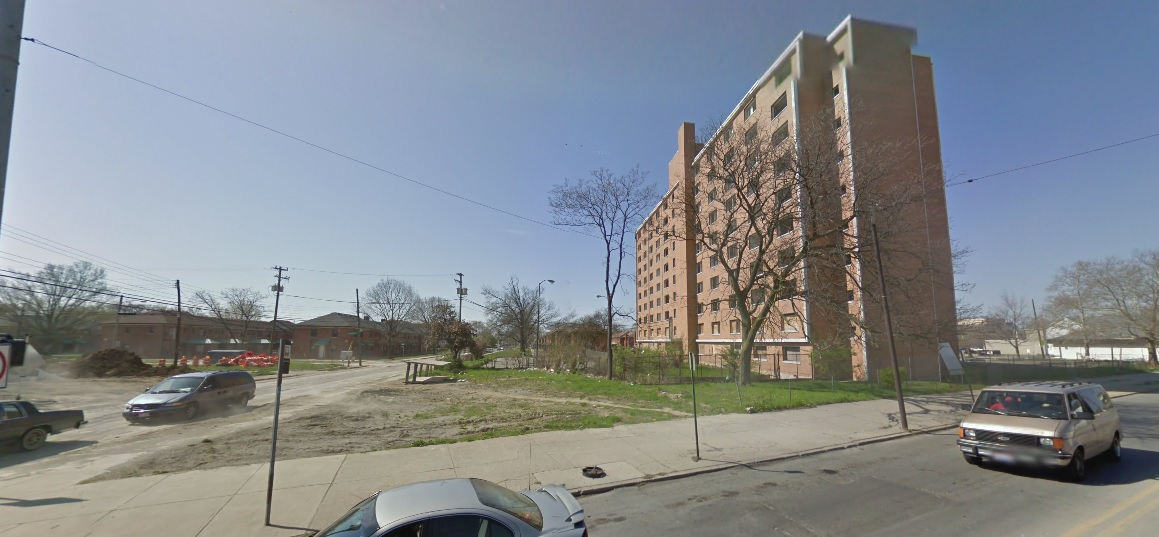
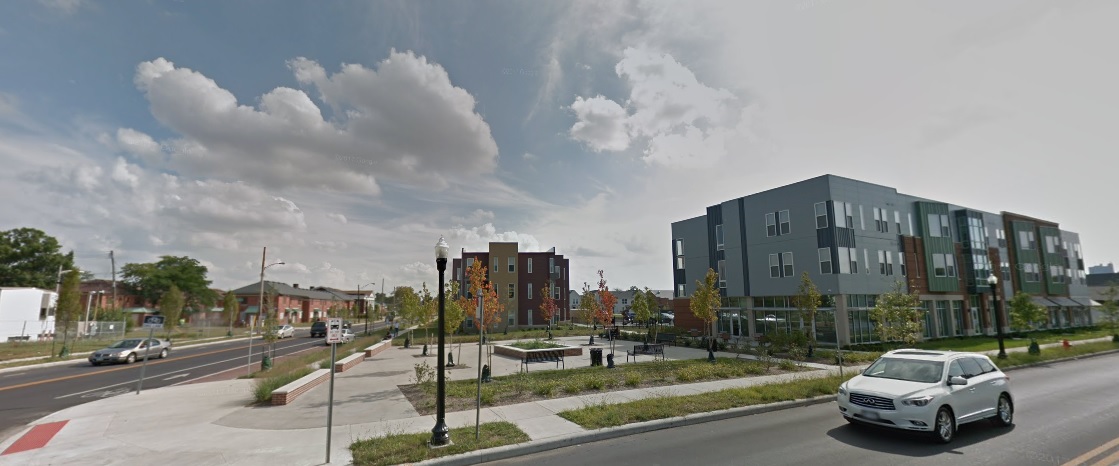
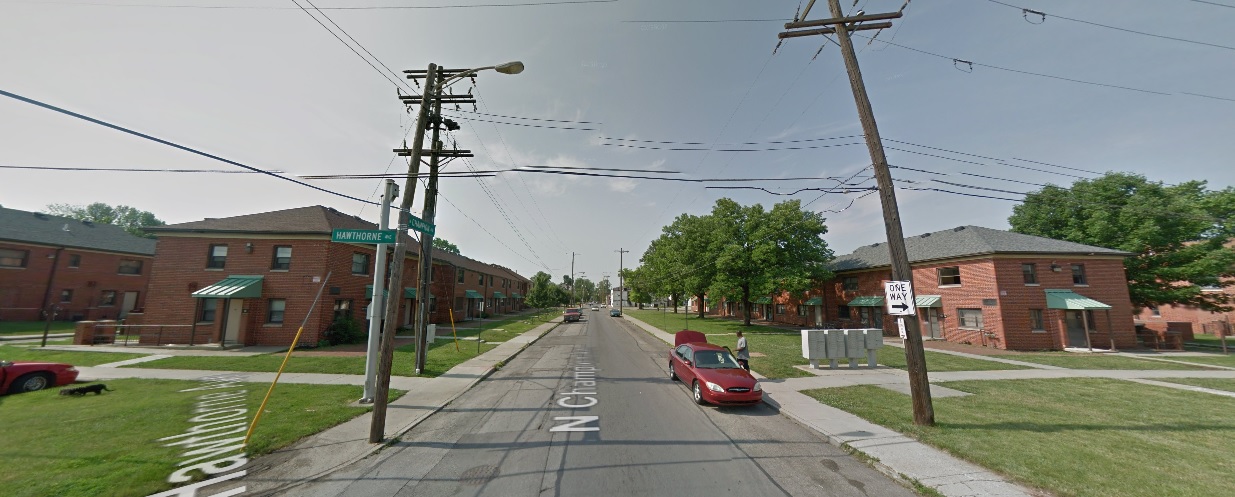
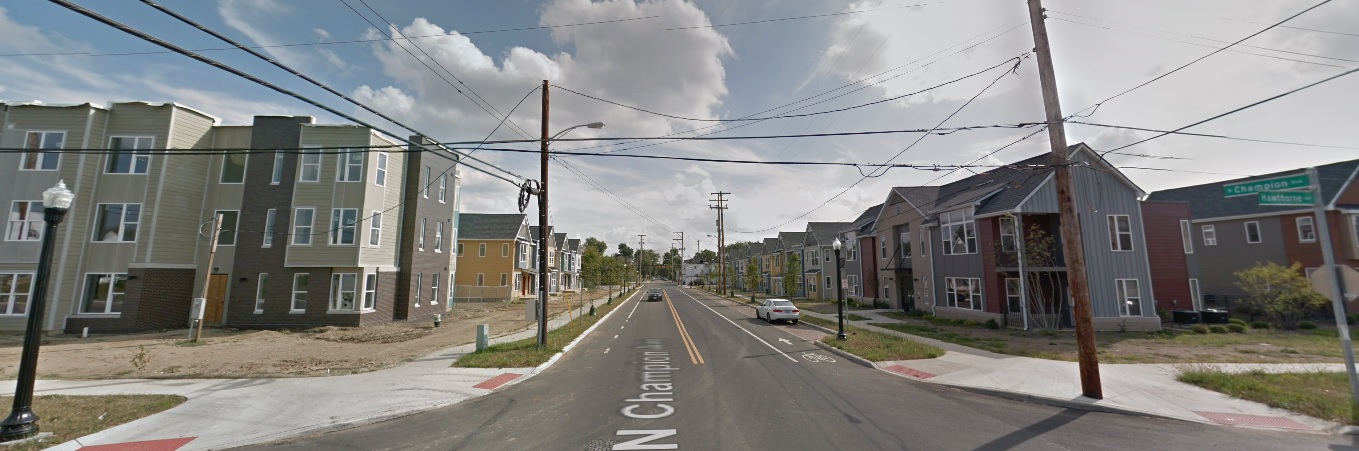
Poindexter Village Before: 2009 North Ohio and Hawthorne, looking east. After: 2017 Poindexter Village was the first large-scale public housing complex in Columbus, built back in the 1940s. All but 2 of the original buildings were torn down to make room for a redevelopment, called Poindexter Place. The last 2 buildings will become a museum. The change from 2009 to 2017 is drastic. Before: 2009 Champion and Mt. Vernon, looking southeast. After: 2017 Before: 2011 Champion Avenue and Hawthorne Avenue looking south. After: 2017
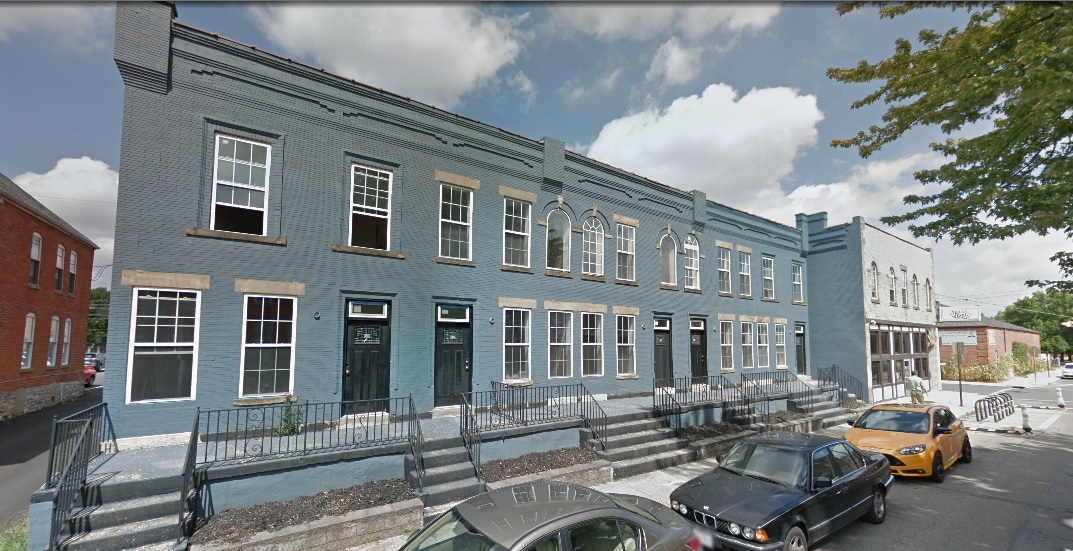
Oak Street Before: 2009 Oak and 18th looking northeast. After: 2017
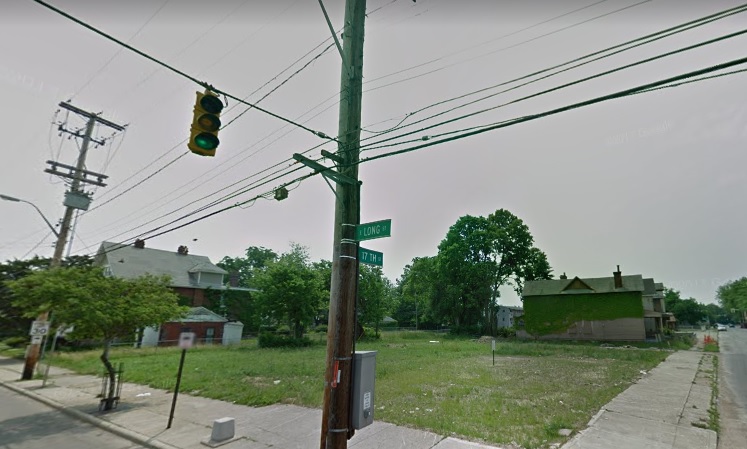
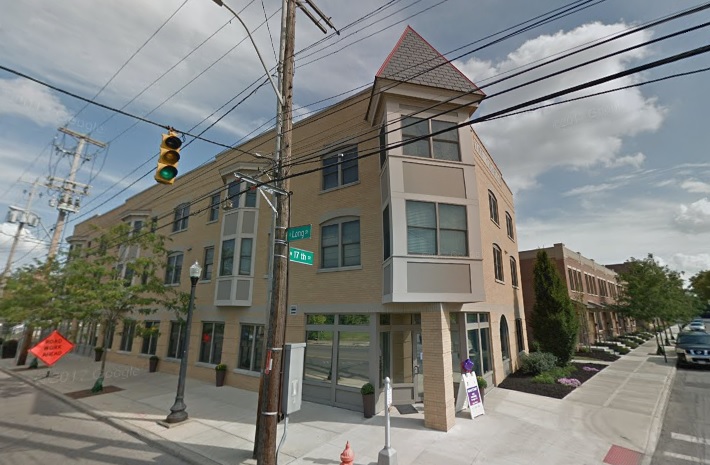
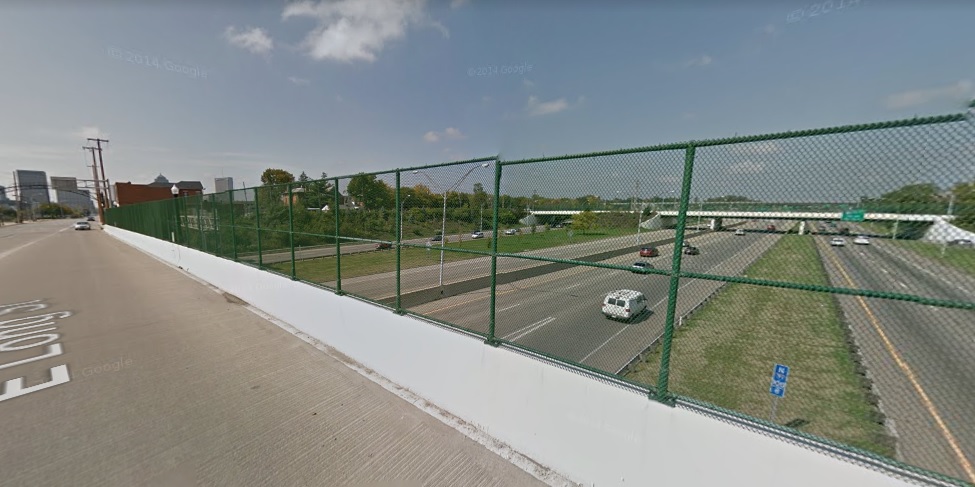
Long Street Before: 2011 Long and 17th, looking southeast. After: 2017 Before: 2011 Long Street and I-71 looking northwest. After: 2017
Instead of focusing on a single project in this addition, I wanted to do a rundown of a few projects- this time both good and bad- that represent the opportunities of the month.
First, the bad.
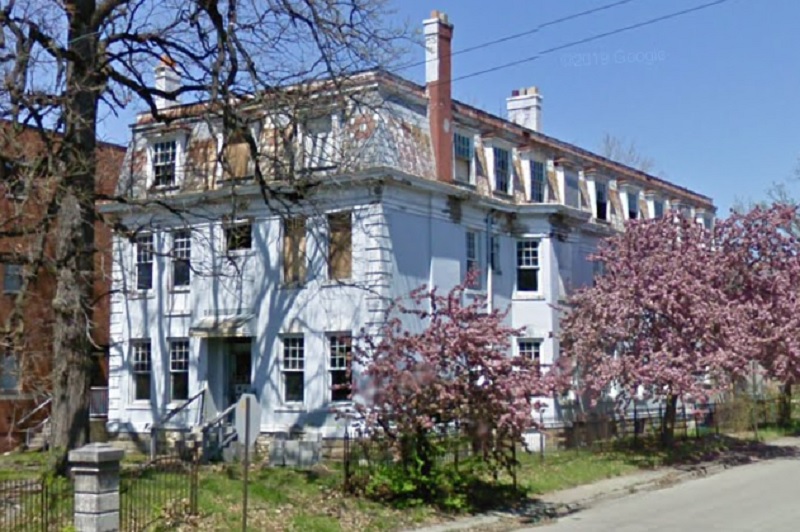
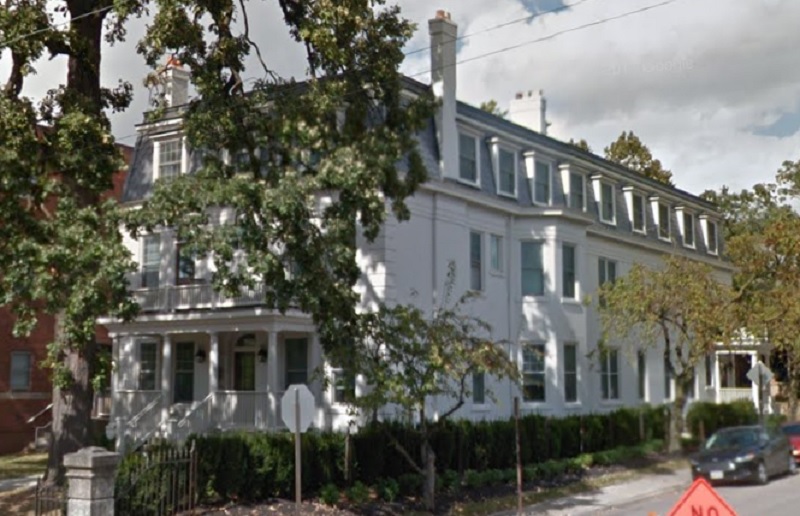
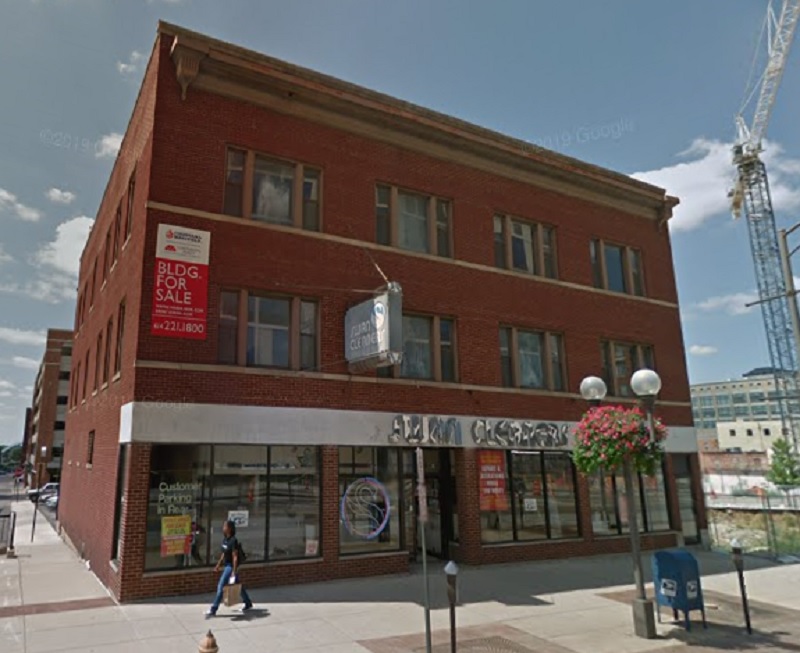
High and Cherry Street Project In what’s becoming a tradition for Downtown, yet another project there has been inexplicably downsized. Originally approved back in 2016, the project required the demolition of a historic building.
Photo taken in 2015.
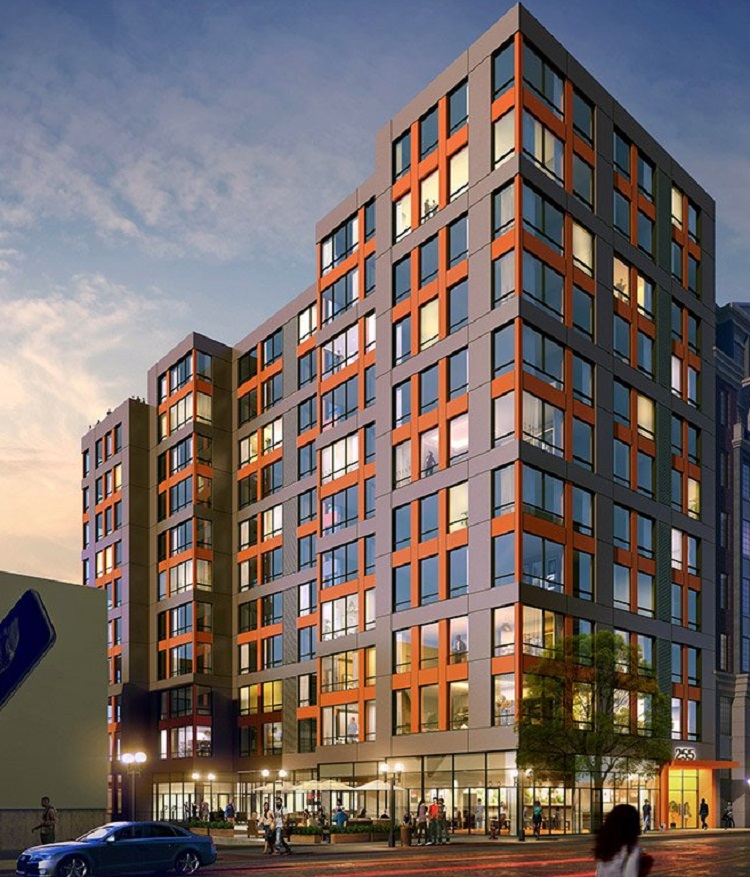
This was generally considered okay because the proposed 11-story project was a significant improvement in density that would’ve added more vibrancy to this part of Downtown.
The 11-story rendering in 2016.
Two years later and, beyond the demolition, there had been no movement on the site, which was itself a little concerning because that typically means that something’s gone wrong or there are about to be big changes for the project. So it was no surprise when, toward the end of July, we received the bad news. Not only was the project going to be reduced in size by a full 4 stories, but all aspects of the project were getting worse. Parking spaces doubled, bike parking spaces were reduced by 70% to just 18, the ground floor retail was completely eliminated and overall residential units fell by 50 to just 70 total. Worse still, even the design of the building became just another bland box.
So what happened? Crawford-Hoying, the developer, made some reference to rising material costs that made its plan to include affordable, micro-unit apartments too expensive, hence the reduction in project size. However, this excuse seems suspicious at best. If higher material costs were a detriment to building the affordable component, why not simply lower the number of micro units or change to a market-rate project altogether? Furthermore, what would that have to do with eliminating the retail space or increasing parking? It wouldn’t. In fact, building parking is actually very expensive, and it’s why many cities nationally are reducing or eliminating parking requirements for new projects, as it is often prohibitively expensive to build and can derail quality urban proposals. If finances were tight, the last thing a developer would do with a new project is add MORE parking rather than trying to maximize potential income with residential units or retail space. Meanwhile, in the month since the project reduction was announced, we have seen other new projects announced or previously-announced projects move forward that have seen no reduction. The company also didn’t make any changes to its 10-story Moxy Hotel project at 800 N. High street, which is currently under construction. Overall, this just feels like a bait and switch. The 11-story proposal was approved, which allowed for the demolition, and now it’s coming in smaller and of a lower quality. Regardless of the real reasons why this project was suburbanized and reduced, it continues the long-standing pattern of Downtown projects being underwhelming. Downtown should be receiving the the statement makers, so to speak. Instead, we continue to see other neighborhoods get them.
Speaking of, let’s look at the good with a couple of proposals that have matched, if not exceeded, their potential.
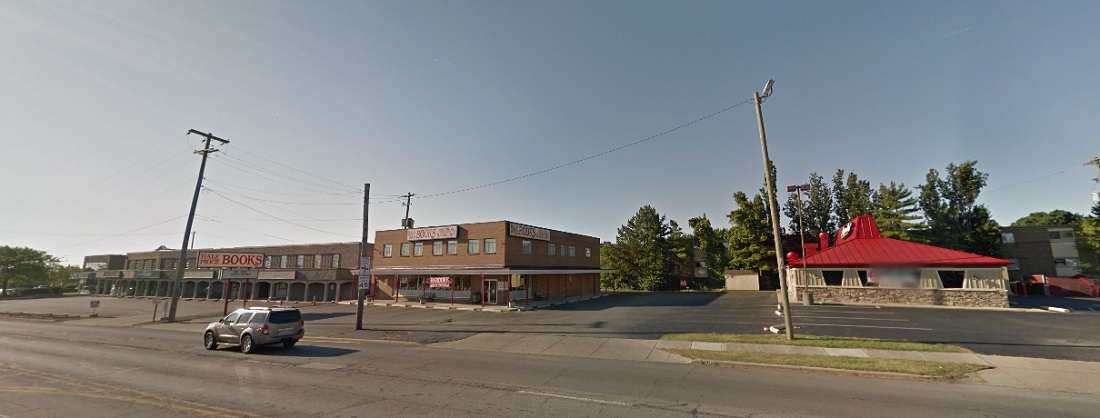
Upper Arlington’s Arlington Gateway Proposed back in 2016 as a 7-story mixed-use building, the project has gone through many revisions. Over the course of the last 2 years, the project has only grown in size to its final iteration, an 11-story with more than 200 apartments, office space and retail. The $100 million project is the largest ever proposed for Upper Arlington, which has long been a more traditional suburban-style inner suburb. It has resisted the urban densification movement until recently. Being landlocked, the only way that it can increase population and maintain tax levels is to build up. Its city leadership seems to understand this, and though there was neighborhood opposition to the project, the city approved it almost unanimously. The project will replace suburban development, including a strip center and Pizza Hut, as seen below.
Quality urbanism, increased walkability… this is a solid addition to Upper Arlington.
Franklinton’s Gravity 2.0 Franklinton is seeing a revival these days, particularly east of 315. Multiple projects have been proposed, and the upcoming Scioto Peninsula redevelopment is on the horizon. Kaufman Development, highlighted in last month’s Missed Opportunity for having to abandon a project in Victorian Village due to NIMBYism, has been on somewhat of a roll lately. It spearheaded a significant renovation of the famed LeVeque Tower, it built both of Downtown’s largest recent projects- 250 High and 80 on the Commons (the latter of which was, of course, downsized)- and it’s heavily investing in the future of Franklinton with a stunning, out-of-the-box development named Gravity.
Gravity 1.0
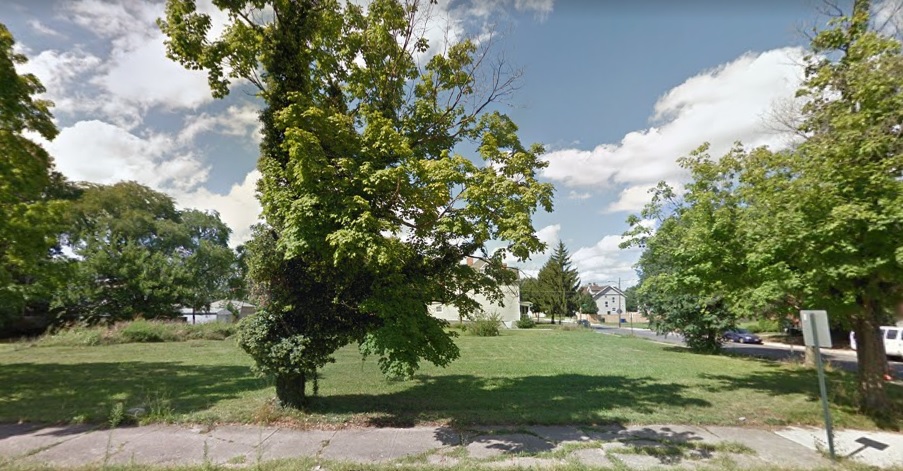
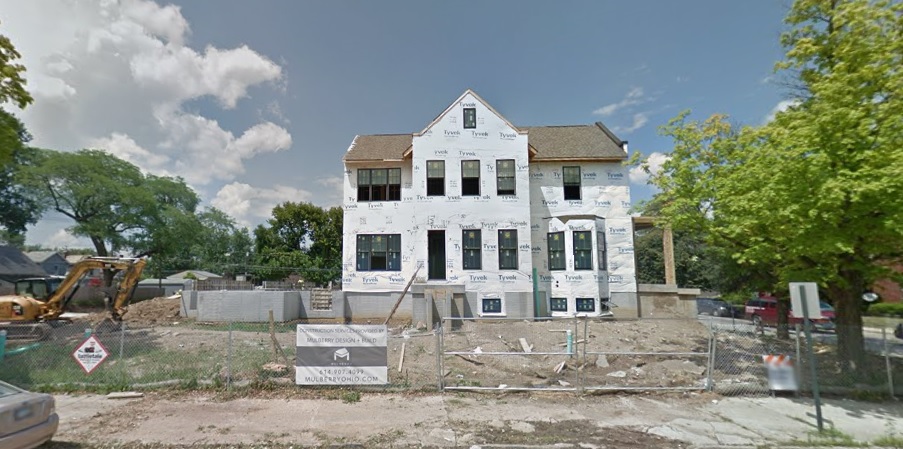
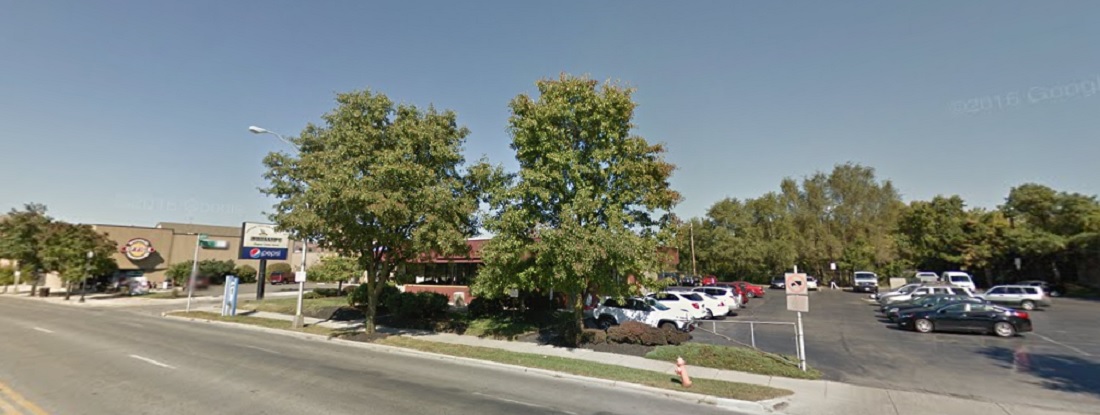
The Gravity 1.0 site in 2014.
Gravity 1.0 was proposed back in 2016 as a 6-story, mixed-use development at 500 W. Broad Street Replacing a few single-story, non-historic buildings and some parking lots (as seen above), the project was designed to drastically change the existing streetscape. It began construction in late 2016 and is nearing completion now. Few anticipated a second phase of the project, however, dubbed Gravity 2.0
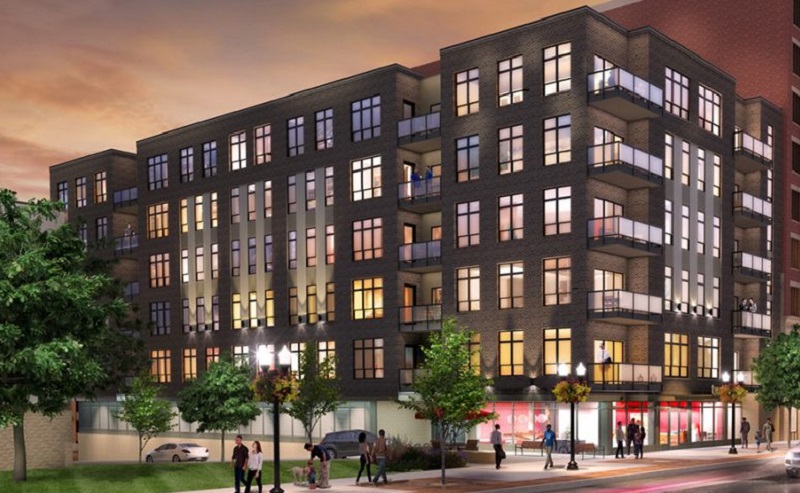
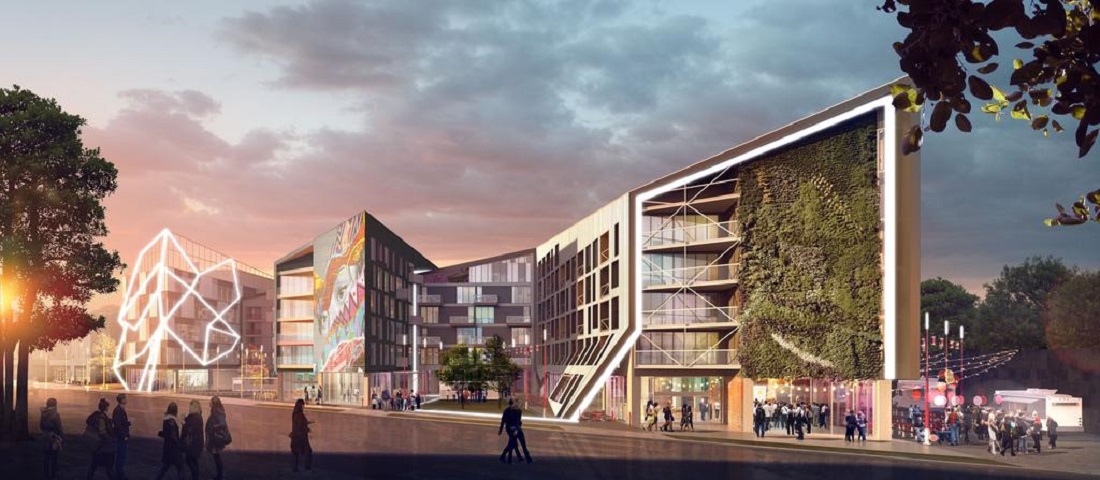
The latest 12-story proposal for Gravity 2.0.
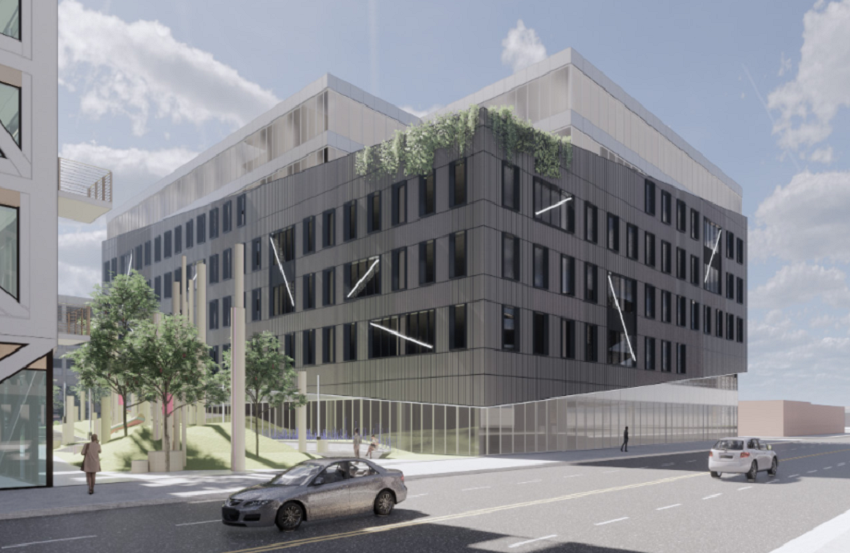
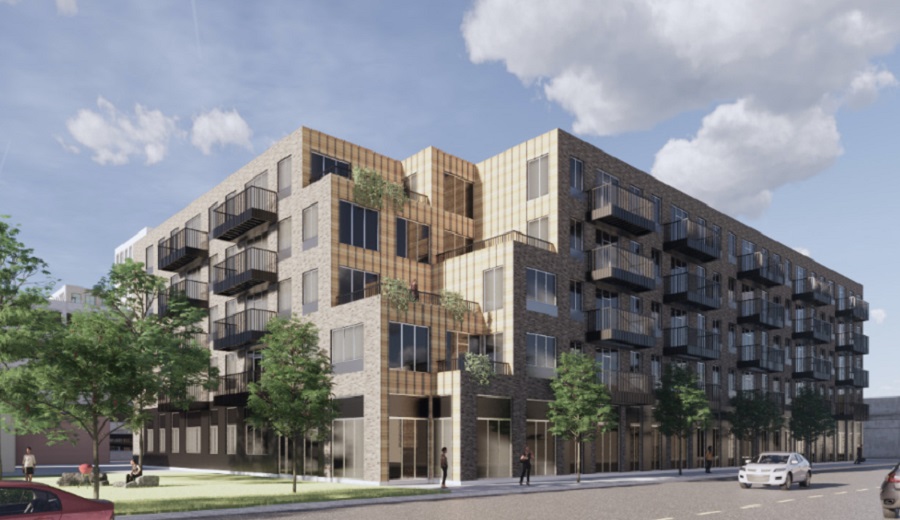
Another Broad Street component of Gravity 2.0.
Announced last week, Gravity 2.0 would be much more massive in scale than 1.0. Proposed for the entire block directly across the street between W. Broad and W. State, the project would include the following: – A 12-story mixed-use building at the northeast corner of the site, directly to the west of the railroad tracks. This would contain 258 apartments. – A 6-story residential building on the State Street with 94 units. – A 5-story parking garage. – A 6-story mixed-use addition to the existing Murphy building, which will be renovated. – A 5-story townhouse building along McDowell Street with 18 units. – A renovation to the existing Solazzo Building at the southwest corner. Like Gravity 1.0, the project will include different types of amenities than would be typically found. These include a green roof on the parking garage with a “city view overlook”, as well as an art walk through the lower floor of the garage. Along Broad Street, a retail plaza will be constructed out of shipping containers. Co-living will be included in the southern residential building. A food hall, brewery and restaurants are also potentially in the works. Overall, the architecture will match the funky modernism of Gravity 1.0. This project is poised to become a serious game-changer for Franklinton. While there was already ongoing redevelopment in this area, a mid-rise development like this pushes the envelope and raises the prospects of future development coming in bigger, and the pace of the redevelopment will likely accelerate. This also increases the likelihood that the Scioto Peninsula to the east will see larger scale development, as well. Originally, the city wanted a couple 30+ story buildings there, with a mix of other mid-rise buildings. That plan was abandoned when an Indianapolis developer was chosen for the site and proposed mostly low-rise. That developer was let go from the project a few months ago, and the Peninsula will now be developed piece by piece. With large development occurring in Franklinton itself, the high-rises may be about to make a return, making the entire eastern section of Franklinton an extension of Downtown.
So there are a few great projects that are definitely NOT missed opportunities. Take note, Downtown developers- a lot of you are getting embarrassed.
So once again, 2017 Ohio city population estimates came out today from the Census. As has been the case for a long time now, Columbus is rocketing upward at record pace. The 2016 comparison numbers have been adjusted by the Census for the 2017 update.
Some milestones include Grove City and Lancaster passing 40,000 for the first time and Johnstown passing the 5,000 mark. 11 places lost population, 8 stayed the same and 83 gained population. The growing portions of the Columbus metro continue to encompass the vast majority of incorporated places.
Nationally, here were the top 20 fastest-growing cities by numerical change between July 1, 2016 and July 1, 2017 1. San Antonio, Texas: +24,208 2. Phoenix, Arizona: 24,036 3. Dallas, Texas: +18,935 4. Fort Worth, Texas: +18,664 5. Los Angeles: 18,643 6. Seattle, Washington: +17,490 7. Charlotte, North Carolina: +15,551 8. Columbus: +15,429 9. Frisco, Texas: +13,470 10. Atlanta, Georgia: +13,323 11. San Diego, California: +12,834 12. Austin, Texas: +12,515 13. Jacksonville, Florida: +11,169 14. Irvine, California: +11,068 15. Henderson, Nevada: +10,534 16. Las Vegas, Nevada: 9,966 17. Denver, Colorado: 9,844 18. Washington, DC: 9,636 19. Tampa, Florida: 9,383 20. Mesa, Arizona: 9,025