The Winter 2022-2023 Review shows that the season was one of the warmest ever recorded for Columbus, with near consistent above average- and sometimes record-breaking temperatures. Snow, as a consequence, was well below average.
The rankings below are good through the 2022-2023 season.
December-February Only Average High: 45.8 4th Warmest Average Low: 29.4 7th Warmest Mean: 37.6 5th Warmest Precipitation: 7.80″ 62nd Wettest Snowfall: 11.2″ 30th Least Snowy Average Daily Snow Depth: 0.3″ Tied for 4th Lowest Largest Snowstorm: 4.9″ on 12/23/2022 # of 32 or Below Highs: 10 5th Fewest # of 32 or Below Lows: 51 Tied for 4th Fewest # of Measurable Precipitation Days: 40 Tied for 13th Most # of Measurable Snowfall Days: 10 Tied for 6th Fewest Highest Average Daily Wind Speed in MPH: 23.3 on 12/23/2022 Highest Wind Gust in MPH: 54 on 1/19/2023 # of Clear Days: 6 6.67% # of Partly Cloudy Days: 38 42.22% # of Cloudy Days: 46 51.11%
Early winter ended up being the coldest and snowiest part of the season, with every subsequent month getting warmer. There were very few freezing days during the heart of the winter, and despite a somewhat stormy pattern with seemingly endless windy days, there was relatively little precipitation.
The biggest snowstorm was on December 23rd, when a very strong low pressure system and cold front brought heavy snow and very cold temperatures, making for one of the coldest Christmas Eves and Days in many years.
Entire Cold Season: October-April Average High: 53.8 3rd Warmest Average Low: 34.5 Tied for 14th Warmest Mean: 44.1 Tied for 6th Warmest Precipitation: 19.13″ 63rd Driest Snowfall: 14.5″ Tied for 21st Least Snowy Average Snow Depth: 0.1″ Tied for 2nd Lowest Largest Snowstorm: 4.9″ on 12/23/2022 # of 32 or Below Highs: 11 Tied for 2nd Fewest # of 32 or Below Lows: 83 6th Fewest # of Measurable Precipitation Days: 79 Tied for 14th Fewest # of Measurable Snowfall Days: 15 Tied for 6th Fewest Highest Average Daily Wind Speed in MPH: 23.3 on 12/23/2022 Highest Wind Gust in MPH: 59 on 3/3/2023 # of Clear Days: 30 14.15% # of Partly Cloudy Days: 95 44.81% # of Cloudy Days: 87 41.04%
The entire cold season didn’t really live up to its name. All months except October ended up above normal. Now let’s break down those months individually.
Average High By Month October 2022: 65.6 44th Warmest November 2022: 54.6 Tied for 19th Warmest December 2022: 41.8 Tied for 36th Warmest January 2023: 43.8 13th Warmest February 2023: 52.3 1st Warmest March 2023: 52.6 33rd Warmest April 2023: 65.7 20th Warmest
February, 2023 had the warmest average high mean on record, beating the next closest year- 2017- by 0.5 degrees.
Average Low By Month October 2022: 42.7 Tied for 28th Coldest November 2022: 36.0 29th Warmest December 2022: 27.4 Tied for 40th Warmest January 2023: 31.0 6th Warmest February 2023: 30.0 10th Warmest March 2023: 32.1 Tied for 45th Warmest April 2023: 42.0 Tied for 35th Warmest
Mean By Month October 2022: 54.1 Tied for 33rd Coldest November 2022: 45.3 Tied for 18th Warmest December 2022: 34.6 Tied for 37th Warmest January 2023: 37.4 10th Warmest February 2023: 41.1 3rd Warmest March 2023: 42.4 Tied for 40th Warmest April 2023: 53.9 Tied for 23rd Warmest
Precipitation By Month October 2022: 0.60″ 11th Driest November 2022: 2.34″ 58th Driest December 2022: 2.02″ 39th Driest January 2023: 4.16″ 28th Wettest February 2023: 1.62″ Tied for 41st Driest March 2023: 5.22″ 17th Wettest April 2023: 3.17″ Tied for 64th Wettest
Snowfall By Month October 2022: Trace Tied for 2nd Least Snowy November 2022: 0.3″ Tied for 5th Least Snowy December 2022: 5.8″ 38th Snowiest January 2023: 5.4″ Tied for 39th Least Snowy February 2023: Trace 1st Least Snowy March 2023: 1.0″ Tied for 10th Least Snowy April 2023: Trace Tied for 2nd Least Snowy
February’s Trace was the lowest ever recorded for the month.
Average Snow Depth By Month October 2022: 0.0″ November 2022: 0.0″ December 2022: 0.7″ January 2023: 0.1″ February 2023: 0.0″ March 2023: 0.0″ April 2023: 0.0″
Maximum High By Month October 2022: 77 on the 6th, 23rd and 24th November 2022: 77 on the 5th December 2022: 65 on the 30th January 2023: 62 on the 3rd February 2023: 73 on the 23rd March 2023: 75 on the 1st April 2023: 84 on the 20th
Maximum High Records -The 77 on November 5th was a record for the date, beating the old record of 76 set in 1977. – The 65 on December 30th was a record for the date, beating the old record of 63 set in 1964. -The 72 on February 9th was a record for the date, beating the old record of 66 set in 2001. -The 72 on February 15th was a record for the date, beating the old record of 70 set in 1954. -The 73 on February 23rd was a record for the date, beating the old record of 72 set in 2017. -The 75 on March 1st was a record for the date, beating the old record of 65 set in 1972 and 1997.
Minimum High By Month October 2022: 45 on the 18th November 2022: 30 on the 20th December 2022: 14 on the 24th January 2023: 26 on the 31st February 2023: 30 on the 1st March 2023: 33 on the 14th April 2023: 46 on the 2nd and 17th
Maximum Low By Month October 2022: 57 on the 31st November 2022: 62 on the 5th December 2022: 54 on the 30th January 2023: 56 on the 3rd February 2023: 47 on the 15th March 2023: 47 on the 23rd April 2023: 60 on the 5th
Maximum Low Records -The 62 on November 6th was a record for the date, beating the old record of 61 set in 1977. -The 49 on January 2nd tied the record for the date, matching 1997, 2000 and 2005. -The 56 on January 3rd was a record for the date, beating the old record of 55 set in 1997.
Minimum Low By Month October 2022: 32 on the 20th November 2022: 17 on the 20th December 2022: -7 on the 23rd January 2023: 16 on the 15th February 2023: 12 on the 4th March 2023: 18 on the 19th April 2023: 29 on the 25th
Highest Daily Precipitation by Month October 2022: 0.15″ on the 12th and 30th November 2022: 1.14″ on the 11th December 2022: 0.44″ on the 15th January 2023: 0.73″ on the 12th February 2023: 0.73″ on the 27th March 2023: 1.6″ on the 3rd April 2023: 0.91″ on the 5th
Precipitation Records -The 1.14″ on November 11th set a record for the date, beating the old record of 1.03″ set in 1995. -The 1.60″ on March 3rd set a record for the date, beating the old record of 1.31″ set in 2020.
Highest Daily Snowfall By Month October 2022: Trace on the 18th November 2022: 0.2″ on the 12th December 2022: 4.9″ on the 23rd January 2023: 3.0″ on the 22nd February 2023: Trace on the 3rd and 17th March 2023: 0.4″ on the 12th and 13th April 2023: Trace on the 17th
Deepest Snow Depth By Month October 2022: 0.0″ November 2022: Trace on the 13th December 2022: 4″ on the 23rd, 24th, 25th and 27th January 2023: 2″ on the 23rd February 2023: Trace on the 1st March 2023: 1″ on the 14th April 2023: 0.0″
Average Daily Wind Speed by Month in MPH October 2022: 7.9 November 2022: 8.2 December 2022: 8.0 January 2023: 8.4 February 2023: 9.7 March 2023: 10.0 April 2023: 8.1
Highest Wind Gust by Month in MPH October 2022: 38 on the 26th November 2022: 44 on the 27th and 30th December 2022: 46 on the 23rd January 2023: 54 on the 19th February 2023: 49 on the 9th March 2023: 59 on the 3rd April 2023: 50 on the 1st
Clear Days by Month October 2022: 8 25.81% November 2022: 6 20.0% December 2022: 2 6.45% January 2023: 0 0.0% February 2023: 4 14.29% March 2023: 5 16.13% April 2023: 5 16.67%
Partly Cloudy Days by Month October 2022: 17 54.84% November 2022: 13 43.33% December 2022: 10 32.26% January 2023: 13 41.94% February 2023: 15 53.57% March 2023: 15 48.39% April 2023: 12 40.0%
Cloudy Days by Month October 2022: 6 19.35% November 2022: 11 36.67% December 2022: 19 61.29% January 2023: 18 58.06% February 2023: 9 32.14% March 2023: 11 35.48% April 2023: 13 43.33%
The history of Ohio movie locations begins long before any movies were ever even filmed, let alone before movies as entertainment were ever a thing. Daeida Wilcox Beveridge was born in Hicksville in 1861. She went to school both in Hicksville and Canton and spent her formative years in the area. After marrying Harvey Wilcox, the couple moved around a bit before ending up in Southern California in 1886. There, they purchased a 200-acre ranch outside LA.
The following year, in 1887, the couple started to subdivide their land in order to lay out a brand new town. The town’s name was Hollywood, a name they supposedly came up with while visiting family in Ohio. Daeida may have gotten the name from what a Chicago friend called her country estate, but this is not the only legend around the name, so who knows how true it is. In any case, it was Daeida who helped name many of the city’s most famous streets, including Sunset Boulevard.
Until her death in 1914, Daeida spent her life promoting her new city, and she was instrumental in helping the city gain many of its amenities. This included the nascent focus on the arts. By the end of her life, she was known as the Mother of Hollywood, and she is now a part of the Ohio Women’s Hall of Fame.
Despite all of this, Ohio has only occasionally been the location for movie shoots, though that seems to be increasing in recent years with several high-profile projects filming around the state. The link of the day is a site that gives maps, photos and other information on movie locations around the state. Take a look and remember that Ohio helped give the world the movies that they enjoy (not to mention native Ohioan Thomas Edison’s contributions to cameras, lighting and sound).
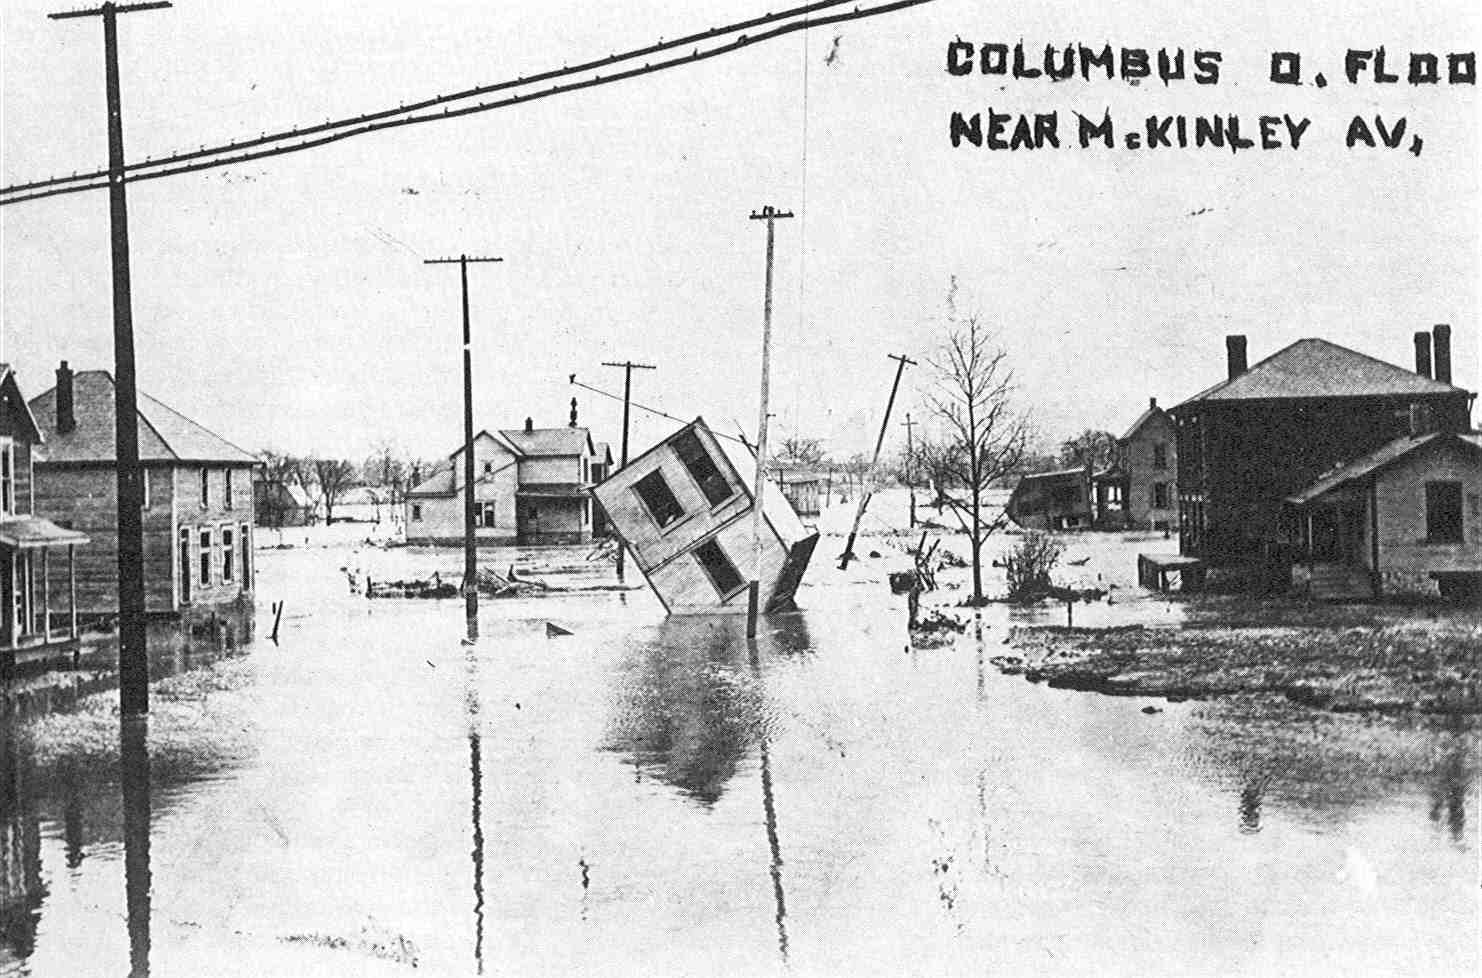
Photo Location: Intersection of McKinley Avenue and North Souder Avenue, looking west. Photo Date: March, 1913 Photo History: The Great Flood of 1913 was the most devastating and deadly flood in Ohio history. 6″-12″ of rain fell between March 23-27, 1913 as two weather systems followed one after the other. Most of the rain fell across the headwaters of major rivers, including the Scioto. The subsequent flood destroyed levees in Columbus and flooded parts of Franklinton- among other areas- with up to 17′ of water with a record crest. The entire riverfront suffered heavy damage with hundreds of buildings damaged or destroyed. 100 people were reportedly killed around the city. Floods like 1913- and later in 1959- eventually led to the federal government limiting new development and investment in Franklinton, which caused it to decline for decades. It wasn’t until 2004 with the completion of the Franklinton floodwall that those limitations were lifted.
The same view today.
Columbus wasn’t the only victim of this great flood. Virtually every major city saw some significant impact, but Dayton arguably got it much worse than any other.
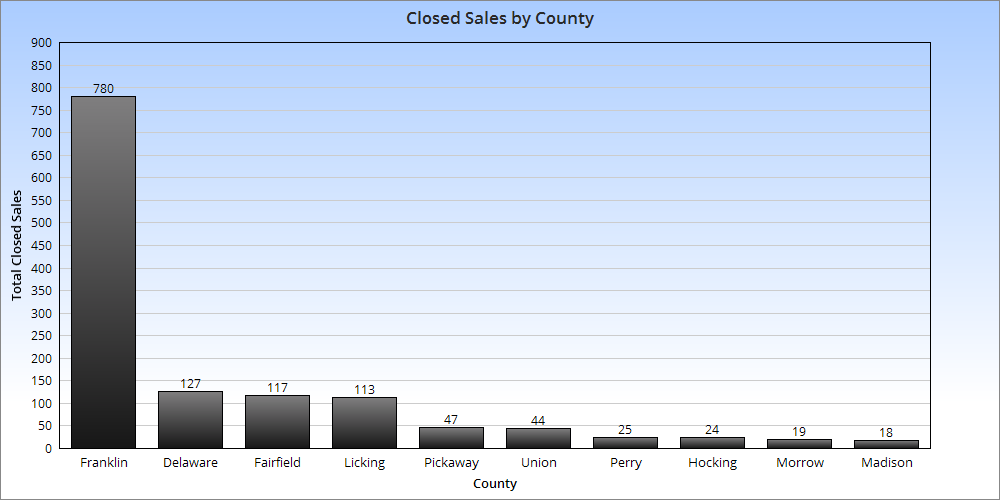
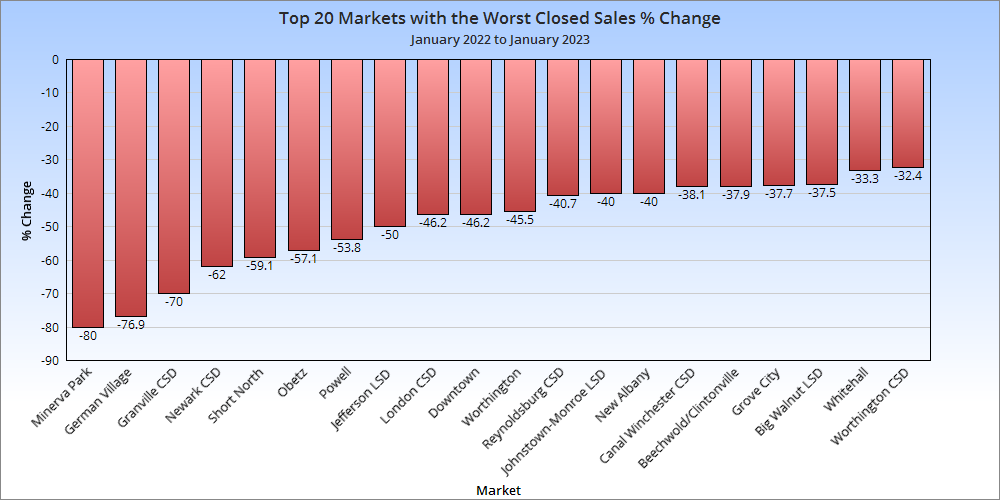
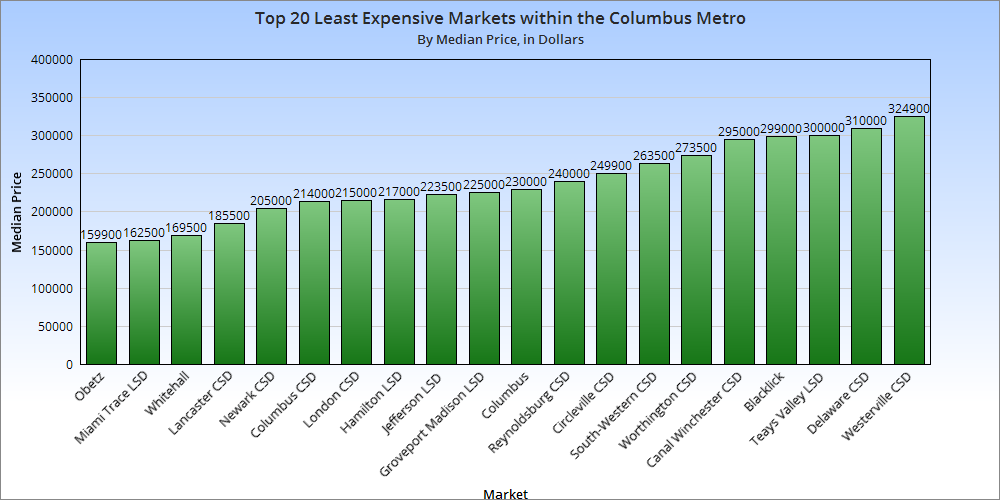
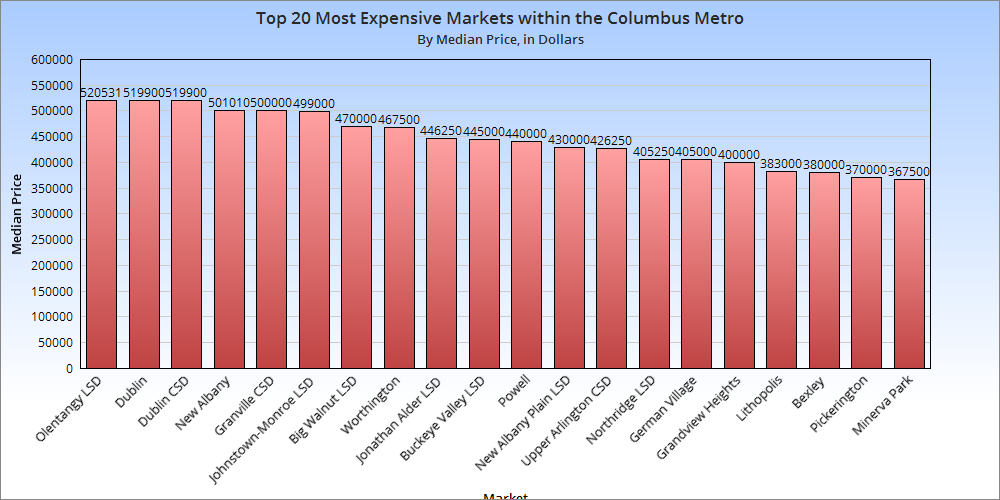
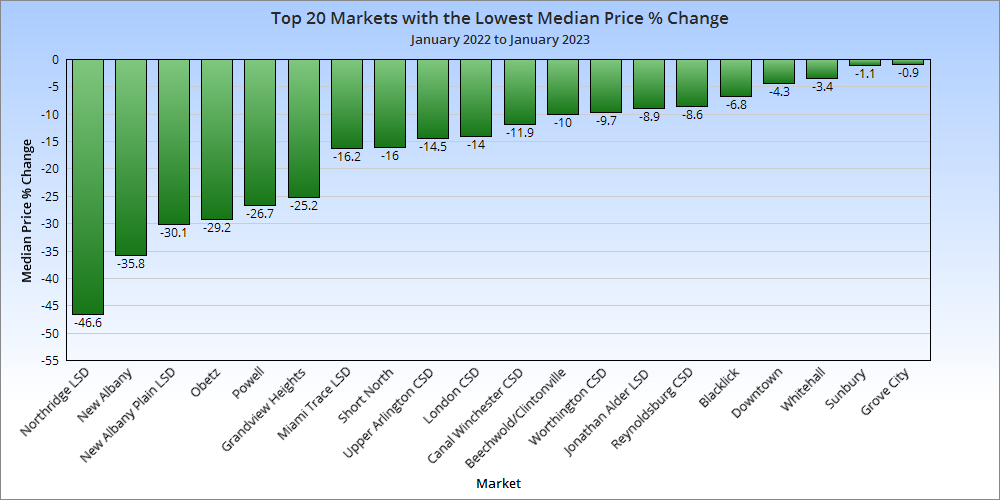
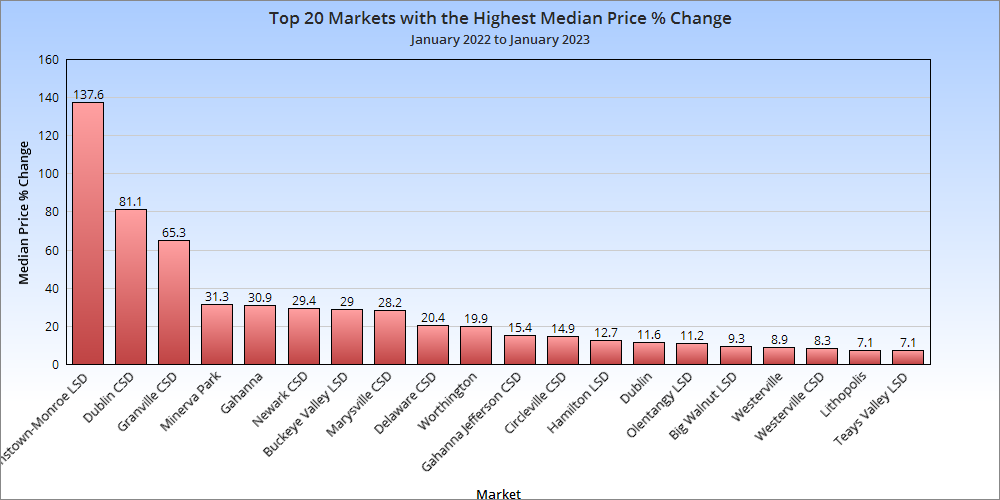
The Housing Market Update January 2023 data, the first of the new year, from Columbus Realtors showed that home sales and overall supply continued to decline, helping to ensure most areas saw continued increases in median prices.
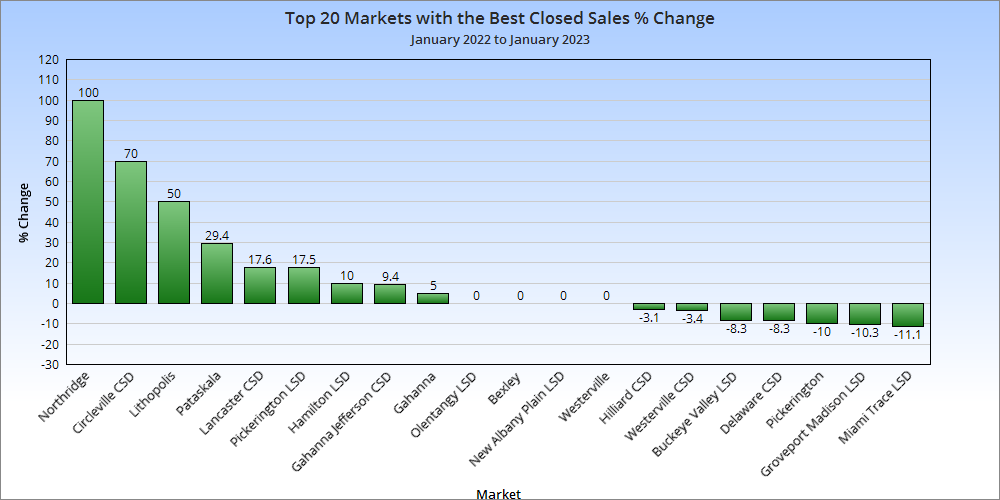
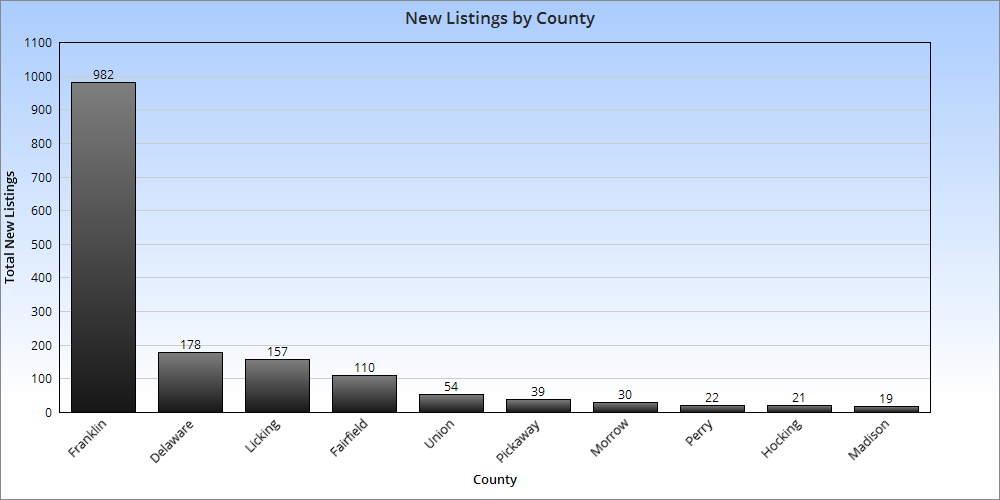
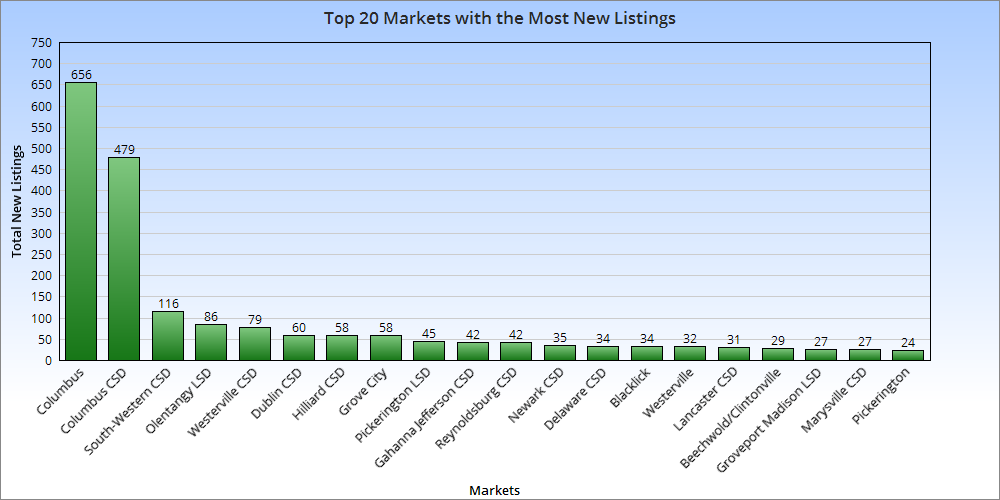
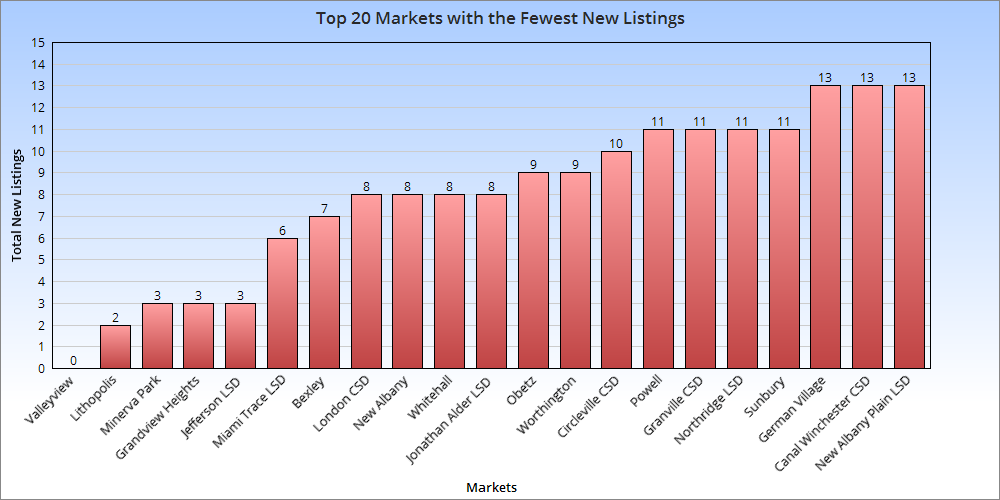
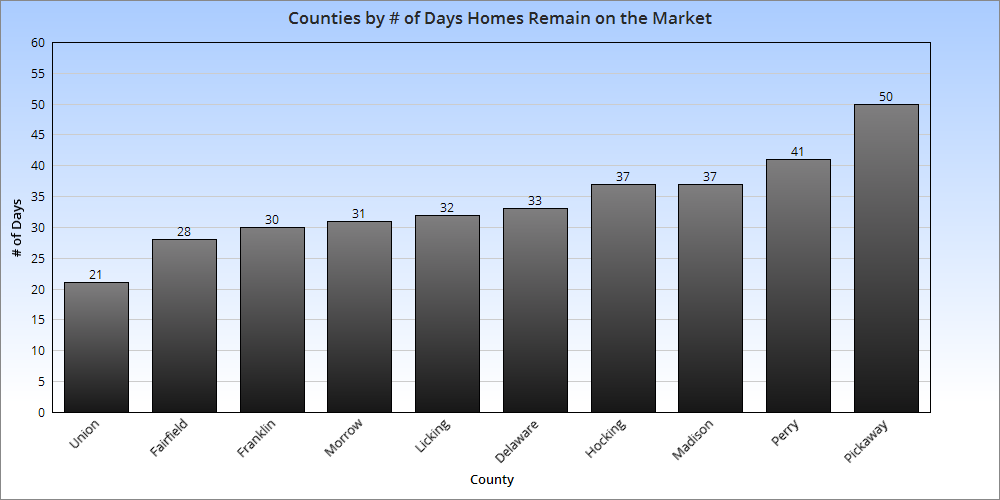
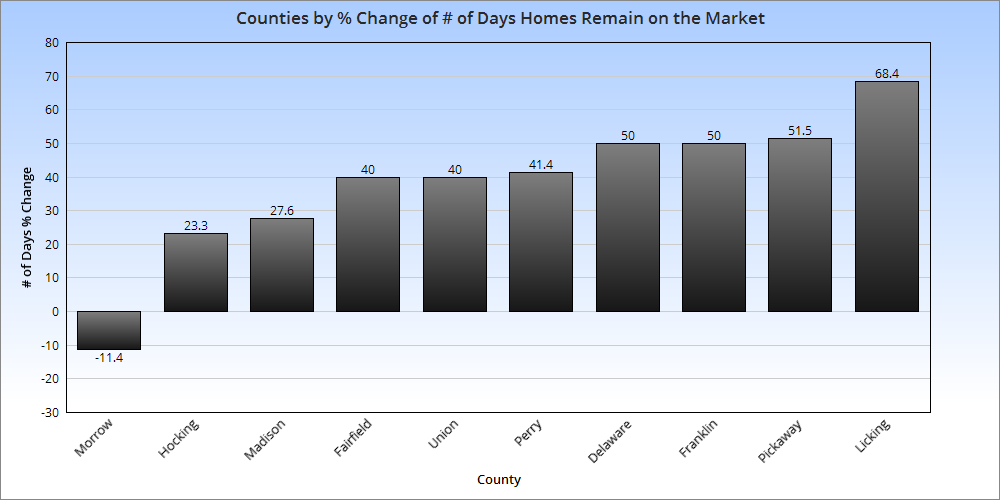
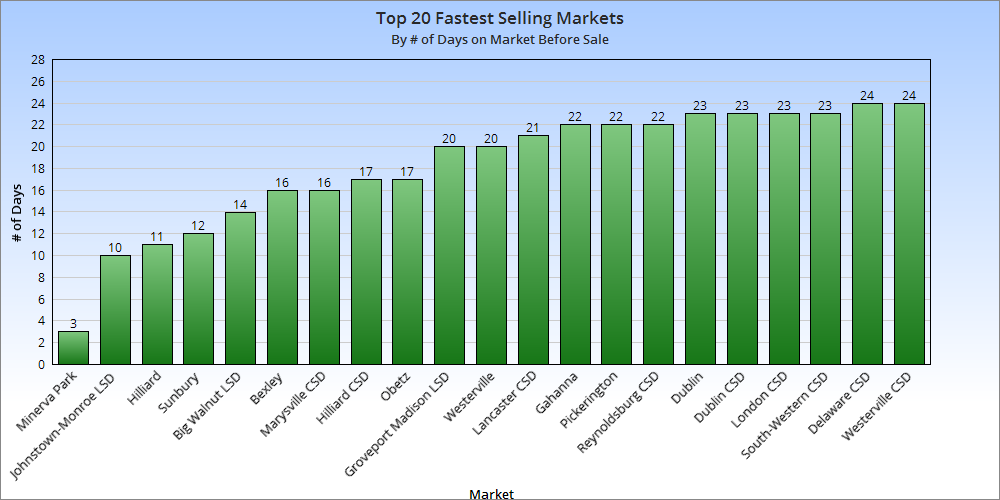
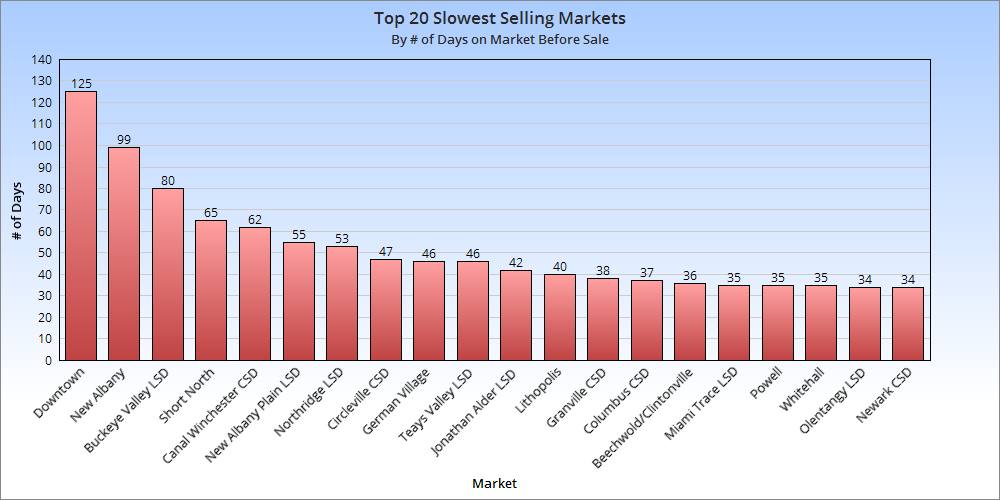
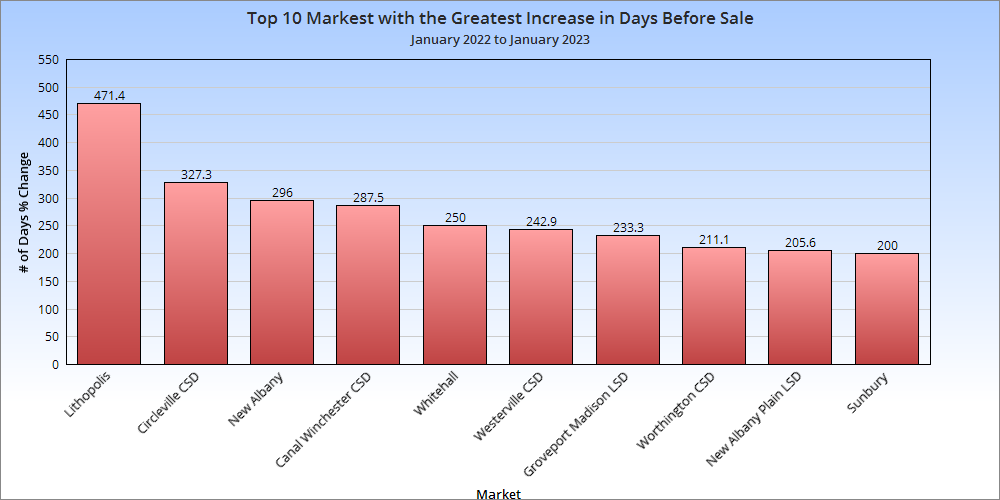
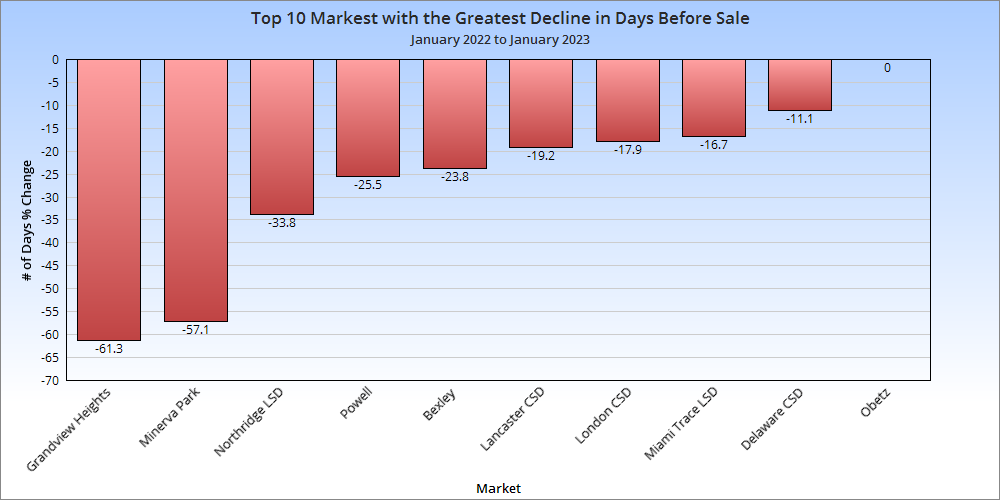
Note: LSD= Local School District, CSD= City School District. In both cases, school district boundaries differ from city boundaries.
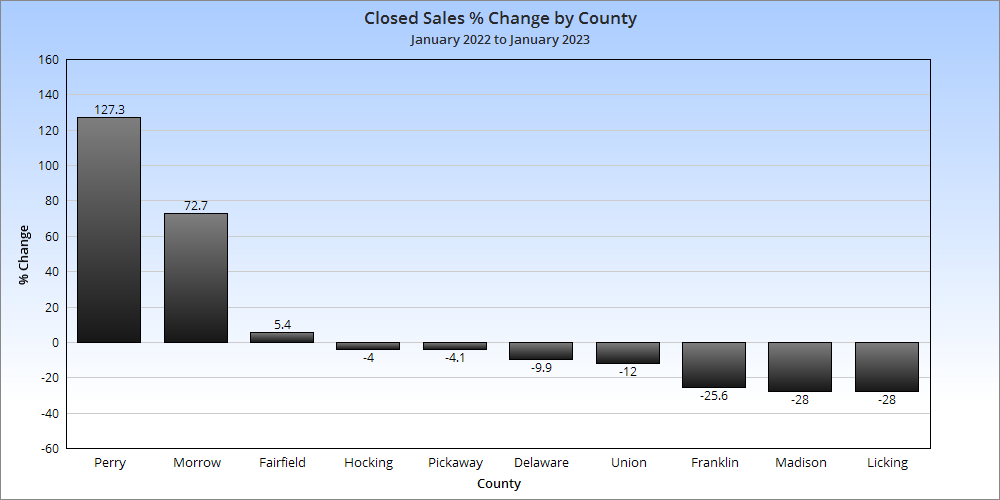
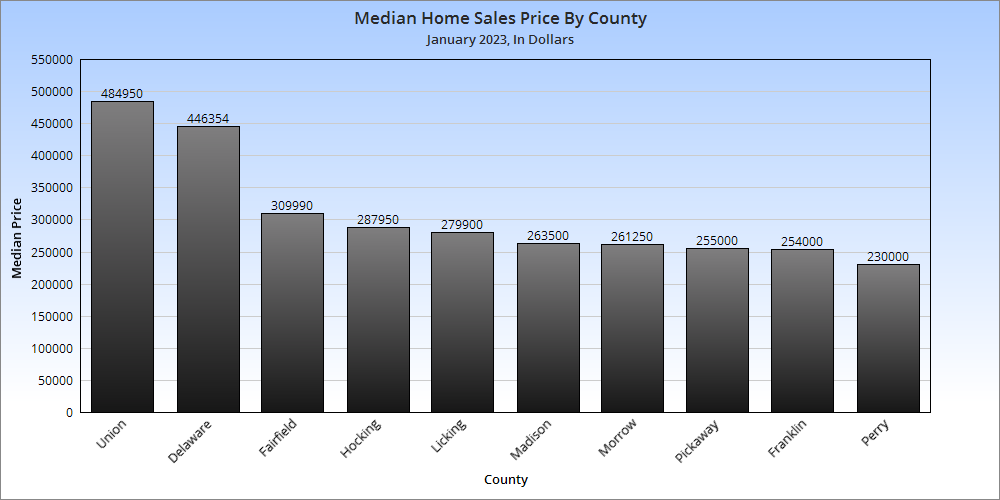
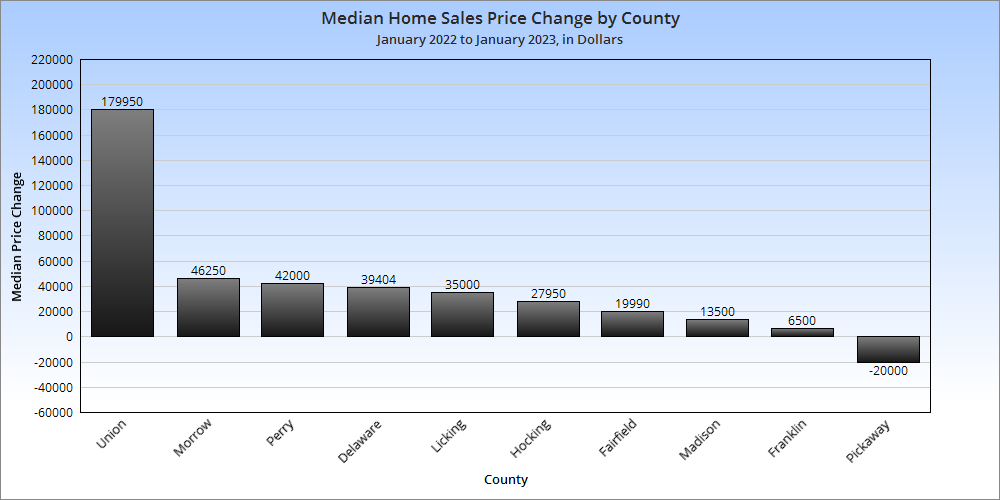
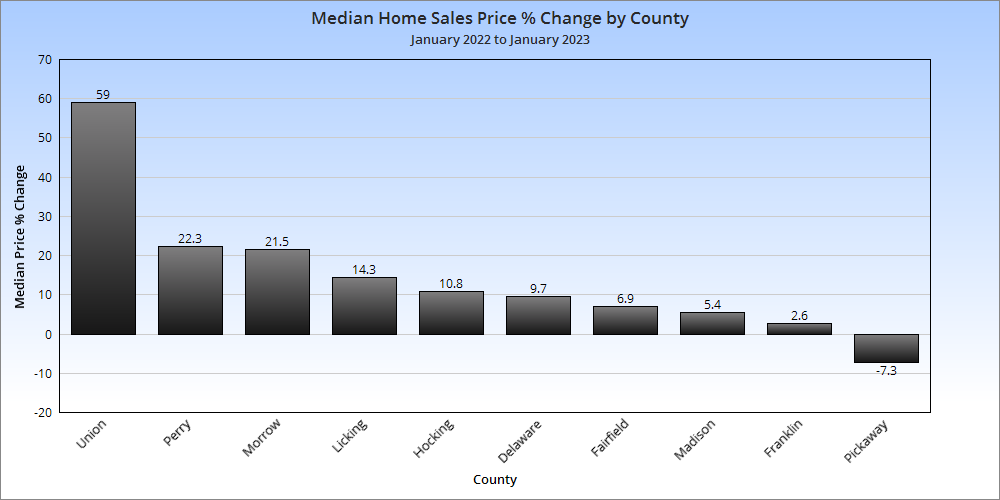
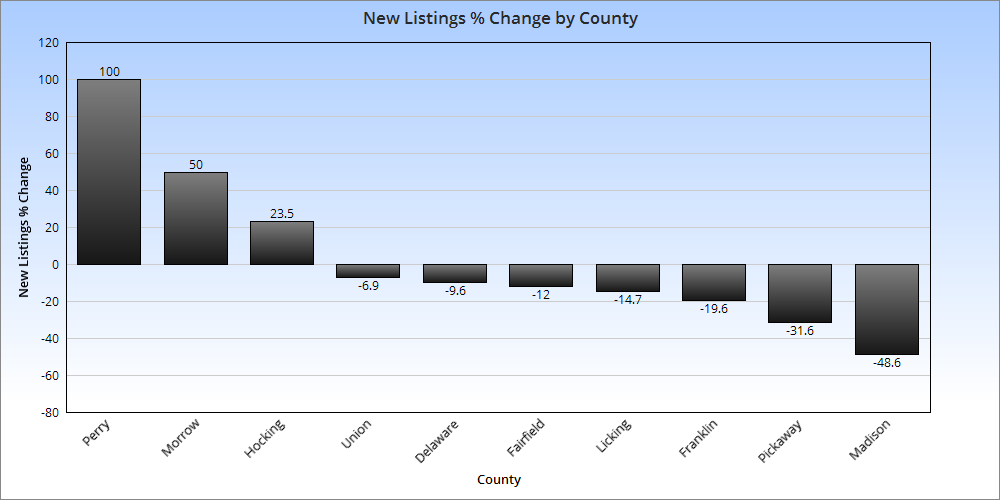
Closed sales are those sales that were completed during the month. 7 of the 10 metro counties saw declines in January Only 9 of more than 40 local markets were up year-over-year. Not sure what was going on in Union County in January, but it was well above all other counties for the month. The market overall continued to be up on price year-over-year, except in Pickaway County. Overall Market Median Sales Price in January 2023: $307,289 Based on the 10 Columbus Metro Area counties, the metro price saw a more than $39,000 increase over January, 2022. Overall Market Median Sales Price % Change in January, 2023 vs. January, 2022: +14.6% Continuing home sale declines had relatively little impact on home prices overall, which saw a strong increase over the year. It seems the Intel project’s impact may finally be making an appearance in housing numbers, with the Johnstown district seeing a huge increase in median home prices versus January 2022, 2 months before the project became official. That said, New Albany had one of the areas largest declines, but that could be due to it generally being one of the most expensive markets last year. New listings across most of the metro area were down, accounting for most of the median price increase as demand remains strong in the region. Most of the decrease came from Franklin County. Total Metro New Listings in January, 2023: 1,612 Total Metro New Listings Change from January, 2022 to January, 2023: -316 Average # of Days Homes Remain on the Market Before Sale for the Metro Overall in January, 2023: 34.0 # of Days Homes Remain on the Market Before Sale for the Metro January, 2022 to January, 2023: +8.8 Homes continued to sell more slowly than they did a year ago, now more than a week more slowly on average.