
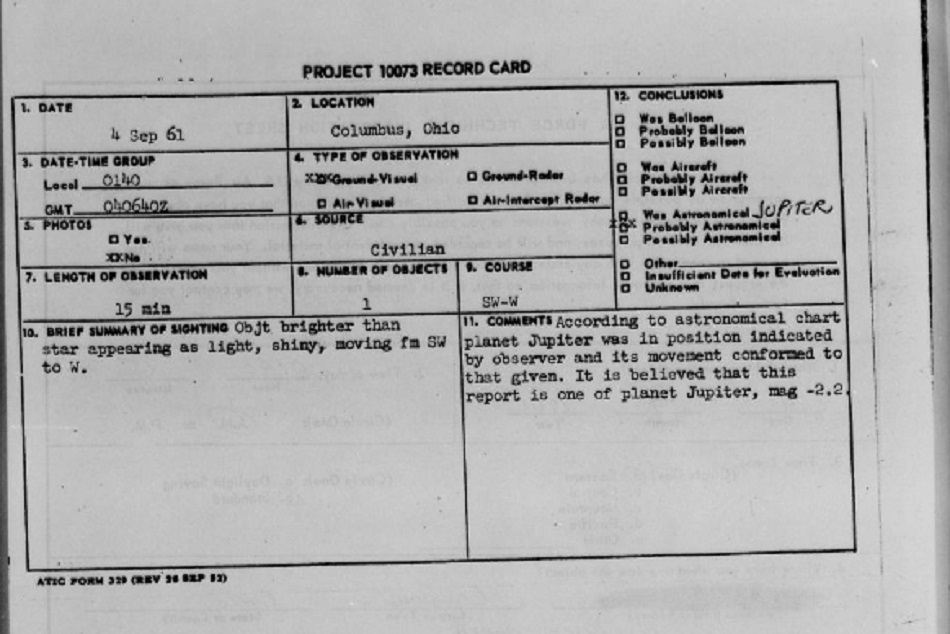
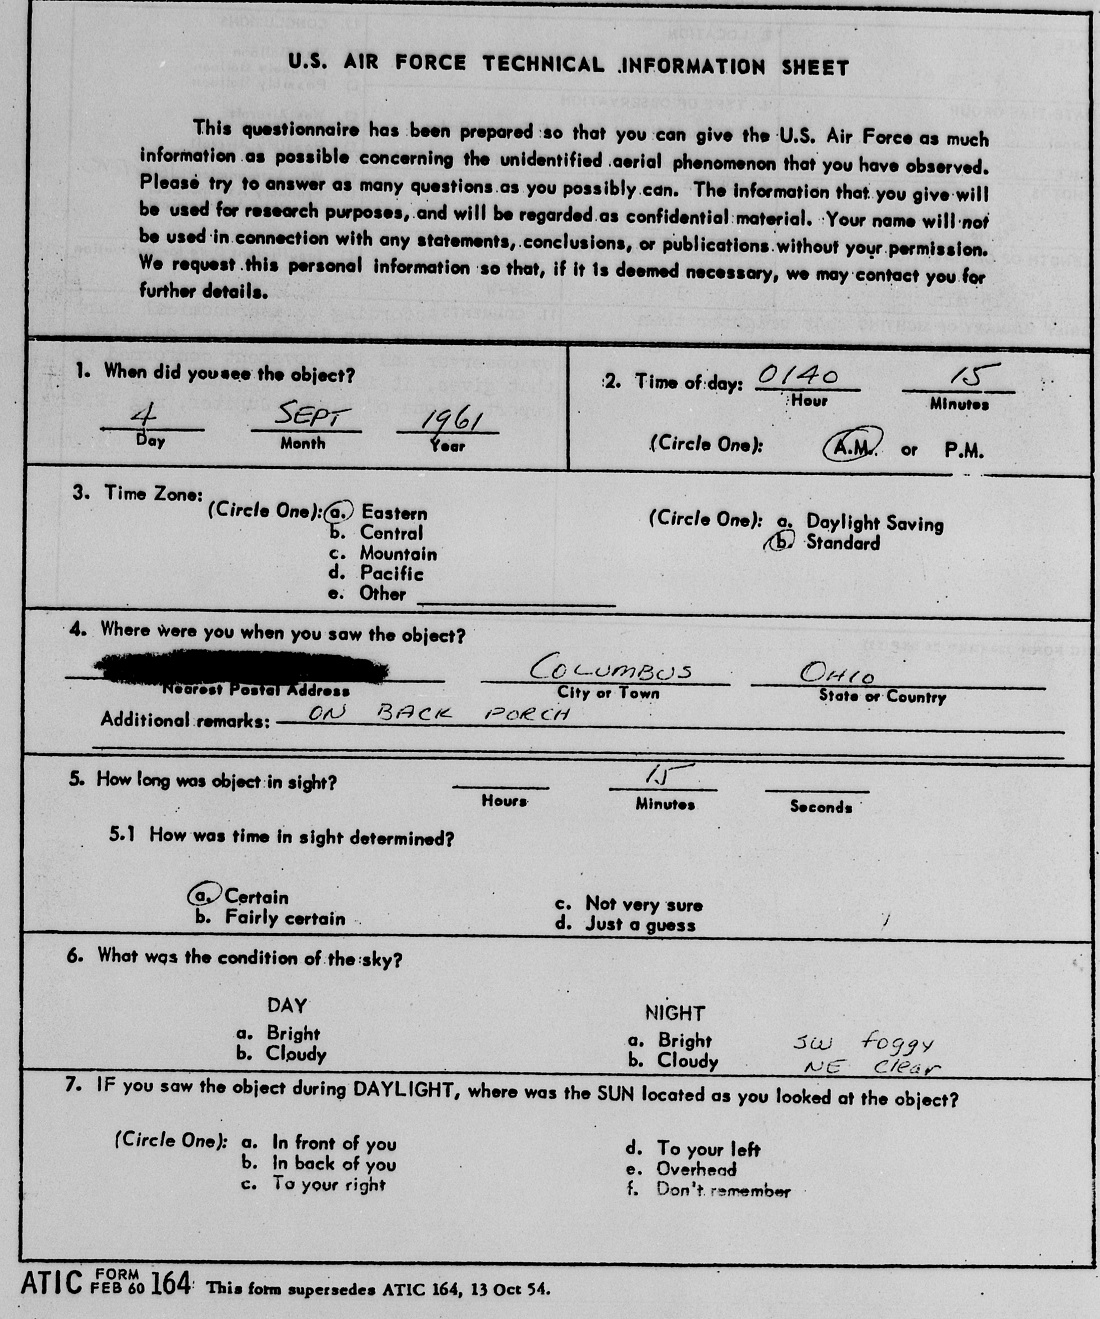
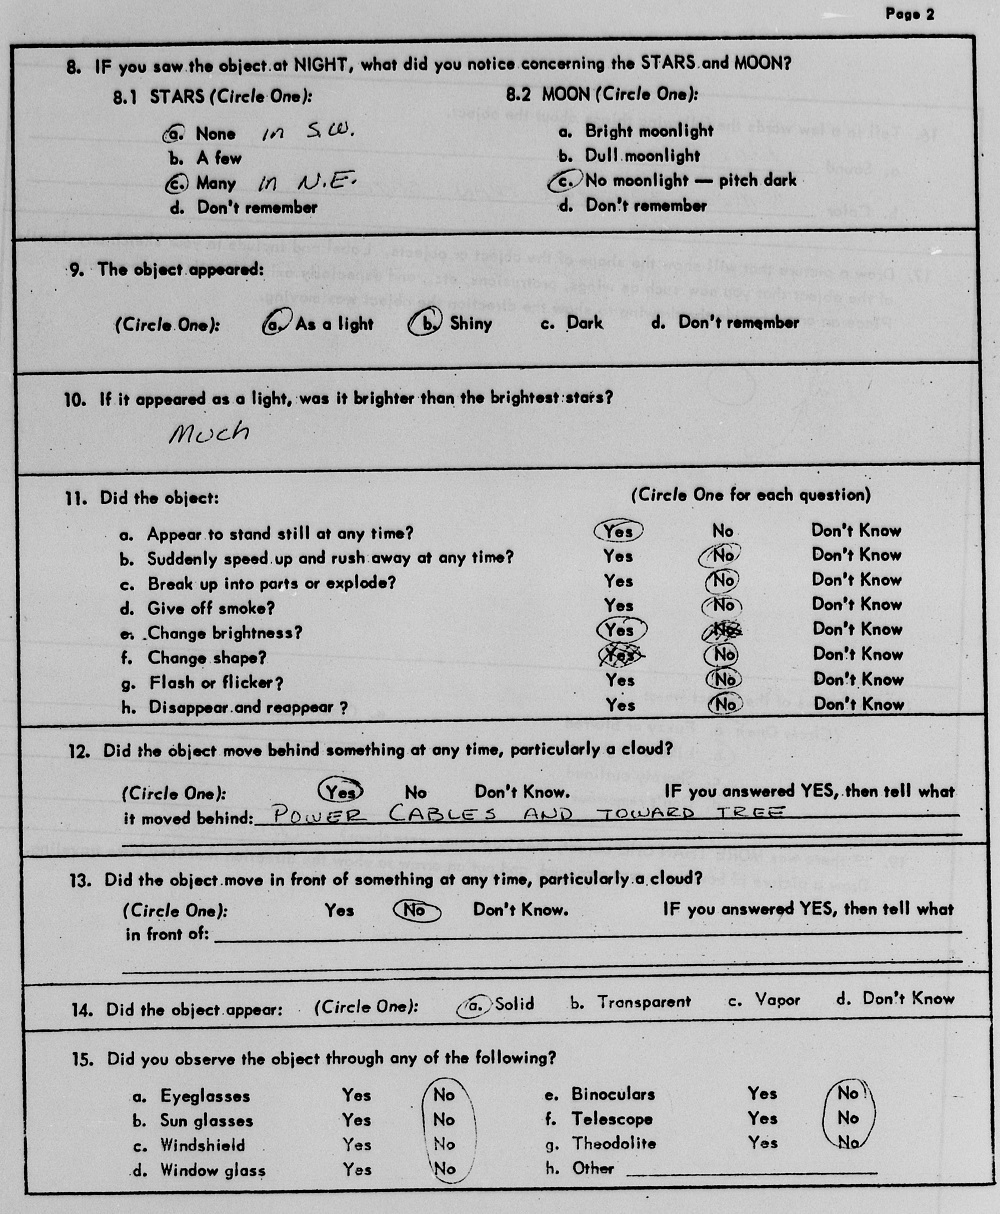
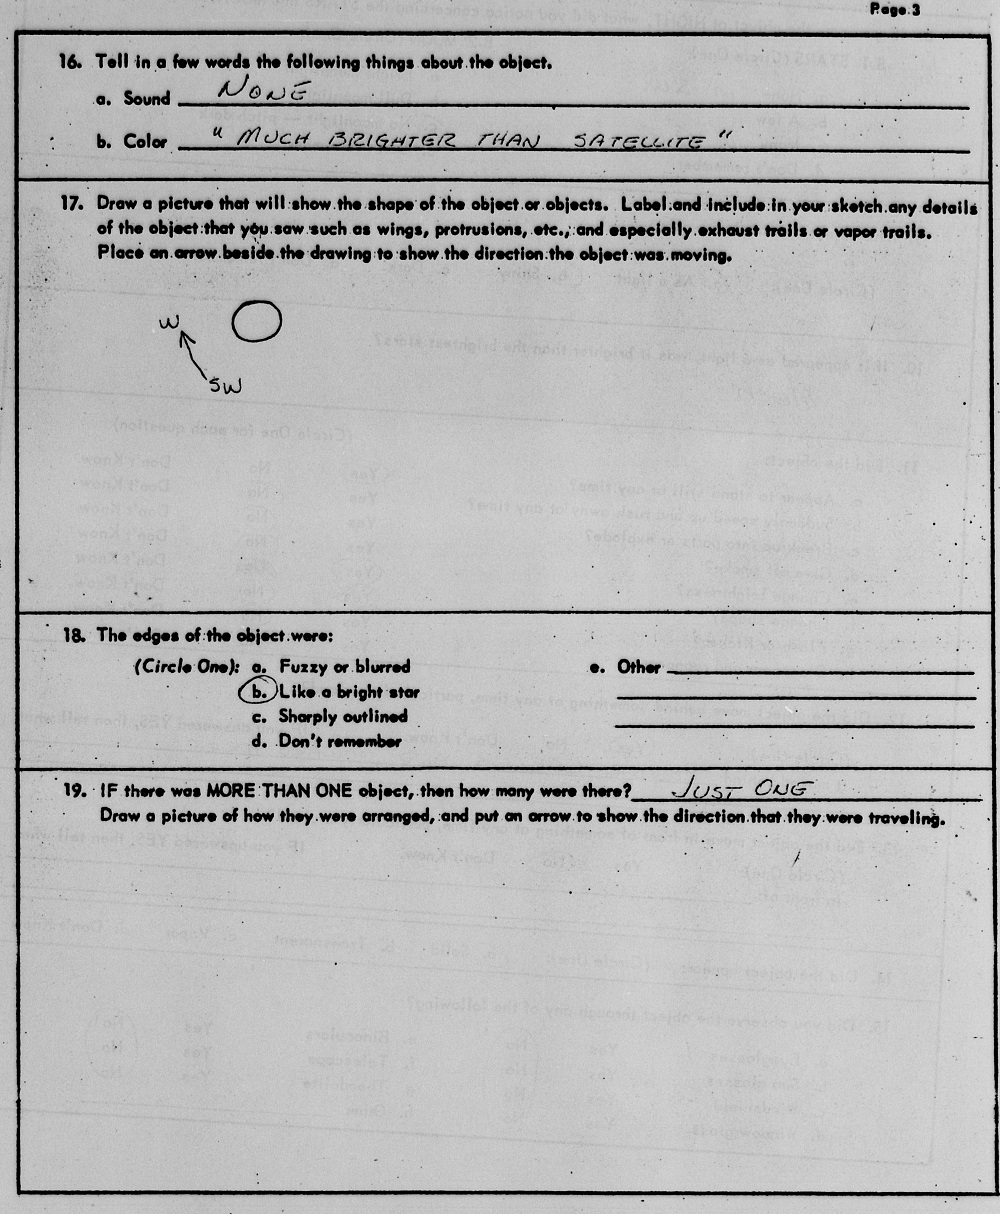
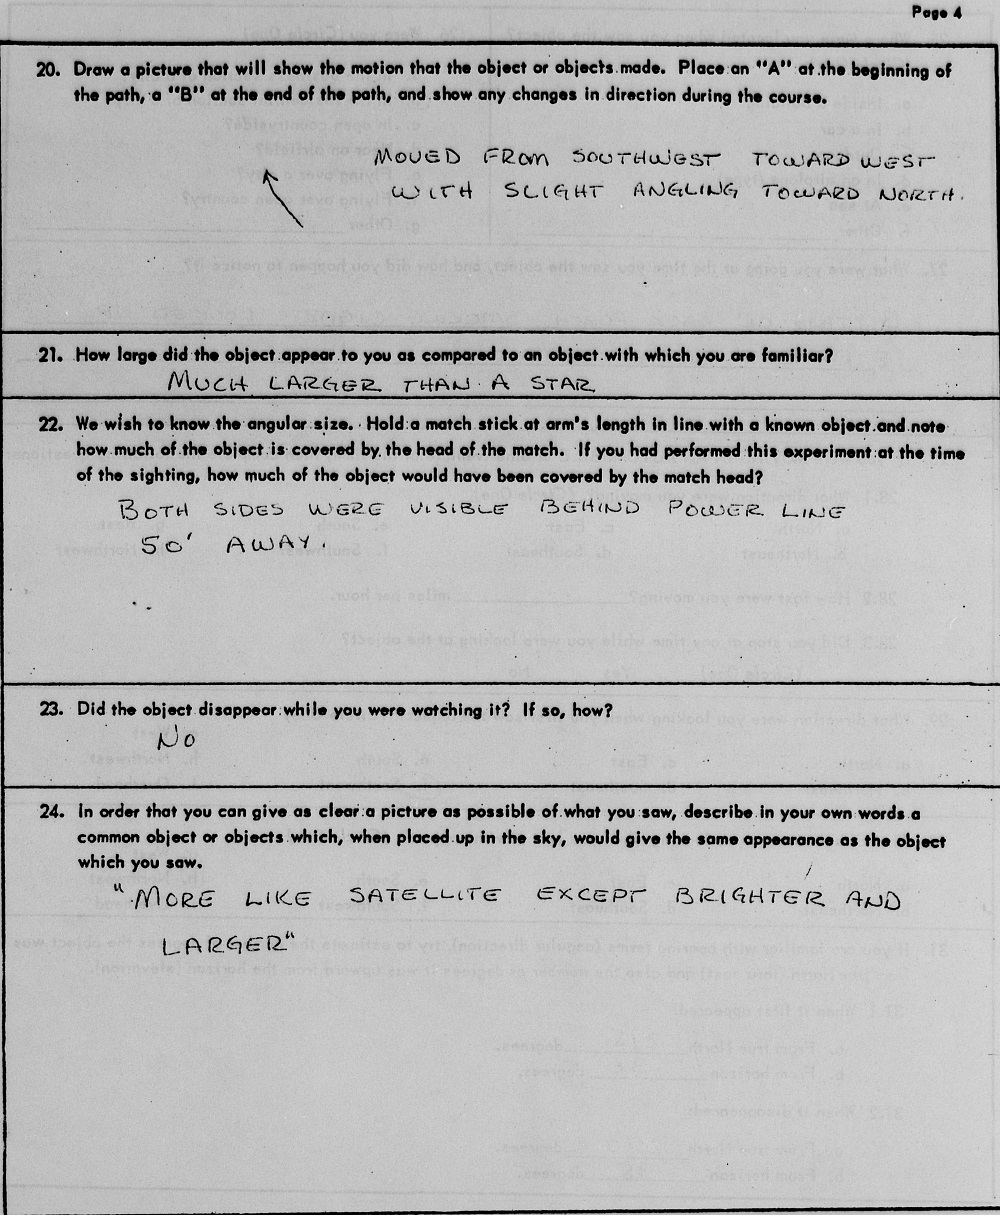
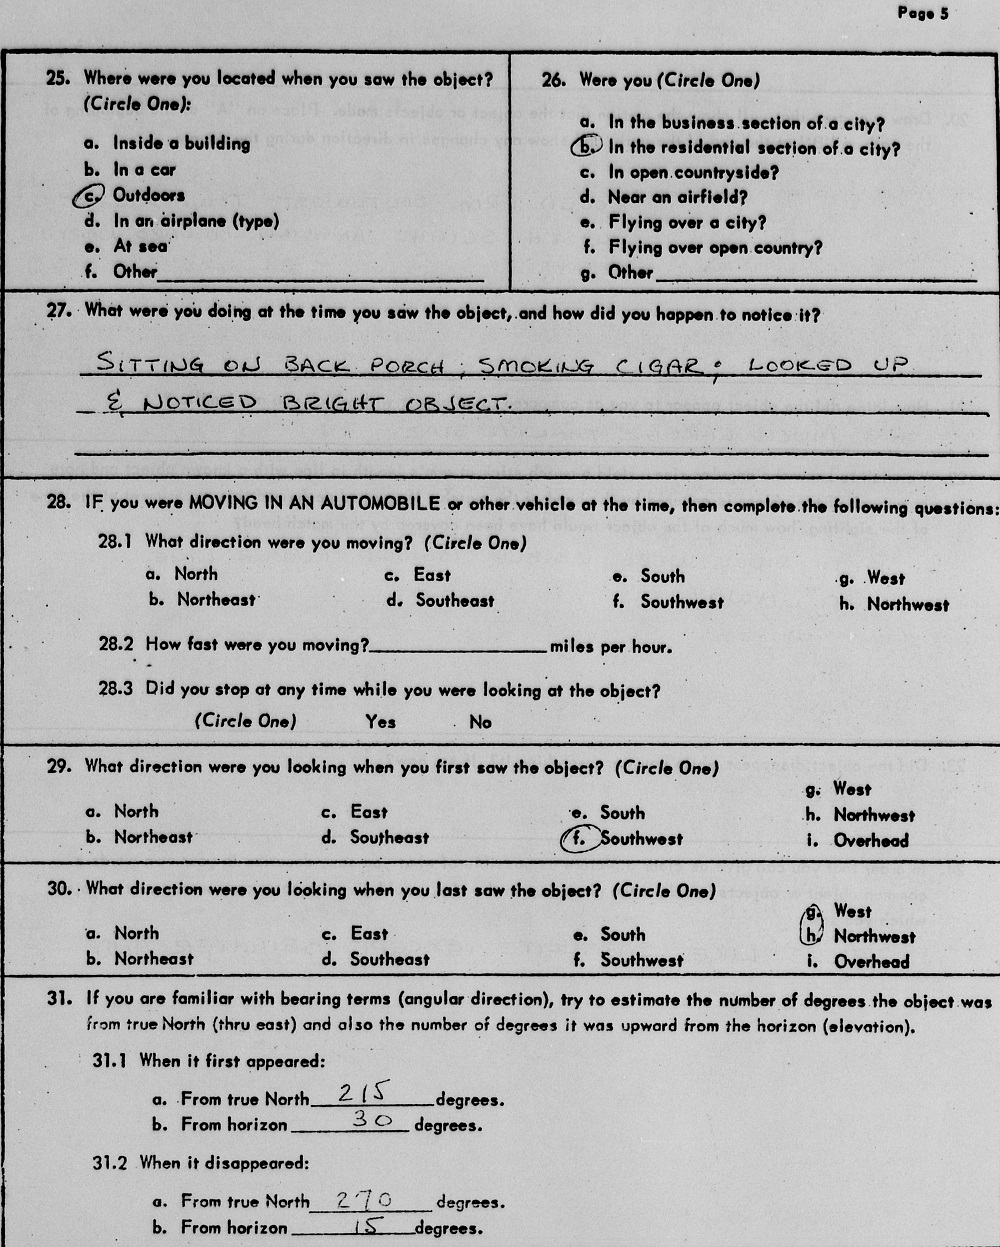
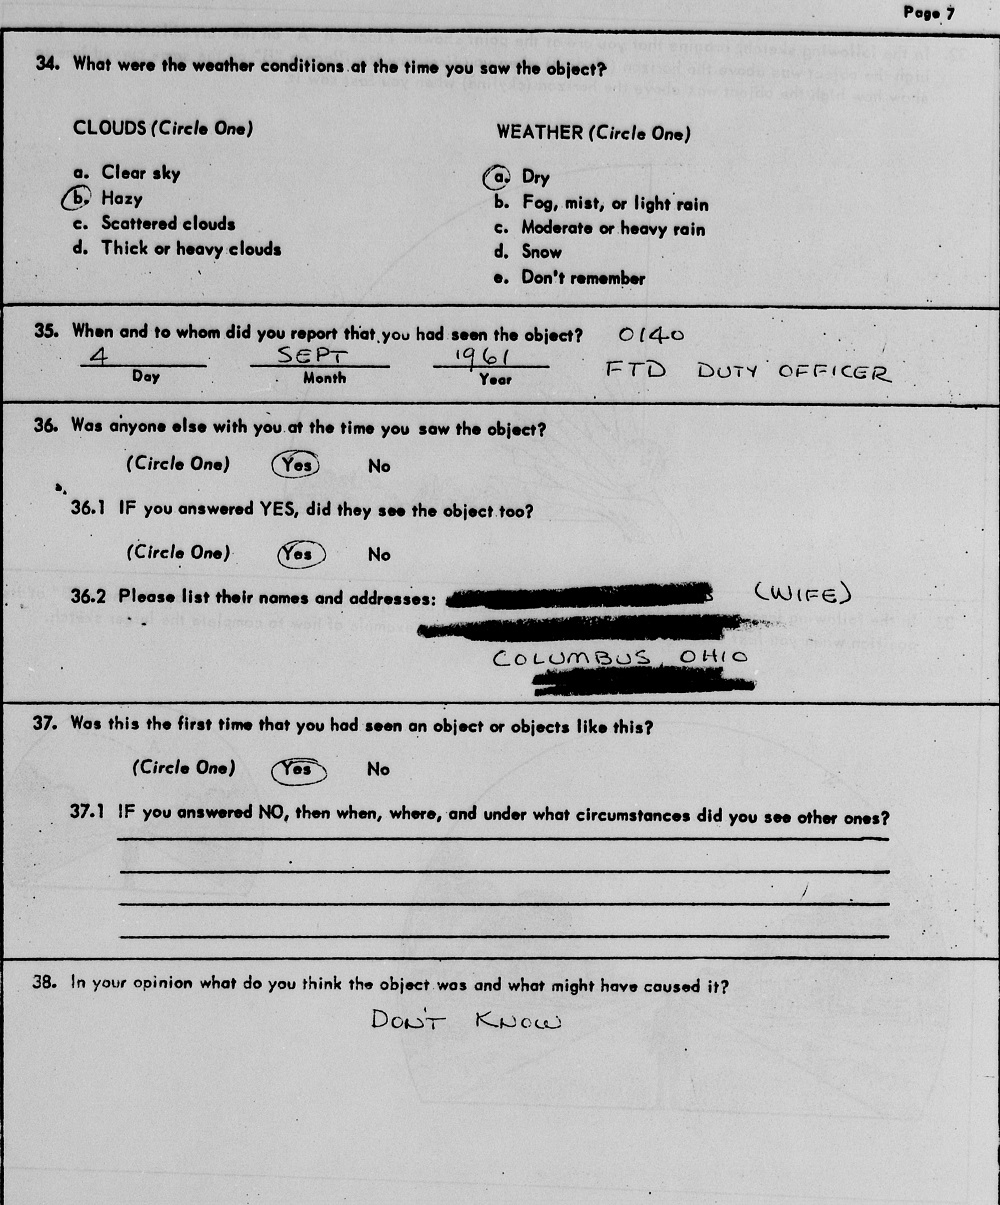
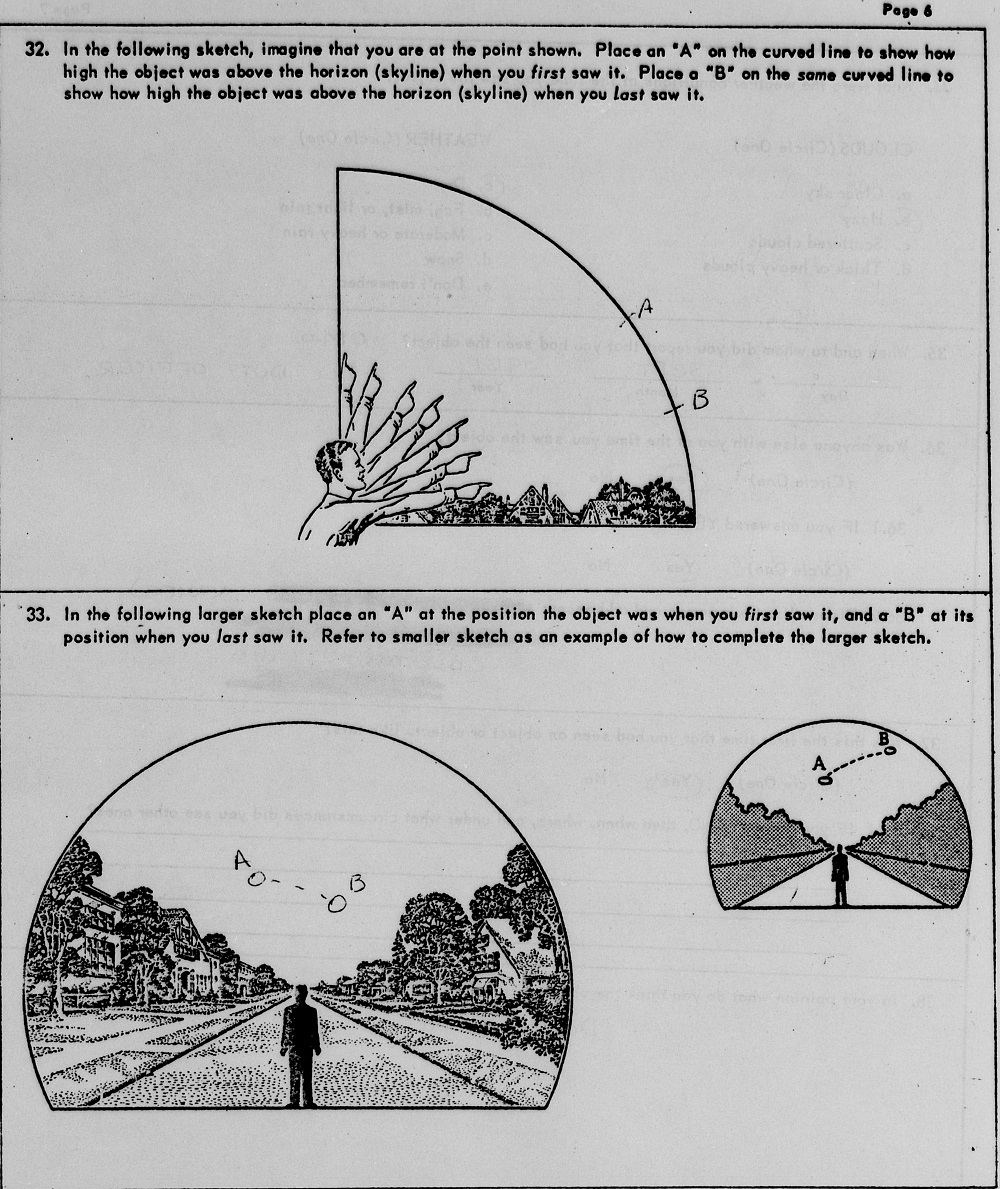
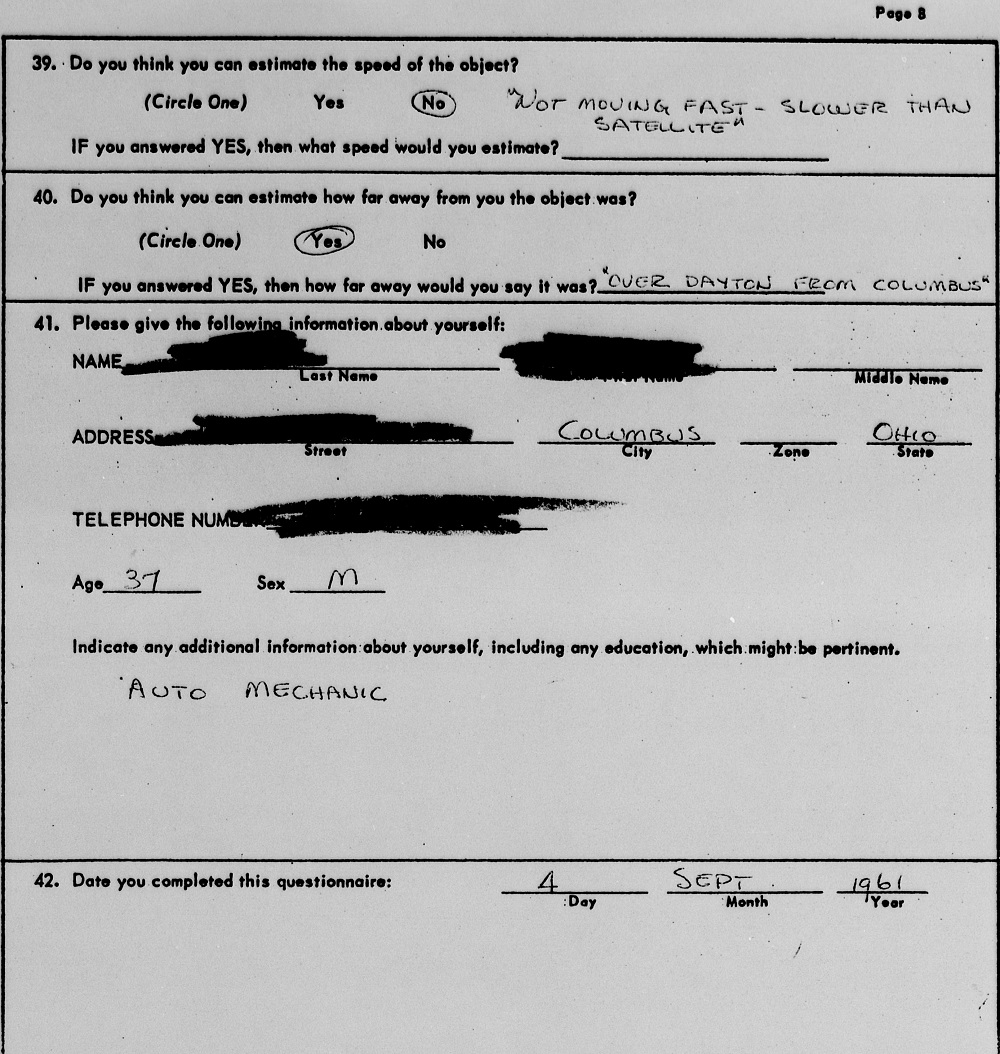
Th September 4, 1961 UFO event was witnessed by someone sitting on their back porch in the early morning hours. It was concluded to have been Jupiter, a seemingly common outcome with these sightings.

Th September 4, 1961 UFO event was witnessed by someone sitting on their back porch in the early morning hours. It was concluded to have been Jupiter, a seemingly common outcome with these sightings.

The July 24, 1960 meteor occurred during the early morning hours, and at first was reported to Lockbourne AFB as a possible UFO. The case was actually investigated as a Project Blue Book case, but the description and multiple eyewitness reports across the region supported that this was a meteor.
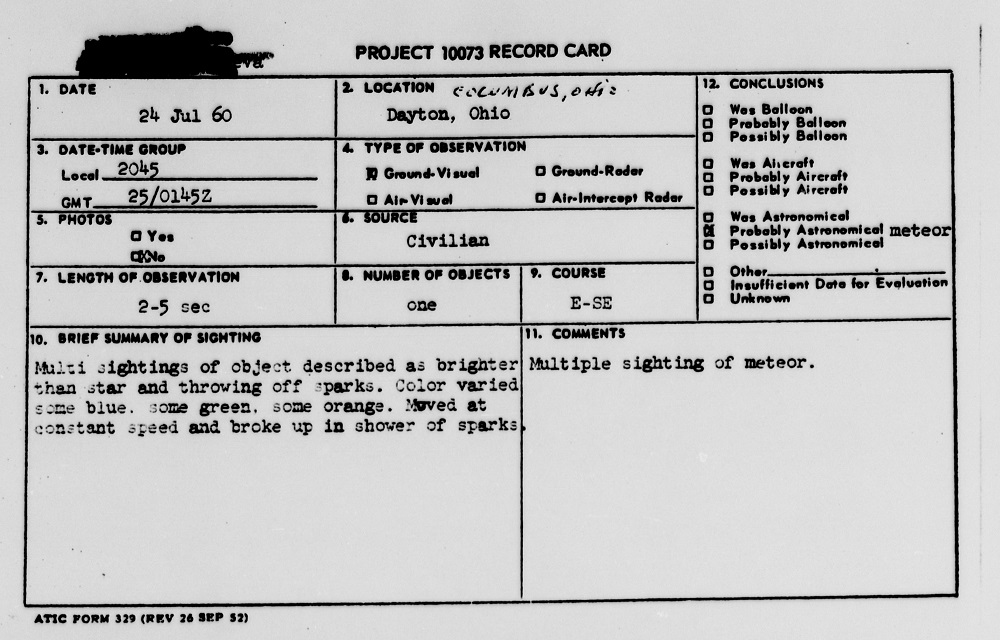
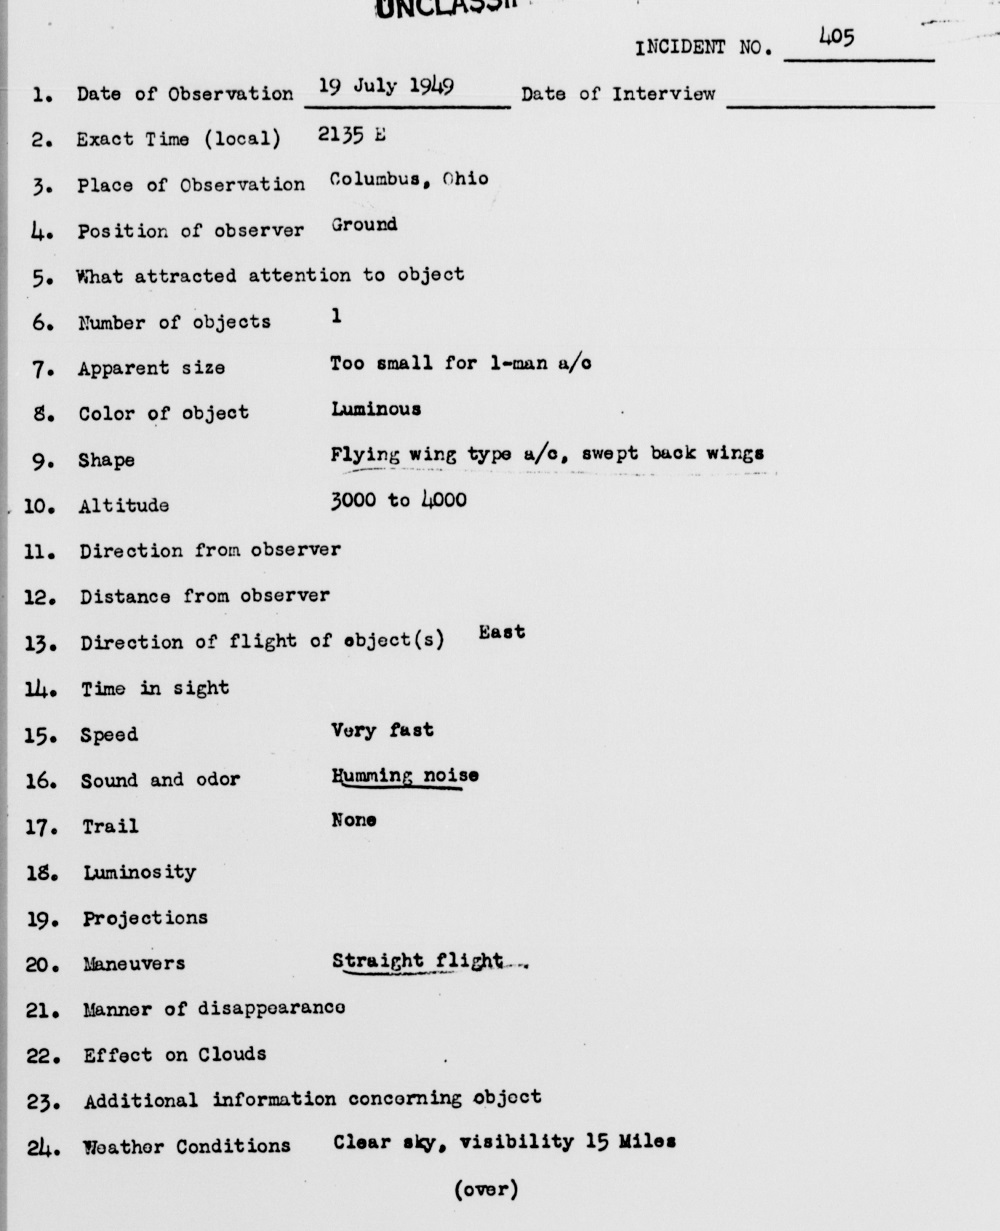
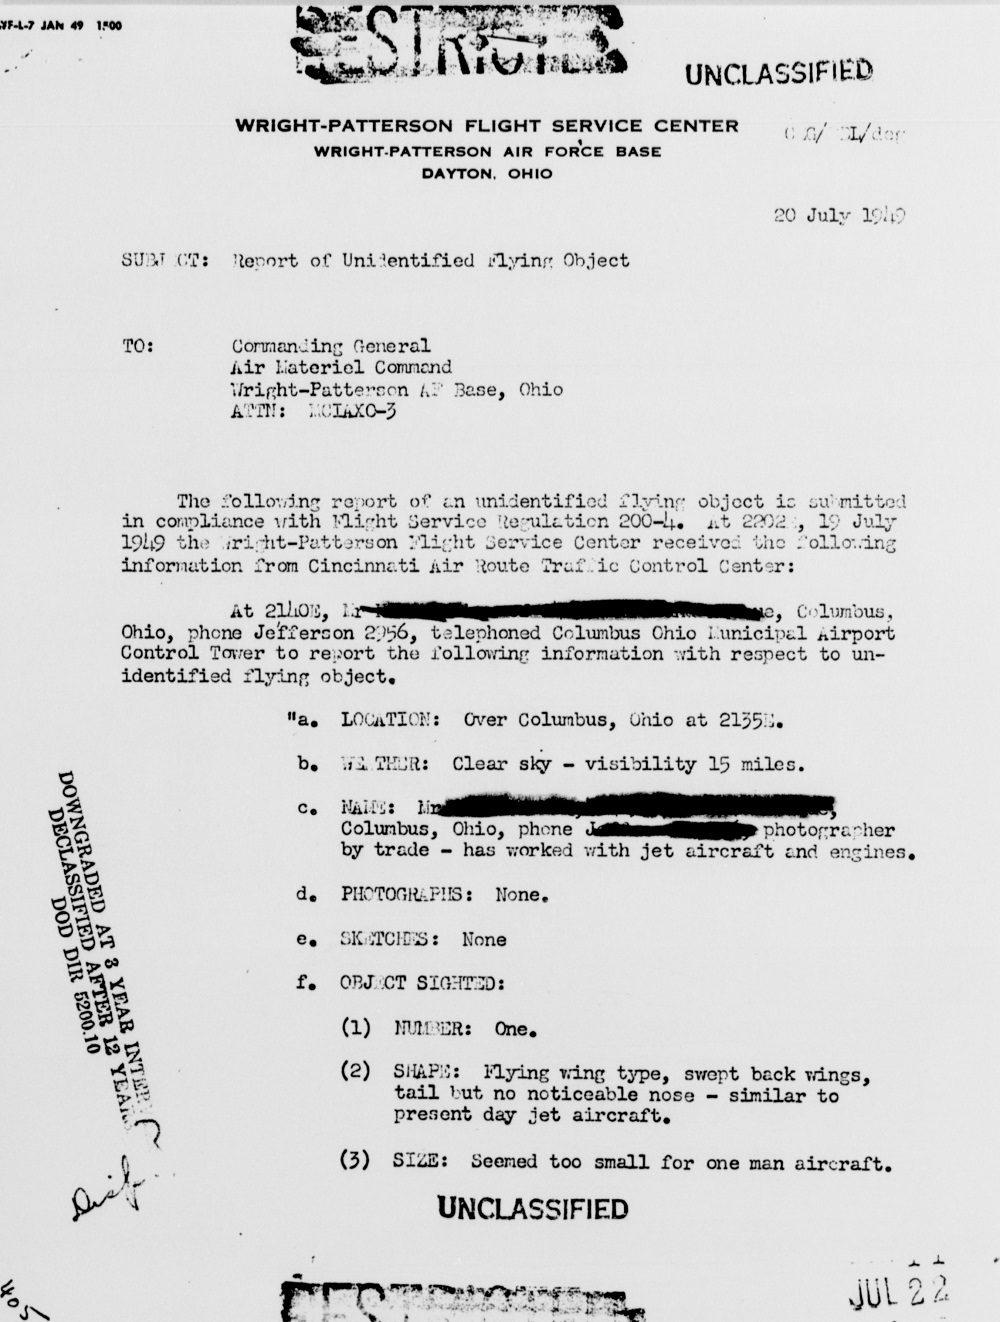
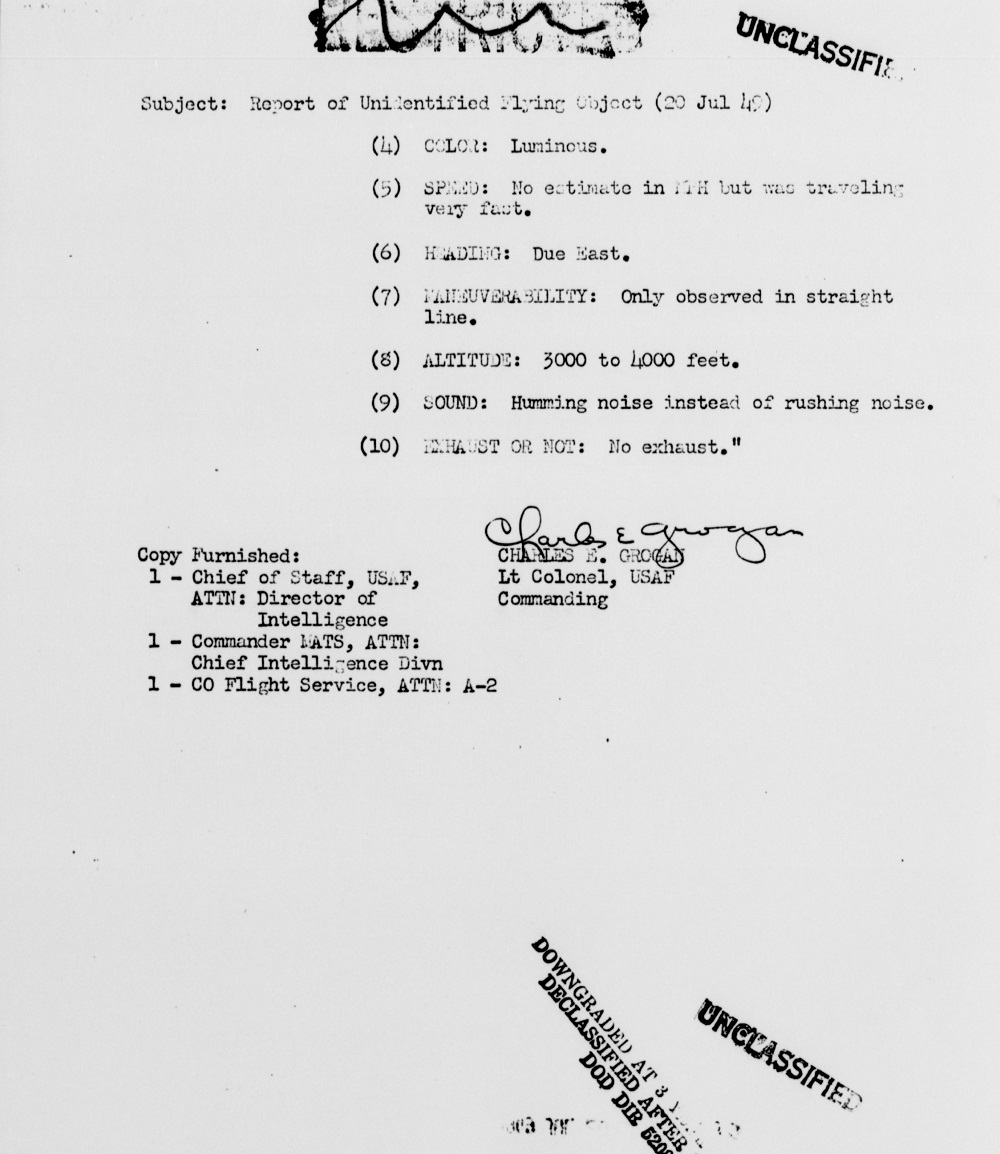
Unfortunately, much of the original report notes beyond the introductory page have faded to the point where it is difficult or impossible to read them. Still, the forms are provided below in a PDF. Perhaps someone is able to make out more than I could.
Full Report
In the past, I’ve done individual housing market update reports on a monthly basis, but it’s proven to be somewhat impractical from a time management perspective. For 2023, I’ve decided to just do two main updates, one for the mid-year point and the other in December for the year as a whole.
Some changes for the mid-year update format will be that I will include all information January-June for all the Columbus market areas. For the larger tables, you can scroll to see all months.
Top 20 Most Expensive Markets by Median Sales Price January-June
Rank | January | February | March | April | May | June | January-June Median |
1 | Olentangy LSD: $520,531 | New Albany: $921,425 | New Albany: $1,112,875 | New Albany: $975,000 | New Albany: $820,000 | New Albany: $788,500 | New Albany: $925,000 |
2 | Dublin/Dublin CSD: $519,900 | New Albany Plain LSD: $750,000 | Grandview Heights: $715,000 | New Albany Plain LSD: $899,000 | Grandview Heights: $752,000 | Powell: $686,255 | New Albany Plain LSD: $655,000 |
3 | New Albany: $501,010 | Powell: $613,255 | New Albany Plain LSD: $684,250 | Dublin: $585,000 | Upper Arlington CSD: $691,000 | New Albany Plain LSD: $655,000 | Powell: $620,000 |
4 | Granville CSD: $500,000 | Dublin: $590,000 | Powell: $612,450 | Olentangy LSD: $564,000 | Powell: $640,000 | Upper Arlington CSD: $625,000 | Upper Arlington CSD: $607,000 |
5 | Johnstown-Monroe LSD: $499,000 | Bexley: $581,250 | Granville CSD: $567,500 | Upper Arlington CSD: $550,000 | New Albany Plain LSD: $639,900 | Dublin: $585,000 | Dublin: $570,000 |
6 | Big Walnut LSD: $470,000 | Big Walnut LSD: $515,900 | German Village: $565,000 | German Village: $528,500 | Dublin: $580,000 | Bexley: $550,500 | Olentangy LSD: $540,792 |
7 | Worthington: $467,500 | Olentangy LSD: $499,050 | Olentangy LSD: $550,000 | Bexley: $515,000 | Olentangy LSD: $568,000 | German Village: $545,000 | German Village: $530,000 |
8 | Jonathan Alder LSD: $446,250 | Upper Arlington CSD: $467,875 | Upper Arlington CSD: $527,500 | Powell: $505,000 | Dublin CSD: $527,500 | Olentangy LSD: $540,000 | Bexley: $515,000 |
9 | Buckeye Valley LSD: $445,000 | Dublin CSD: $463,975 | Dublin: $525,000 | Buckeye Valley LSD: $499,000 | German Village: $516,500 | Granville CSD: $525,000 | Dublin CSD: $511,500 |
10 | Powell: $440,000 | Worthington: $450,000 | Big Walnut LSD: $496,379 | Dublin CSD: $485,000 | Worthington: $510,444 | Buckeye Valley LSD: $508,635 | Granville CSD: $500,000 |
11 | New Albany Plain LSD: $430,000 | German Village: $450,000 | Bexley: $484,250 | Big Walnut LSD: $475,000 | Big Walnut LSD: $497,000 | Dublin CSD: $493,418 | Buckeye Valley LSD: $483,900 |
12 | Upper Arlington CSD: $426,250 | Hilliard: $438,000 | Dublin CSD: $475,000 | Sunbury: $462,350 | Short North: $495,000 | Lithopolis: $485,000 | Big Walnut LSD: $480,000 |
13 | Northridge LSD: $405,200 | Downtown: $430,000 | Buckeye Valley LSD/Sunbury: $438,500 | Granville CSD: $450,000 | Buckeye Valley LSD: $489,598 | Northridge LSD: $480,790 | Worthington: $437,500 |
14 | German Village: $405,000 | Granville CSD: $420,000 | Johnstown-Monroe LSD: $438,000 | Short North: $432,000 | Granville CSD: $484,950 | Short North: $480,000 | Short North: $425,000 |
15 | Grandview Heights: $400,000 | Beechwold/Clintonville: $407,500 | Minerva Park: $432,000 | Pickerington: $427,738 | Pickerington: $450,000 | Grandview Heights: $455,000 | Sunbury: $420,000 |
16 | Lithopolis: $383,000 | Lithopolis: $405,400 | Westerville: $415,000 | Beechwold/Clintonville: $425,500 | Sunbury: $449,500 | Worthington: $450,000 | Pickerington: $406,200 |
17 | Bexley: $380,000 | Worthington CSD: $400,000 | Hilliard: $410,000 | Hilliard: $421,200 | Jonathan Alder LSD: $445,000 | Gahanna Jefferson CSD: $437,500 | Johnstown-Monroe LSD: $399,950 |
18 | Pickerington: $370,000 | Short North: $386,650 | Northridge LSD: $402,690 | Pickerington LSD: $415,000 | Bexley: $430,000 | Jonathan Alder LSD: $436,000 | Lithopolis: $396,000 |
19 | Minerva Park: $367,500 | Westerville: $379,900 | Lithopolis: $396,000 | Worthington: $395,000 | Northridge LSD: $412,500 | Downtown: $427,000 | Pickerington LSD: $390,000 |
20 | Sunbury: $339,700 | Pickertington/Pickerington CSD: $370,000 | Worthington: $391,000 | Grandview Heights/Lithopolis: $388,000 | Pickerington LSD: $410,000 | Hilliard: $420,000 | Westerville: $389,888 |
Top 20 Least Expensive Markets by Median Sales Price January-June
Rank | January | February | March | April | May | June | January-June Avg Median |
1 | Obetz: $159,900 | Miami Trace LSD: $145,000 | Circleville CSD: $163,350 | Miami Trace LSD: $177,000 | London CSD: $190,000 | Lancaster CSD: $200,500 | Miami Trace LSD: $184,500 |
2 | Miami Trace LSD: $162,500 | Whitehall: $165,000 | Miami Trace LSD: $170,750 | Lancaster CSD: $183,500 | Whitehall: $192,000 | London CSD: $225,158 | Whitehall: $187,500 |
3 | Whitehall: $169,500 | Obetz: $186,500 | Lancaster CSD: $174,900 | Whitehall: $190,000 | Newark CSD: $215,000 | Miami Trace LSD: $227,000 | Lancaster CSD: $199,900 |
4 | Lancaster CSD: $185,500 | Lancaster CSD: $195,000 | Newark CSD: $178,388 | Newark CSD: $198,000 | Lancaster CSD: $224,500 | Circleville CSD: $229,500 | Newark CSD: $209,500 |
5 | Newark CSD: $205,000 | Jefferson LSD: $196,400 | Whitehall: $199,900 | Circleville CSD: $216,000 | Circleville CSD: $234,950 | Jefferson LSD: $240,000 | Circleville CSD: $228,000 |
6 | Columbus CSD: $214,000 | Hamilton LSD: $205,900 | Columbus CSD: $229,900 | Hamilton LSD: $235,000 | Miami Trace LSD: $242,450 | Newark CSD: $243,500 | Hamilton LSD: $237,500 |
7 | London CSD: $215,000 | Grandview Heights: $209,500 | Hamilton LSD: $249,000 | Groveport Madison LSD: $235,500 | Hamilton LSD: $250,000 | Hamilton LSD: $245,000 | Jefferson LSD: $238,000 |
8 | Hamilton LSD: $217,000 | Newark CSD: $217,500 | Groveport Madison LSD: $250,000 | Jefferson LSD: $250,425 | Columbus CSD: $255,000 | Whitehall: $245,900 | London CSD: $240,158 |
9 | Jefferson LSD: $223,500 | Minerva Park: $223,000 | Jefferson LSD: $255,000 | Columbus CSD: $255,000 | Obetz: $268,000 | Obetz: $250,000 | Columbus CSD: $243,000 |
10 | Groveport Madison LSD: $225,000 | London CSD: $224,038 | Columbus/Reynoldsburg CSD: $255,000 | London CSD: $257,500 | Groveport Madison LSD: $270,000 | Groveport Madison LSD: $261,500 | Groveport Madison LSD: $250,000 |
11 | Columbus: $230,000 | Columbus CSD: $231,750 | South-Western CSD: $285,000 | Columbus: $270,000 | Columbus: $280,000 | Columbus CSD: $265,000 | Columbus: $265,000 |
12 | Reynoldsburg CSD: $240,000 | Groveport Madison LSD: $243,500 | Blacklick: $317,000 | Obetz: $285,000 | South-Wester CSD: $300,000 | Reynoldsburg CSD: $270,000 | Obetz: $276,000 |
13 | Circleville CSD: $249,900 | Columbus: $250,000 | Gahanna: $317,049 | South-Western CSD: $287,950 | Minerva Park: $300,500 | Columbus: $283,500 | South-Western CSD: $287,000 |
14 | South-Western CSD: $263,500 | Circleville CSD: $250,000 | Delaware CSD: $322,500 | Marysville CSD: $300,000 | Reynoldsburg CSD: $313,000 | South-Western CSD: $300,000 | Marysville CSD: $322,000 |
15 | Worthington CSD: $273,500 | South-Western CSD: $260,000 | Marysville CSD: $325,000 | Blacklick: $309,500 | Canal Winchester CSD: $320,000 | Marysville CSD: $318,750 | Canal Winchester CSD: $325,000 |
16 | Canal Winchester CSD: $295,000 | Reynoldsburg CSD: $293,500 | Canal Winchester CSD: $327,500 | Johnstown-Monroe LSD: $311,000 | Pataskala: $339,500 | Blacklick: $348,000 | Blacklick: $330,100 |
17 | Blacklick: $299,000 | Marysville CSD: $299,900 | Gahanna Jefferson CSD: $329,750 | Teays Valley LSD: $312,900 | Marysville CSD: $342,500 | Teays Valley LSD: $348,810 | Pataskala: $344,000 |
18 | Teays Valley LSD: $300,000 | Buckeye Valley LSD: $302,450 | Pataskala: $340,000 | Canal Winchester CSD: $325,000 | Westerville CSD: $346,000 | Grove City: $352,041 | Teays Valley LSD: $345,000 |
19 | Delaware CSD: $310,000 | Gahanna: $303,500 | Beechwold/Clintonville: $343,500 | Worthington CSD: $329,101 | Downtown/Grove City: $350,000 | Delaware CSD: $360,000 | Grove City: $350,000 |
20 | Westerville CSD: $324,900 | Grove City: $310,000 | Obetz/Hilliard CSD: $345,000 | Reynoldsburg CSD: $330,000 | Gahanna: $353,500 | Pataskala: $367,500 | Delaware CSD: $350,500 |
Top 10 Markets with the Largest Median Sales Price Change Year-to-Date June 2022 to June 2023
Rank | Year to Date June 2022 to June 2023 |
1 | New Albany: $100,000 |
2 | Dublin CSD: $66,500 |
3 | Minerva Park: $55,400 |
4 | Bexley: $55,000 |
5 | German Village: $50,000 |
6 | Upper Arlington CSD: $46,550 |
7 | Dublin: $45,000 |
8 | Buckeye Valley LSD: $41,900 |
9 | Newark CSD: $39,723 |
10 | Lithopolis: $36,000 |
Top 10 Markets with the Smallest Median Sales Price Change Year-to-Date June 2022 to June 2023
Rank | Year-to-Date June 2022 to June 2023 |
1 | Grandview Heights: -$70,000 |
2 | Granville CSD: -$25,000 |
3 | Canal Winchester CSD: -$20,750 |
4 | Pataskala: -$20,000 |
5 | Miami Trace LSD: -$9,500 |
6 | Jefferson LSD: -$3,200 |
7 | Marysville CSD: -$2,700 |
8 | London CSD: -$1,842 |
9 | Pickerington LSD: -$350 |
10 | Gahanna: -$250 |
Top 10 Markets with the Most New Listings Year-to-Date June 2022 to June 2023
Rank | January-June Total Closed Sales | Year-to-Date Change June 2022 to June 2023 |
1 | Columbus: 4,526 | -19.8% |
2 | Columbus CSD: 3,060 | -21.1% |
3 | South-Western CSD: 805 | -16.3% |
4 | Olentangy LSD: 678 | -1.2% |
5 | Hilliard CSD: 539 | -10.9% |
6 | Westerville CSD: 523 | -20.0% |
7 | Dublin CSD: 476 | -16.8% |
8 | Pickerington LSD: 367 | +4.6% |
9 | Grove City: 319 | -22.6% |
10 | Worthington: 319 | -15.6% |
Top 10 Markets with the Most Closed Sales Year-to-Date June 2022 to June 2023
Rank | January-June Total Closed Sales | Year-to-Date Change June 2022 to June 2023 |
1 | Columbus: 4,526 | -19.8% |
2 | Columbus CSD: 3,060 | -21.1% |
3 | South-Western CSD: 805 | -16.3% |
4 | Olentangy LSD: 678 | -1.2% |
5 | Hilliard CSD: 539 | -10.9% |
6 | Westerville CSD: 523 | -20.0% |
7 | Dublin CSD: 476 | -16.8% |
8 | Pickerington LSD: 367 | +4.6% |
9 | Grove City: 319 | -22.6% |
10 | Worthington: 319 | -15.6% |
Top 10 Fastest-Selling Markets Year-to-Date 2023 by # of Days on Market Before Sale
Rank | # of Days Before Sale | Year-to-Date 2022 to 2023 |
1 | Westerville: 10 | 66.7% |
2 | Westerville CSD: 13 | 62.5% |
3 | Gahanna: 14 | 133.3% |
4 | Hilliard: 14 | 100% |
5 | Minerva Park: 14 | 180% |
6 | New Albany Plain LSD: 14 | -17.6% |
7 | Dublin: 15 | 50% |
8 | Worthington CSD: 15 | 114.3% |
9 | Bexley: 17 | 13.3% |
10 | German Village: 17 | 41.7% |
11 | Worthington: 17 | 142.9% |
Rank | # of Days Before Sale | Year-to-Date June 2022 to June 2023 |
1 | Teays Valley LSD: 63 | 162.5% |
2 | Downtown: 62 | 5.1% |
3 | Jonathan Alder LSD: 48 | 200% |
4 | Northridge LSD: 42 | -41.7% |
5 | Lithopolis: 37 | 516.7% |
6 | Powell: 37 | 164.3% |
7 | Short North: 37 | 19.4% |
8 | Big Walnut LSD: 36 | 140% |
9 | Obetz: 36 | 125% |
10 | Buckeye Valley LSD: 34 | 36% |
11 | Miami Trace LSD: 34 | 142.9% |
12 | Olentangy LSD: 34 | 112.5% |
13 | Pataskala: 34 | 61.9% |

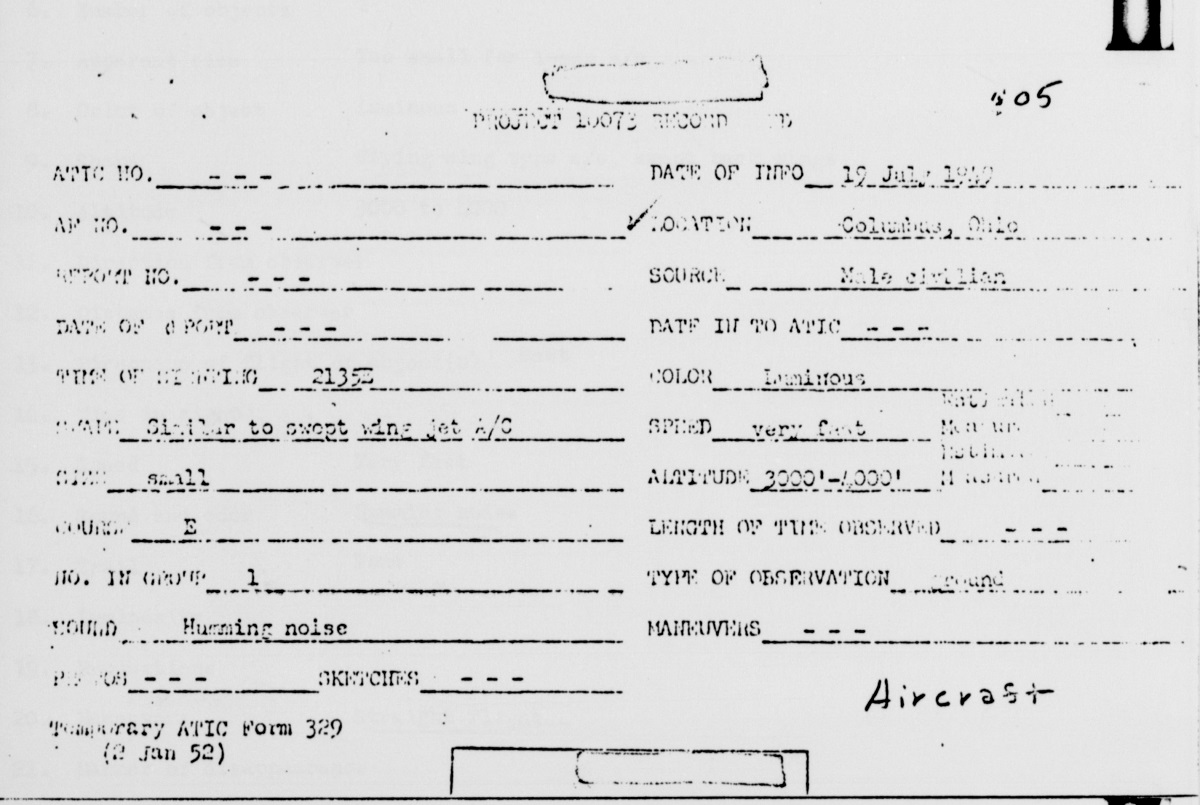
From the files of Project Blue Book, this July 19, 1949 UFO incident seems to have been a pretty straightforward airplane that was misidentified.
For more incidents around the world, visit the following links.
UFO Database
Mutual UFO Network
National UFO Reporting Center

A scene largely absent from the 2022-2023 winter.
The Winter 2022-2023 Review shows that the season was one of the warmest ever recorded for Columbus, with near consistent above average- and sometimes record-breaking temperatures. Snow, as a consequence, was well below average.
The rankings below are good through the 2022-2023 season.
December-February Only
Average High: 45.8 4th Warmest
Average Low: 29.4 7th Warmest
Mean: 37.6 5th Warmest
Precipitation: 7.80″ 62nd Wettest
Snowfall: 11.2″ 30th Least Snowy
Average Daily Snow Depth: 0.3″ Tied for 4th Lowest
Largest Snowstorm: 4.9″ on 12/23/2022
# of 32 or Below Highs: 10 5th Fewest
# of 32 or Below Lows: 51 Tied for 4th Fewest
# of Measurable Precipitation Days: 40 Tied for 13th Most
# of Measurable Snowfall Days: 10 Tied for 6th Fewest
Highest Average Daily Wind Speed in MPH: 23.3 on 12/23/2022
Highest Wind Gust in MPH: 54 on 1/19/2023
# of Clear Days: 6 6.67%
# of Partly Cloudy Days: 38 42.22%
# of Cloudy Days: 46 51.11%
Early winter ended up being the coldest and snowiest part of the season, with every subsequent month getting warmer. There were very few freezing days during the heart of the winter, and despite a somewhat stormy pattern with seemingly endless windy days, there was relatively little precipitation.
The biggest snowstorm was on December 23rd, when a very strong low pressure system and cold front brought heavy snow and very cold temperatures, making for one of the coldest Christmas Eves and Days in many years.
Entire Cold Season: October-April
Average High: 53.8 3rd Warmest
Average Low: 34.5 Tied for 14th Warmest
Mean: 44.1 Tied for 6th Warmest
Precipitation: 19.13″ 63rd Driest
Snowfall: 14.5″ Tied for 21st Least Snowy
Average Snow Depth: 0.1″ Tied for 2nd Lowest
Largest Snowstorm: 4.9″ on 12/23/2022
# of 32 or Below Highs: 11 Tied for 2nd Fewest
# of 32 or Below Lows: 83 6th Fewest
# of Measurable Precipitation Days: 79 Tied for 14th Fewest
# of Measurable Snowfall Days: 15 Tied for 6th Fewest
Highest Average Daily Wind Speed in MPH: 23.3 on 12/23/2022
Highest Wind Gust in MPH: 59 on 3/3/2023
# of Clear Days: 30 14.15%
# of Partly Cloudy Days: 95 44.81%
# of Cloudy Days: 87 41.04%
The entire cold season didn’t really live up to its name. All months except October ended up above normal. Now let’s break down those months individually.
Average High By Month
October 2022: 65.6 44th Warmest
November 2022: 54.6 Tied for 19th Warmest
December 2022: 41.8 Tied for 36th Warmest
January 2023: 43.8 13th Warmest
February 2023: 52.3 1st Warmest
March 2023: 52.6 33rd Warmest
April 2023: 65.7 20th Warmest
February, 2023 had the warmest average high mean on record, beating the next closest year- 2017- by 0.5 degrees.
Average Low By Month
October 2022: 42.7 Tied for 28th Coldest
November 2022: 36.0 29th Warmest
December 2022: 27.4 Tied for 40th Warmest
January 2023: 31.0 6th Warmest
February 2023: 30.0 10th Warmest
March 2023: 32.1 Tied for 45th Warmest
April 2023: 42.0 Tied for 35th Warmest
Mean By Month
October 2022: 54.1 Tied for 33rd Coldest
November 2022: 45.3 Tied for 18th Warmest
December 2022: 34.6 Tied for 37th Warmest
January 2023: 37.4 10th Warmest
February 2023: 41.1 3rd Warmest
March 2023: 42.4 Tied for 40th Warmest
April 2023: 53.9 Tied for 23rd Warmest
Precipitation By Month
October 2022: 0.60″ 11th Driest
November 2022: 2.34″ 58th Driest
December 2022: 2.02″ 39th Driest
January 2023: 4.16″ 28th Wettest
February 2023: 1.62″ Tied for 41st Driest
March 2023: 5.22″ 17th Wettest
April 2023: 3.17″ Tied for 64th Wettest
Snowfall By Month
October 2022: Trace Tied for 2nd Least Snowy
November 2022: 0.3″ Tied for 5th Least Snowy
December 2022: 5.8″ 38th Snowiest
January 2023: 5.4″ Tied for 39th Least Snowy
February 2023: Trace 1st Least Snowy
March 2023: 1.0″ Tied for 10th Least Snowy
April 2023: Trace Tied for 2nd Least Snowy
February’s Trace was the lowest ever recorded for the month.
Average Snow Depth By Month
October 2022: 0.0″
November 2022: 0.0″
December 2022: 0.7″
January 2023: 0.1″
February 2023: 0.0″
March 2023: 0.0″
April 2023: 0.0″
Maximum High By Month
October 2022: 77 on the 6th, 23rd and 24th
November 2022: 77 on the 5th
December 2022: 65 on the 30th
January 2023: 62 on the 3rd
February 2023: 73 on the 23rd
March 2023: 75 on the 1st
April 2023: 84 on the 20th
Maximum High Records
-The 77 on November 5th was a record for the date, beating the old record of 76 set in 1977.
– The 65 on December 30th was a record for the date, beating the old record of 63 set in 1964.
-The 72 on February 9th was a record for the date, beating the old record of 66 set in 2001.
-The 72 on February 15th was a record for the date, beating the old record of 70 set in 1954.
-The 73 on February 23rd was a record for the date, beating the old record of 72 set in 2017.
-The 75 on March 1st was a record for the date, beating the old record of 65 set in 1972 and 1997.
Minimum High By Month
October 2022: 45 on the 18th
November 2022: 30 on the 20th
December 2022: 14 on the 24th
January 2023: 26 on the 31st
February 2023: 30 on the 1st
March 2023: 33 on the 14th
April 2023: 46 on the 2nd and 17th
Maximum Low By Month
October 2022: 57 on the 31st
November 2022: 62 on the 5th
December 2022: 54 on the 30th
January 2023: 56 on the 3rd
February 2023: 47 on the 15th
March 2023: 47 on the 23rd
April 2023: 60 on the 5th
Maximum Low Records
-The 62 on November 6th was a record for the date, beating the old record of 61 set in 1977.
-The 49 on January 2nd tied the record for the date, matching 1997, 2000 and 2005.
-The 56 on January 3rd was a record for the date, beating the old record of 55 set in 1997.
Minimum Low By Month
October 2022: 32 on the 20th
November 2022: 17 on the 20th
December 2022: -7 on the 23rd
January 2023: 16 on the 15th
February 2023: 12 on the 4th
March 2023: 18 on the 19th
April 2023: 29 on the 25th
Highest Daily Precipitation by Month
October 2022: 0.15″ on the 12th and 30th
November 2022: 1.14″ on the 11th
December 2022: 0.44″ on the 15th
January 2023: 0.73″ on the 12th
February 2023: 0.73″ on the 27th
March 2023: 1.6″ on the 3rd
April 2023: 0.91″ on the 5th
Precipitation Records
-The 1.14″ on November 11th set a record for the date, beating the old record of 1.03″ set in 1995.
-The 1.60″ on March 3rd set a record for the date, beating the old record of 1.31″ set in 2020.
Highest Daily Snowfall By Month
October 2022: Trace on the 18th
November 2022: 0.2″ on the 12th
December 2022: 4.9″ on the 23rd
January 2023: 3.0″ on the 22nd
February 2023: Trace on the 3rd and 17th
March 2023: 0.4″ on the 12th and 13th
April 2023: Trace on the 17th
Deepest Snow Depth By Month
October 2022: 0.0″
November 2022: Trace on the 13th
December 2022: 4″ on the 23rd, 24th, 25th and 27th
January 2023: 2″ on the 23rd
February 2023: Trace on the 1st
March 2023: 1″ on the 14th
April 2023: 0.0″
Average Daily Wind Speed by Month in MPH
October 2022: 7.9
November 2022: 8.2
December 2022: 8.0
January 2023: 8.4
February 2023: 9.7
March 2023: 10.0
April 2023: 8.1
Highest Wind Gust by Month in MPH
October 2022: 38 on the 26th
November 2022: 44 on the 27th and 30th
December 2022: 46 on the 23rd
January 2023: 54 on the 19th
February 2023: 49 on the 9th
March 2023: 59 on the 3rd
April 2023: 50 on the 1st
Clear Days by Month
October 2022: 8 25.81%
November 2022: 6 20.0%
December 2022: 2 6.45%
January 2023: 0 0.0%
February 2023: 4 14.29%
March 2023: 5 16.13%
April 2023: 5 16.67%
Partly Cloudy Days by Month
October 2022: 17 54.84%
November 2022: 13 43.33%
December 2022: 10 32.26%
January 2023: 13 41.94%
February 2023: 15 53.57%
March 2023: 15 48.39%
April 2023: 12 40.0%
Cloudy Days by Month
October 2022: 6 19.35%
November 2022: 11 36.67%
December 2022: 19 61.29%
January 2023: 18 58.06%
February 2023: 9 32.14%
March 2023: 11 35.48%
April 2023: 13 43.33%