Housing Market Update May 2014


Housing market update May 2014

The housing market update May 2014 report for the Columbus area, courtesy of Columbus Realtorscontinued to show the 5-month long trend of sales being down. As with the previous 4 months, the main reason was high demand coupled with historically low supply.

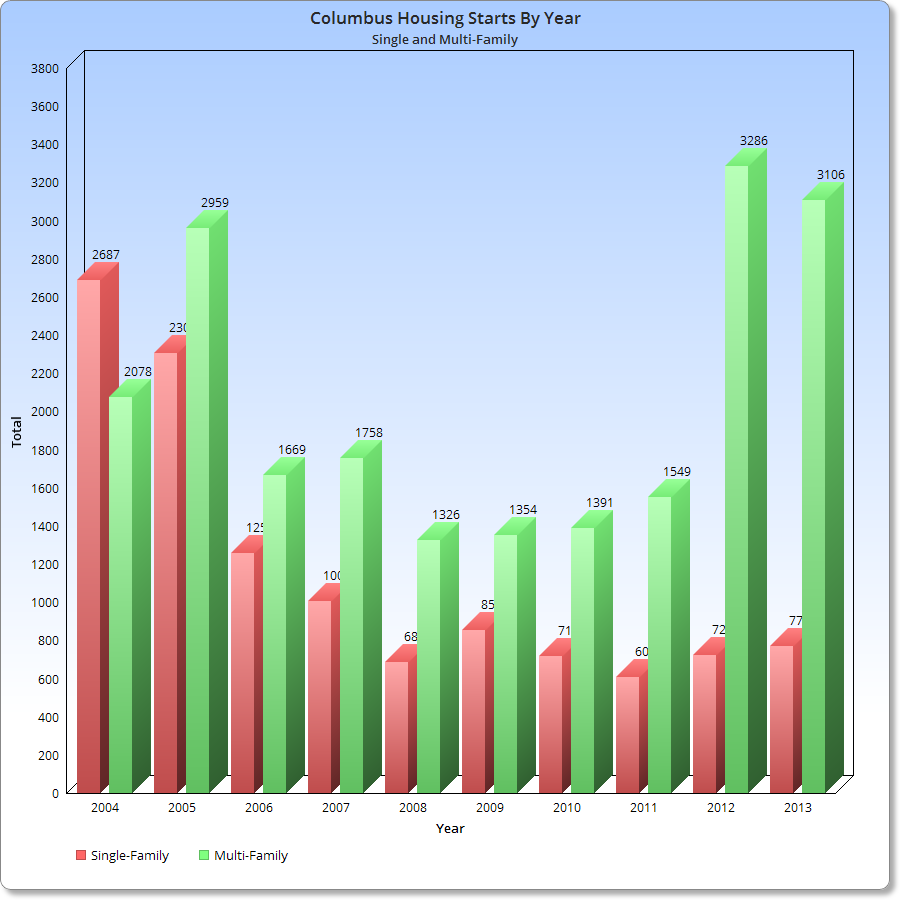
As for when this situation may change seems hard to guess. The rate of construction for single family homes shows no real signs of improving anytime soon, while renting continues to be the dominant choice right now.

Top 10 May 2014 Sales Totals
1. Columbus: 1,008
2. Grove City: 81
3. Clintonville: 73
4. Dublin: 73
5. Westerville: 67
6. Reynoldsburg: 59
7. Hilliard: 58
8. Upper Arlington: 55
9. Gahanna: 45
10. Pickerington: 36

Top 10 May 2014 Sales Increases over May 2013
1. New Albany: +35.3%
2. Pataskala: +35.0%
3. Obetz: +33.0%
4. Downtown: +30.0%
5. Grove City: +20.9%
6. Westerville: +3.1%
7. Pickerington: -2.7%
8. Hilliard: -4.9%
9. Columbus: -11.6%
10. Reynoldsburg: -11.9%

Top 10 Year-to-Date Sales Through May 2014
1. Columbus: 3,716
2. Dublin: 261
3. Grove City: 258
4. Clintonville: 248
5. Westerville: 229
6. Upper Arlington: 220
7. Reynoldsburg: 209
8. Hilliard: 187
9. Gahanna: 150
10. Pickerington: 108

Top 10 Year-to-Date Increases Through May 2014 Over 2013
1. Obetz: +118.2%
2. New Albany: +11.3%
3. Pataskala: +8.7%
4. Grove City: +5.3%
5. Reynoldsburg: +1.0%
6. Westerville: -3.0%
7. Clintonville: -5.0%
8. Downtown: -8.0%
9. German Village: -8.8%
10. Worthington: -9.2%

Average Sales May 2014
Urban: 114
Suburban: 49.6
Urban without Columbus: 25

Average % Change May 2014 vs. May 2013
Urban: -13.1%
Suburban: +1.4%
Urban without Columbus: -13.3%

Average YTD Sales Through May 2014
Urban: 419
Suburban: 167
Urban without Columbus: 89

Average YTD % Change YTD Through May 2014
Urban: -1.7%
Suburban: -6.0%
Urban without Columbus: -1.1%

Top 10 Average Sales Price May 2014
1. New Albany: $549,217
2. Dublin: $400,121
3. Bexley: $355,732
4. Upper Arlington: $345,156
5. German Village: $290,299
6. Downtown: $272,927
7. Worthington: $258,483
8. Grandview Heights: $238,333
9. Hilliard: $231,340
10. Westerville: $214,817

Top 10 Average Sales Price % Change May 2014 vs. May 2013
1. Obetz: +42.2%
2. Upper Arlington: +22.1%
3. Dublin: +18.6%
4. Westerville: +15.3%
5. Minerva Park: +14.5%
6. Grandview Heights: +12.5%
7. Reynoldsburg: +11.3%
8. Clintonville: +10.7%
9. Columbus: +9.4%
10. Pickerington: +9.3%

Top 10 Average Sales Prices YTD Through May 2014
1. New Albany: $491,395
2. Dublin: $356,009
3. Upper Arlington: $334,705
4. Bexley: $322,383
5. Downtown: $303,479
6. German Village: $297,917
7. Worthington: $256,332
8. Grandview Heights: $245,403
9. Hilliard: $222,793
10. Westerville: $207,854

Top 10 Average YTD Sales Price % Change Through May 2014 vs. 2013
1. Obetz: +50.8%
2. Grandview Heights: +20.5%
3. Pataskala: +15.9%
4. Grove City: +11.7%
5. Dublin: +11.6%
6. Pickerington: +11.3%
7. Westerville: +10.7%
8. Columbus: +9.7%
9. Worthington: +9.6%
10. Reynoldsburg: +9.2%

Average Sales Price May 2014
Urban: $221,969
Suburban: $240,310
Urban without Columbus: $229,903

Average Sales Price Change May 2014 vs. May 2013
Urban: +3.9%
Suburban: +4.5%
Urban without Columbus: +3.3%

Average Sales Price YTD Through May 2014
Urban: $217,709
Suburban: $227,022
Urban without Columbus: $226,296

Average Sales Price % Change YTD Through May 2014
Urban: +9.4%
Suburban: +8.0%
Urban without Columbus: +9.3%

Top 10 Fastest Selling Markets May 2014 (Based on Average # of Days for Listings to Sell)
1. Minerva Park: 7
2. Grandview Heights: 12
3. Upper Arlington: 19
4. Worthington: 27
5. Bexley: 31
6. Clintonville: 41
7. Westerville: 41
8. Dublin: 42
9. Obetz: 50
10. Hilliard: 52

Top 10 Fastest Selling Markets YTD Through May 2014
1. Minerva Park: 42
2. Obetz: 44
3. Worthington: 44
4. Upper Arlington: 47
5. Grandview Heights: 49
6. Hilliard: 50
7. Westerville: 55
8. Clintonville: 56
9. Pickerington: 58
10. Dublin: 62

Average # of Days Before Sale, May 2014
Urban: 41.7
Suburban: 63.1
Urban without Columbus: 39.9

Average # of Days Before Sale YTD Through May 2014
Urban: 61.4
Suburban: 72.0
Urban without Columbus: 60.0

Top 10 Lowest Market Housing Supplies May 2014 (Based on # of Months to Sell all Listings)
1. Worthington: 1.3
2. German Village: 1.7
3. Grandview Heights: 1.7
4. Westerville: 1.9
5. Clintonville: 2.0
6. Minerva Park: 2.2
7. Gahanna: 2.3
8. Hilliard: 2.3
9. Obetz: 2.4
10. Upper Arlington: 2.5

A healthy housing supply is considered to be around 5-6 months. Anything less than 3 months is considered very low.

Average # of Months to Sell All Listings, May 2014
Urban: 2.5
Suburban: 3.2
Urban without Columbus: 2.5

Average % Change of Single-Family Home Sales May 2014 vs. May 2013
Urban: -18.4%
Suburban: +4.6%
Urban without Columbus: -18.8%

Average % Change of Single-Family Home Sales YTD Through May 2014 vs. YTD 2013
Urban: -8.0%
Suburban: -6.1%
Urban without Columbus: -7.8%

Average % Change of Condo Sales May 2014 vs. May 2013
Urban: +26.3%
Suburban: -20.0%
Urban without Columbus: +29.0%

Average % Change of Condo Sales YTD Through May 2014 vs. YTD 2013
Urban: +22.0%
Suburban: -12.0%
Urban without Columbus: +24.0%


Disastrous Decision for the Columbus Convention Center


I’m not a complainer… or at the very least, I don’t prefer to be. That said, there are simply times where negativity makes perfectly logical sense, and where it can serve a real purpose for true positive change. That is arguably the case now, with the a very poor decision about the Columbus Convention Center. I’ve not posted too much on my personal views regarding development, but recent events have prompted me to give some of them on this particular project.

Back in March, it was revealed that the Greater Columbus Convention Center leadership had asked the local development community to come up with ideas for a potential expansion project for the convention center itself. The building was designed by famed 1980s and early 1990s architect Peter Eisenman (who also did the Wexner Center for the Arts), and began construction in 1989 and completed in 1990. Originally, the building included 1.4 million square feet of space, with a large parking lot occupying the southeast corner of the Goodale/N. High Street intersection.
Columbus convention center

In 1999, an expansion pushed the structure north nearly to Goodale, but left enough space for a small plaza there.

So even after the initial construction of the original building, there were obvious problems with the design, not least of which was the pastel color scheme better suited for Miami Beach. The building simply didn’t have any street-level presence. Beyond a few entrances, the convention center’s design essentially created a block-long wall along High Street. There was no ground floor retail, no restaurants and no pedestrian interaction whatsoever. Back in 1989, this was just fine and dandy, because no one really cared about that and hadn’t since the days before WWII. Cities had become showplaces and for big buildings and massive surface parking lots that didn’t actually bring anyone to live there. There was no reason to walk on the streets of the city, and architects certainly didn’t think it was necessary to build for that purpose. The suburbs were the real future, blah blah blah. Everyone knows that story.

Since 1999, the neighborhood around the convention center has been rocketing upward in popularity. The nearby Arena District continued to grow and add development, and the Short North continued to rapidly revitalize and is now the city’s hottest neighborhood. For the past few years, there has been a push to attract more business to Columbus via the center and to highlight all the nearby amenities. To that end, the 12-story, 500+ room Hilton was completed across the street in 2012. The $140 million structure was built with public dollars, as a private developer did not step forward when the idea was put forth. The project was somewhat speculative, as the demand for hotel space in the city was not particularly high enough to warrant the construction (a good reason why private development hadn’t shown up), but because the city understood that hotel space was part of the key to attract bigger and better convention events, the hotel went up and Hilton came in to run the space.

The gamble seemed to be paying off, and in January, the Columbus Dispatch came out with an article about the hotel’s success. In the article, there was even the mention of adding even more hotel space, possibly up to 1,000 additional rooms, at some point in the near future.

So when the convention center authority announced it was searching for ideas for a new expansion project, that reality seemed to be taking place. In late March, there was this bit of news. Four separate proposals had been submitted by private developers on ideas to develop the north end of the convention center, along with the surface parking lot north of Goodale behind the 670 retail cap. The most prominent idea came from Wagenbrenner, with a pair of 15-story, mixed-use towers that would’ve included more than 100 residential units, hotel and event space, and ground-floor retail along High Street, an element the original building severely lacked.

Columbus convention center Wagenbrenner proposal

Wagenbrenner Development’s proposal.

Columbus convention center Wagenbrenner proposal rendering 2

Wagenbrenner Development’s proposal, looking southeast from High and Goodale.

Another proposal from Kaufman was far more modern, but still retained mixed-use elements.

Columbus convention center Kaufman proposal

The Kaufman proposal, looking east on Goodale.

In Wagenbrenner’s case, a hotel chain had already stepped forward interested in running the hotel aspect of the project, and there seemed little doubt that one of the proposals would move forward, based on quotes from the convention center authority and their stated goal for a “big idea” sort of project moving forward. The selection of the design would be announced in a few month’s time.

So what was the result of all that? On June 12th, 2014, an article in the Dispatch came out detailing a renovation and expansion project for the convention center.
The problem was that the article did not mention any mixed-use project whatsoever. Instead, it called for a general total-building renovation and a small 30,000 sf expansion and entranceway into the plaza space at the southeast corner of High and Goodale. Additionally, an 800-space parking garage would be built in the surface lot behind the 670 cap.

Wait, what?? When the article initially came out, there was confusion by many in the development-following community on just what was going on. Part of the confusion stemmed from the fact that the convention center authority had already announced a renovation project just 2 weeks prior to the release of the information on the mixed-use expansion project. That announcement had mentioned only a $30 million renovation, not the much larger one announced on June 12th. There had also been mention previously of the garage project, back in late 2013. In that discussion, the garage was being looked at to get ground-floor retail, especially closer to High, to take advantage of the neighborhood’s high walkability and retail success.

So at first, it was assumed that the garage and renovation project was a separate issue from the larger proposed expansion, but the article on June 12th specifically mentioned the very same land that the proposed mixed-use towers would’ve used. The following day, on June 13th, the Dispatch came out with a second article about the $125 million renovation/expansion project, and in it near the bottom, was this damning paragraph:

Jennison said the expansion of the convention center rules out earlier ideas of adding shops and residences to the north end of the facility, including the possibility of more hotel space. The authority’s board sought proposals for such a project earlier this year before ultimately ruling them out.

Suddenly, the 2-tower project had been swept under the rug and abandoned. Worse, it had been abandoned in favor of new carpets/fresh paint, a glorified 2-story entrance on Goodale, and a 1970s parking garage with no retail at all.

Columbus convention center parking garage

The parking garage proposal on Goodale behind the 670 retail cap, part of the convention authority’s new plan.

To say that there was some disbelief that such a decision had been made is putting it mildly. Across development forums, and even on the Dispatch articles themselves, the negative reaction was swift and universal. How and why had such a promising proposal for the convention center turned into the height of mediocrity? And why had potential fully private or a private/public funded project turned into a 100% publicly funded fiasco? The answer, it seems, is likely staring us in the face: The Hilton Hotel. Though it hasn’t been confirmed either way, there is an element of suspicion against the Hilton for obvious reasons. The Hilton is publicly financed and was publicly built. To have a private company build a competing hotel may have taken away business, and the convention authority was not interested in allowing competition for a public enterprise. There are precious few other logical reasons why the convention authority would actively seek private investment only to toss those proposals out a few months later in favor of a project that had no competing elements to it.

Worse still, the convention authority knows it’s a terrible plan in comparison. On June 15th, yet another article on the project appeared in the Columbus Dispatch.

In it, the idea is pushed forth that the renovation plan will be transformative, and will keep Columbus competitive for convention business. The problem is that it’s neither transformative nor competitive. Granted, the convention center is in need of renovations, as much of the interior is dated. But to spend $125 million on that renovation, combined with a laughably bad expansion/garage rather than actually going with, at the very least, a partially privately-funded project that would’ve actually improved Columbus’ competitiveness along with adding much needed pedestrian access and excitement to the intersection in question… well, it’s insanity. And the 3rd article only suggests that the convention authority is well aware of the overwhelmingly negative reaction to their plan and are attempting to justify it as much as possible. Only there can be no real justification. Bad decisions remain bad decisions. Whether this one was made to prevent competition or is simply an example of being out of touch with a stated goal, the convention center authority has made one of the worst decisions in Columbus development history… and that was after the city allowed Union Station to be demolished. Shame on them.


Columbus Housing Trends


I posted a graph recently showing housing permits for Franklin County to show how construction was trending. Today, I found more long-term data for both the city and county that continue to show some interesting Columbus housing trends. All data comes from the Building Permits Survey.

First, let’s look at just the city of Columbus.
Columbus housing trends total housing units
The chart above goes back through the mid-1990s. The first thing to notice is the housing boom from 1999-2002. Both single-family and multi-family construction was booming. The very good economic conditions, or seemingly good ones, during the 1999-2000 period is probably most responsible for this. What’s most interesting is that the boom seemed to last through at least part of the mild recession experienced in 2001-2002. After that, housing of both types started to decline through the late 2000s. This shows that construction in the city began to decline as early as 2002-2003, before the peak of the general housing boom in the mid-2000s.

Another interesting fact is at the end of the period. Multi-family units have recovered and are back in boom territory. This boom, however, is much different than the one that occurred more than a decade ago, as shown by the below chart.
Columbus housing trends housing unit type
During the 1999-2002 housing boom, multi-family housing averaged 59.3% of all the units constructed. In the current boom, which began in 2012, multi-family housing has averaged 82.1% of all the units constructed. The average difference between the types 1999-2002 was just 18.6 points. In the current boom, the difference is an amazing 64.2 points! In that regard, there really is no comparison between the housing boom a decade ago and the current one. Multi-family construction is in MUCH higher relative demand now than it was at any time in the last 17-18 years, including during the last housing boom.

But what does this tell us about where the housing is actually being constructed? Well, for that, we have to look at the entirety of Franklin County. Is the county also seeing a similar multi-family boom, or has single-family construction recovered there more than in the city?
Columbus housing trends Franklin County units
This chart, in some aspects, is the opposite of the one for the city. While in the city, multi-family units consistently outnumbered single-family, the opposite is true for the county as a whole. This is likely because the county takes into account all the suburban areas, most of which are dominated by single-family housing. In only a few instances did multi-family housing units outnumber single-family before 2010. After 2010, it’s clear that the multi-family boom is hitting the rest of the county and not just Columbus itself. This may actually represent an even greater shift in housing construction.

Here’s the % of total chart for the county.
Columbus housing trends Franklin County housing type
So it’s also clear that the county is seeing most of its construction in recent years be multi-family units.

But this still doesn’t tell us if most of Franklin County’s housing construction is occurring in the city or in the suburbs. The easiest way to tell is to take the city totals and find out the % of total to the overall county.
Columbus housing trends Columbus percent of Franklin County units
Not much can be taken from this chart, however. Columbus encompasses the largest part of Franklin County by far, so it has always included most of the county’s construction. Perhaps a better way to look at it would be to measure the city’s total against the overall metro share, but that’s for another day.


Residential Construction Trends of Columbus in One Graph


We’ve been hearing a lot the last few years about how residential construction has largely turned toward the rental variety, and no more so than in the urban areas. I have tried to document the level of activity in the city in my development page, but it doesn’t quite show what’s going on in the city overall. I did a little research and found some surprising realities that fully support the rental boom. The residential construction trends of Columbus have changed significantly in recent years.

Here is a graph of annual housing construction permits from 2004-2013 broken down by multi-family and single-family types.

The chart above is based on the # of units, not the number of overall projects.

So what do the numbers say? Well, it raises some interesting questions. First, was the amount of single-family home construction on the decline before 2004 given the downward trend from that year through 2005? And was multi-family construction on the rise during the same period? Did the recession merely interrupt a trend that began more than a decade ago and resurfaced strongly in recent years? It’s hard to say for sure as I don’t have information before 2004, but regardless, it is clear that multi-family construction is the preferred residential preference right now by builders. Single-family home construction, however, has remained steady and well below its previous peak of the last decade.

This continued low level of single-family construction has likely contributed to the fact that area sales in that market have been down for several months now due to a lack of inventory. Prices, however, have risen.


Housing Market Update February 2014


housing market update February 2014 Columbus, Ohio

Unfortunately, I have been unable to update this site for about a month, but I am back now and have quite a bit to add. First, I have the numbers for the local Housing Market Update February 2014. Due to changes in the way the numbers were gotten, January’s were not available. I still do them for 21 major areas of Franklin County, however, and here they are. As always, the data is from Columbus Realtors.

Top 10 February 2014 Sales Totals
1. Columbus: 535
2. Grove City: 39
3. Westerville: 36
4. Upper Arlington: 33
5. Dublin: 31
6. Hilliard: 30
7. Reynoldsburg: 29
8. Clintonville: 28
9. Gahanna: 23
10. Downtown: 14

Top 10 February 2014 Sales Increases over February 2013
1. Obetz: +200.0%
2. Westerville: +38.5%
3. Grove City: +14.7%
4. German Village: +10.0%
5. Hilliard: +7.1%
6. Gahanna: +0.0%
7. New Albany: +0.0%
8. Upper Arlington: +0.0%
9. Whitehall: +0.0%
10. Downtown: -6.7%

Top 10 Year-to-Date Sales Through February 2014
1. Columbus: 1,076
2. Dublin: 72
3. Grove City: 65
4. Clintonville: 62
5. Reynoldsburg: 59
6. Westerville: 59
7. Upper Arlington: 55
8. Hilliard: 54
9. Gahanna: 40
10. Canal Winchester: 29

Top 10 Year-to-Date Increases Through February 2014 Over 2013
1. Obetz: +300.0%
2. Pataskala: +20.8%
3. Worthington: +8.0%
4. German Village: +6.7%
5. Reynoldsburg: +3.5%
6. Grove City: +3.2%
7. Westerville: -1.7%
8. Hilliard: -1.8%
9. Clintonville: -6.1%
10. Columbus: -6.8%

Average Sales February 2014
Urban: 60.1
Suburban: 22.9
Urban without Columbus: 12.6

Average % Change February 2014 vs. February 2013
Urban: -1.1%
Suburban: -7.1%
Urban without Columbus: -0.2%

Average YTD Sales Through February 2014
Urban: 120
Suburban: 45.1
Urban without Columbus: 24.4

Average YTD % Change YTD Through February 2014
Urban: +11.8%
Suburban: -9.4%
Urban without Columbus: +13.7%

Top 10 Average Sales Price February 2014
1. New Albany: $641,524
2. Bexley: $460,307
3. Upper Arlington: $378,852
4. Dublin: $334,967
5. Grandview: $318,667
6. Downtown: $302,720
7. German Village: $232,014
8. Worthington: $227,422
9. Westerville: $209,149
10. Hilliard: $199,724

Top 10 Average Sales Price % Change February 2014 vs. February 2013
1. Grandview: +68.6%
2. Pataskala: +47.1%
3. Upper Arlington: +46.5%
4. Bexley: +46.1%
5. Pickerington: +28.6%
6. Westerville: +25.9%
7. Obetz: +25.0%
8. Reynoldsburg: +19.9%
9. Canal Winchester: +17.6%
10. Hilliard: +13.1%

Top 10 Average Sales Prices YTD Through February 2014
1. New Albany: $515,036
2. Bexley: $418,680
3. Upper Arlington: $343,026
4. Dublin: $326,231
5. Downtown: $314,042
6. German Village: $309,343
7. Grandview: $251,136
8. Worthington: $231,133
9. Westerville: $205,636
10. Hilliard: $200,965

Top 10 Average YTD Sales Price % Change Through February 2014 vs. 2013
1. Pataskala: +36.2%
2. Whitehall: +35.5%
3. Bexley: +31.7%
4. Grandview: +26.1%
5. German Village: +22.2%
6. Downtown: +20.0%
7. Pickerington: +18.3%
8. Westerville: +15.8%
9. Canal Winchester: +15.2%
10. Reynoldsburg: +15.1%

Average Sales Price February 2014
Urban: $228,596
Suburban: $235,812
Urban without Columbus: $239,422

Average Sales Price Change February 2014 vs. February 2013
Urban: +15.9%
Suburban: +17.1%
Urban without Columbus: +16.9%

Average Sales Price YTD
Urban: $222,639
Suburban: $220,917
Urban without Columbus: $232,886

Average Sales Price % Change YTD
Urban: +13.0%
Suburban: +13.3%
Urban without Columbus: +13.0%

Top 10 Fastest Selling Markets February 2014 (Based on Average # of Days for Listings to Sell)
1. Grandview: 39
2. Clintonville: 57
3. Obetz: 62
4. Worthington: 70
5. Pataskala: 74
6. Hilliard: 78
7. Upper Arlington: 83
8. Westerville: 88
9. Pickerington: 89
10. Columbus: 91

Top 10 Fastest Selling Markets YTD
1. Worthington: 50
2. Grandview: 58
3. Pickerington: 60
4. Clintonville: 64
5. Obetz: 64
6. Hilliard: 66
7. Whitehall: 66
8. Upper Arlington: 73
9. Gahanna: 85
10. Westerville: 87

Average # of Days Before Sale, February 2014
Urban: 86.2
Suburban: 104.4
Urban without Columbus: 85.7

Average # of Days Before Sale YTD
Urban: 81.1
Suburban: 89.1
Urban without Columbus: 80.4

Top 10 Lowest Market Housing Supplies (Based on # of Months to Sell all Listings)
1. Worthington: 1.0
2. Hilliard: 1.6
3. Upper Arlington: 1.7
4. Westerville: 1.7
5. Clintonville: 1.8
6. Gahanna: 1.9
7. German Village: 1.9
8. Grandview: 2.0
9. Obetz: 2.2
10. Bexley and Dublin: 2.4

A healthy housing supply is considered to be around 5 months. Anything less than 3 months is considered very low.

Average # of Months to Sell All Listings, February 2014
Urban: 2.3
Suburban: 2.9
Urban without Columbus: 2.3

Average % Change of Single-Family Home Sales February 2014 vs. February 2013
Urban: +15.0%
Suburban: -7.7%
Urban without Columbus: +17.0%

Average % Change of Single-Family Home Sales YTD vs. YTD 2013
Urban: +3.0%
Suburban: -10.3%
Urban without Columbus: +4.0%

Average % Change of Condo Sales February 2014 vs. February 2013
Urban: -21.0%
Suburban: +7.0%
Urban without Columbus: -21.8%

Average % Change of Condo Sales YTD vs. YTD 2013
Urban: +20.6%
Suburban: +23.7%
Urban without Columbus: +23.0%