Here’s a great video of High Street with a Short North drone flyove from 2018. It gives a fantastic view of all the new development built in the last decade along High Street between the Short North and Campus.
To see historic photos of how the Short North used to look, visit the Short North Historic Buildings page to see all sorts of before and after historic photos of the neighborhood.
And for more videos around Columbus through history, the Columbus Videos Through Time contains more than 50 different Columbus-specific videos on a wide-rage of topics.
In the ongoing series discussing topics related to the 2018 Census demographic estimates, today I will update the foreign-born comparison. Beyond the simple comparison, I will also talk about the regions and countries that the foreign-born populations come from.
Total Foreign-Born Population Rank by City 2010 and 2018 2010————————————-——-2018 1. Chicago: 557,674—————1. Chicago: 540,738 2. San Jose: 366,194————-2. San Jose: 407,839 3. Austin: 148,431—————-3. Austin: 180,544 4. Las Vegas: 130,503———–4. Las Vegas: 133,033 5. Sacramento: 96,105———-5. Columbus: 125,339 6. Columbus: 86,663————-6. Sacramento: 114,786 7. Portland: 83,026—————7. Jacksonville: 111,798 8. Jacksonville: 77,145——–8. Nashville: 95,040 9. Indianapolis: 74,707——–9. Portland: 90,728 10. Nashville: 73,327———-10. Indianapolis: 81,764 11. Minneapolis: 57,846——11. Minneapolis: 68,131 12. Milwaukee: 57,222——–12. St. Paul: 59,381 13. Providence: 52,920——-13. Milwaukee: 57,647 14. St. Paul: 50,366———–14. Omaha: 50,279 15. Virginia Beach: 40,756—15. Providence ;46,995 16. Omaha: 39,288————16. Detroit: 44,520 17. Wichita: 39,128————17. Kansas City: 43,485 18. Kansas City: 35,532——18. Virginia Beach: 43,385 19. Detroit: 34,307————19. Wichita: 42,171 20. Madison: 24,929———20. Madison: 32,622 21. St. Louis: 23,011———-21. Des Moines: 31,013 22. Lincoln: 22,214———–22. Pittsburgh: 26,569 23. Des Moines: 20,798—–23. Lincoln: 23,309 24. Pittsburgh: 18,698——24. Fort Wayne: 22,489 25. Cleveland: 17,739——-25. Cleveland: 21,838 26. Grand Rapids: 16,615—26. St. Louis: 21,538 27. Cincinnati: 16,531——-27. Cincinnati: 20,592 28. Fort Wayne: 15,286—-28. Grand Rapids: 20,032 29. Toledo: 11,159———–29. Akron: 13,649 30. Akron: 8,524————30. Toledo: 9,038 31. Dayton: 5,102———–31. Dayton: 7,311 32. Youngstown: 3,695—-32. Canton: 3,241 33. Canton: 1,343———–33: Youngstown: 976
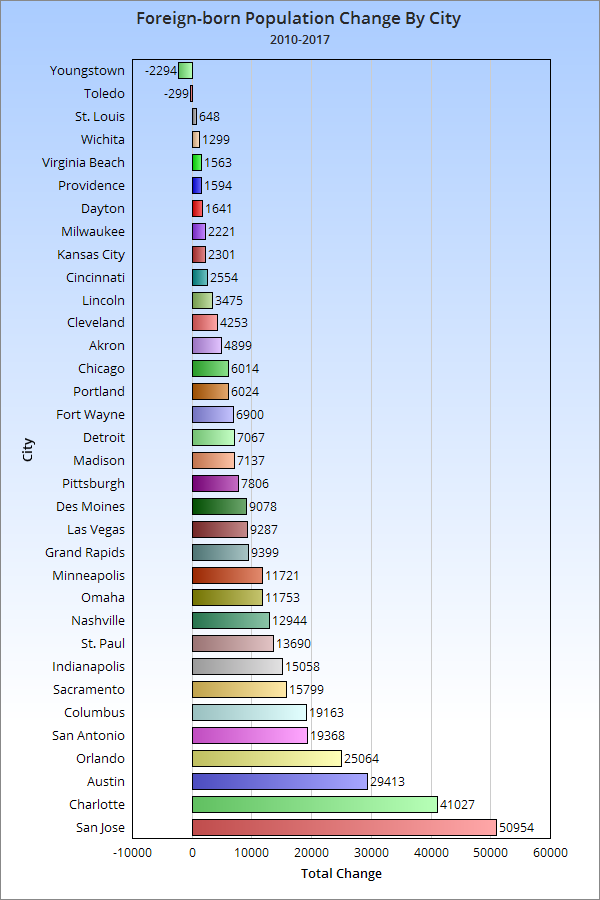
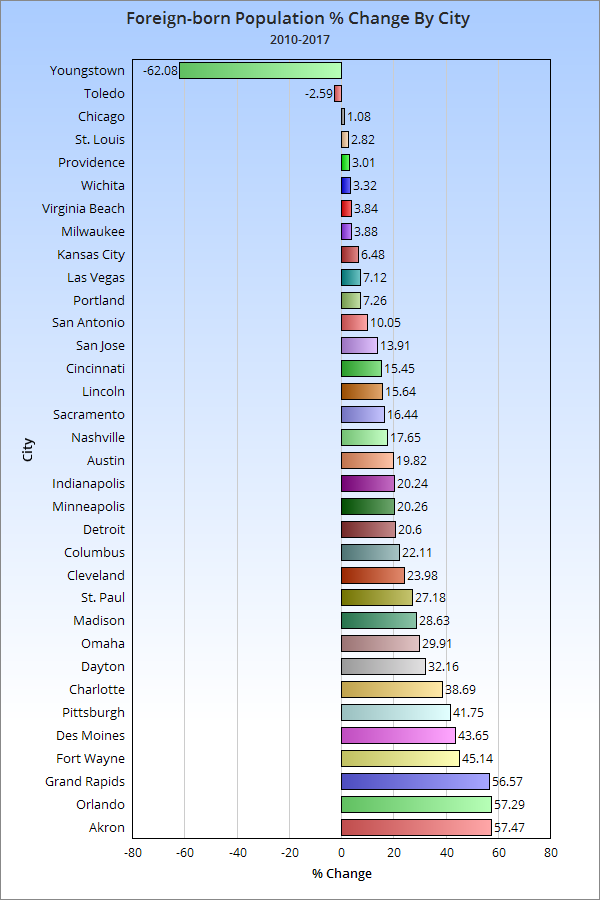
Here’s the 2010-2018 total change. And the 2010-2018 change by %.
Columbus has done very well in both total and % growth of its foreign-born population since 2010.
So now that we know how many foreign-born immigrants are arriving and how fast, let’s take a look at where they are coming from.
Total Foreign-Born Residents From Europe in 2000 and 2018 2000———————————————–2018 1. Chicago: 145,462———————1. Chicago: 91,397 2. San Jose: 21,904———————2. San Jose: 22,043 3. Portland: 17,572———————-3. Jacksonville: 18,808 4. Jacksonville: 10,883————4. Portland: 17,016 5. Las Vegas: 9,070—————-5. Austin: 11,981 6. Cleveland: 8,796—————-6. Las Vegas: 11,472 7. St. Louis: 8,543——————7. Columbus: 8,141 8. Sacramento: 8,204————-8. Nashville: 8,108 9. Milwaukee: 7,841—————9. Virginia Beach: 6,710 10. Austin: 7,474——————10. Sacramento: 6,275 11. Pittsburgh: 7,413————–11. Pittsburgh: 5,047 12. Columbus: 7,017————–12. Minneapolis: 5,031 13. Indianapolis: 6,543———–13. Omaha: 3,845 14. Virginia Beach: 6,333——–14. St. Louis: 4,711 15. Detroit: 5,600—————–15. Indianapolis: 4,199 16. Minneapolis: 5,409———–16. Omaha: 3,845 17. Providence: 5,126————-17. Milwaukee: 3,808 18. Nashville: 4,859—————18. Madison: 3,519 19. Cincinnati: 3,851————–19. Providence: 3,030 20. Grand Rapids: 3,396———20. Lincoln: 2,777 21. Omaha: 3,320—————–21. Cincinnati: 2,738 22. St. Paul: 3,255—————-22. St. Paul: 2,449 23. Des Moines: 3,216———–23. Grand Rapids: 2,336 24. Kansas City: 2,985———-24. Kansas City: 2,320 25. Madison: 2,871—————25. Fort Wayne: 2,235 26. Lincoln: 2,701—————-26. Wichita: 1,851 27. Akron: 2,687—————–27. Detroit: 1,767 28. Fort Wayne: 2076———–28. Akron: 1,580 29. Toledo: 2,020—————-29. Des Moines: 1,042 30. Wichita: 2,004————–30. Toledo: 496 31. Dayton: 901——————31. Canton: 347 32. Youngstown: 870———–32. Dayton: 347 33. Canton: 590—————–33. Youngstown: 337
Columbus had more European immigrants than most in 2000 and 2018, and was one of the relatively few cities that saw an increase by 2018.
Total Foreign-born Population from Asia 2000 and 2018 2000————————————————–2018 1. San Jose: 182,712—————————1. San Jose: 256,504 2. Chicago: 112,932—————————2. Chicago: 144,970 3. Sacramento: 40,253———————3. Austin: 59,711 4. Portland: 26,271—————————4. Sacramento: 56,084 5. Austin: 25,036——————————5. Columbus: 49,185 6. St. Paul: 23,245———————-6. Portland: 42,245 7. Columbus: 22,354——————-7. Jacksonville: 39,543 8. Jacksonville: 17,427—————–8. Las Vegas: 35,959 9. Minneapolis: 17,376—————–9. St. Paul: 34,246 10. Las Vegas: 17,062—————–10. Nashville: 28,142 11. Virginia Beach: 15,176————-11. Indianapolis: 24,992 12. Detroit: 15,114———————-12. Virginia Beach: 21,954 13. Nashville: 12,573——————-13. Milwaukee: 18,192 14. Milwaukee: 12,114——————14. Minneapolis: 17,929 15. Wichita: 10,826——————–15. Detroit: 17,474 16. Madison: 9,736——————–16. Madison: 17,021 17. Indianapolis: 9,190—————-17. Omaha: 14,582 18. Pittsburgh: 7,938—————–18. Wichita: 14,107 19. Providence: 7,871—————–19. Kansas City: 13,753 20. Kansas City: 7,312—————-20. Des Moines: 13,139 21. Lincoln: 6,691———————-21. Pittsburgh: 12,929 22. St. Louis: 6,425——————–22. Lincoln: 11,233 23. Omaha: 6,302 ———————23. Fort Wayne: 10,809 24. Cleveland: 6,213——————-24. Cleveland: 10,351 25. Des Moines: 5,239—————-25. St. Louis: 9,505 26. Cincinnati: 4,326——————26. Akron: 8,391 27. Toledo: 3,847———————-27. Providence: 7,744 28. Grand Rapids: 3,206————–28. Cincinnati: 5,599 29. Akron: 3,099———————–29. Toledo: 3,597 30. Fort Wayne: 2,792—————–30. Grand Rapids: 3,369 31. Dayton: 903————————-31. Dayton: 2,575 32. Youngstown: 338——————32. Canton: 542 33. Canton: 296————————33. Youngstown: 196
Columbus ranks even higher with its foreign-born Asian population.
Total Foreign-born Population from Africa 2000 and 2018 2000—————————————————2018 1. Minneapolis: 12,765——————–1. Columbus: 45,092 2. Chicago: 12,613————————-2. Minneapolis: 26,271 3. Columbus: 9,530———————–3. Chicago: 25,573 4. San Jose: 5,189————————-4. Nashville: 18,423 5. St. Paul: 4,697———————5. Indianapolis: 14,965 6. Nashville: 4,183——————-6. St. Paul: 13,594 7. Detroit:: 3,249———————7. Austin: 9,961 8. Providence: 3,138—————-8. Kansas City: 8,558 9. Indianapolis: 2,650—————9. San Jose: 8,546 10. Portland: 2,430—————–10. Cincinnati: 7,113 11. Austin 2,263———————11. Des Moines: 6,191 12. Kansas City: 2,192————–12. Omaha: 5,474 13. Cincinnati: 1,781—————-13. Grand Rapids: 3,932 14. Jacksonville: 1,719————-14. Portland: 3,899 15. St. Louis: 1,500—————–15. St. Louis: 3,777 16. Omaha: 1,497——————-16. Providence: 3,571 17. Milwaukee: 1,332—————17. Milwaukee: 3,552 18. Cleveland: 1,075—————-18. Jacksonville: 3,426 19. Sacramento: 1,051————-19. Lincoln: 2,942 20. Des Moines: 1,038————-20. Wichita: 2,752 21. Madison: 991——————–21. Madison: 2,599 22. Wichita: 946——————–22. Detroit: 2,081 23. Las Vegas: 916—————–23. Pittsburgh: 1,909 24. Pittsburgh: 905—————-24. Sacramento: 1,784 25. Virginia Beach: 840———–25. Virginia Beach: 1,783 26. Grand Rapids: 718————-26. Fort Wayne: 1,614 27. Toledo: 638——————–27. Dayton: 1,573 28. Lincoln: 637——————–28. Akron: 1,312 29. Dayton: 522——————–29. Las Vegas: 1,206 30. Fort Wayne: 384————–30. Cleveland: 622 31. Akron: 197———————-31. Toledo: 416 32. Canton: 89———————32. Youngstown: 277 33. Youngstown: 50—————33. Canton: 95
Columbus has claimed the number 1 spot in its foreign-born African population, passing previous top city Minneapolis.
And finally, the total foreign-born population from the Americas in 2000 and 2018 2000—————————————————-2018 1. Chicago: 357,235————————–1. Chicago: 277,742 2. San Jose: 117,989————————2. San Jose: 119,455 3. Austin: 73,935———————-3. Austin: 97,933 4. Las Vegas: 63,277——————4. Las Vegas: 83,782 5. Sacramento: 28,927—————5. Jacksonville: 49,339 6. Providence: 27,649—————-6. Sacramento: 42,722 7. Milwaukee: 24,781——————7. Nashville: 39,633 8. Detroit: 21,527———————-8. Indianapolis: 37,287 9. Portland: 20,939——————-9. Providence: 32,650 10. Minneapolis: 19,648————-10. Milwaukee: 31,917 11. Indianapolis: 17,530————–11. Omaha: 26,012 12. Nashville: 17,125——————12. Wichita: 23,429 13. Omaha: 14,467——————–13. Detroit: 23,198 14. Wichita:: 13,988——————14. Columbus: 22,469 15. Grand Rapids: 13,477————15. Portland: 20,407 16. Kansas City: 12,948————–16. Minneapolis: 18,765 17. Jacksonville: 11,881—————17. Kansas City: 18,170 18. St.Paul: 9,804———————18. Virginia Beach: 12,667 19. Columbus: 8,596—————–19. Des Moines: 10,675 20. Des Moines: 6,201—————20. Grand Rapids: 10,395 21. Virginia Beach: 5,754————21. Madison: 9,349 22. Cleveland: 5,192—————–22. St. Paul: 9,070 23. Madison: 5,080——————23. Fort Wayne: 7,831 24. Fort Wayne: 4,930————–24. Lincoln: 6,280 25. Lincoln: 3,106——————–25. Pittsburgh: 5,898 26. St. Louis: 2,961——————-26. Cleveland: 5,810 27. Toledo: 2,942———————27. Cincinnati: 4,901 28. Pittsburgh: 2,463—————-28. Toledo: 4,347 29. Cincinnati: 2,432—————–29. St. Louis: 3,545 30. Dayton: 919———————-30. Dayton: 2,816 31. Akron: 891————————31. Akron: 2,366 32. Canton: 347———————-32. Canton: 2,257 33. Youngstown: 333—————33. Youngstown: 166
Columbus does the worst with this group, but even here it moved up 5 spots in the rankings.
The rest of the foreign-born population is made up of small groups of people from Oceania- or basically island nations.
Columbus has been receiving a lot of great national press in recent years, and that continued when CNN called the city a top Memorial Day weekend destination. The recent opening of the National Veterans Memorial, the first of its kind in the country, seemed to play a prominent role in the decision.
The National Veterans Memorial on the Scioto Peninsula, completed in 2018.
Given that the 2017 demographic information was released yesterday by the US Census, it’s time to revisit this Columbus foreign-born population comparison and update it with the new data.
First up, let’s take a look at total foreign-born populations. I have looked at this topic some in the past, but I have never done a full-scale comparison for this topic.
Total Foreign-Born Population Rank by City 2000, 2010 and 2017 2000—————————————-2010———————————-2017 1. Chicago, IL: 628,903———–1. Chicago: 557,674—————1. Chicago: 563,688 2. San Jose, CA: 329,750——–2. San Jose: 366,194————-2. San Jose: 417,148 3. San Antonio, TX: 133,675—-3. San Antonio: 192,741———-3. San Antonio: 212,109 4. Austin, TX: 109,006————4. Austin: 148,431——————4. Austin: 177,844 5. Las Vegas, NV: 90,656——-5. Las Vegas: 130,503————-5. Charlotte: 147,074 6. Sacramento, CA: 82,616—–6. Chalotte: 106,047—————6. Las Vegas: 139,790 7. Portland, OR: 68,976———7. Sacramento: 96,105————-7. Sacramento: 111,904 8. Charlotte, NC: 59,849——–8. Columbus: 86,663—————-8. Columbus: 105,826 9. Minneapolis, MN: 55,475—–9. Portland: 83,026—————–9. Indianapolis: 89,465 10. Columbus: 47,713———–10. Indianapolis: 74,407———–10. Portland: 89,050 11. Milwaukee, WI: 46,122—–11. Nashville: 73,327—————11. Nashville: 86,271 12. Detroit, MI: 45,541———–12. Minneapolis: 57,846———–12. Minneapolis: 69,567 13. Providence, RI: 43,947—–13. Milwaukee: 57,222————-13. Orlando: 68,811 14. St. Paul, MN: 41,138——-14. Providence: 52,920————14. St. Paul: 64,056 15. Nashville, TN: 38,936——-15. St. Paul: 50,366—————-15. Milwaukee: 59,443 16. Indianapolis, IN: 36,067—-16. Orlando: 43,747—————-16. Providence: 54,520 17. Virginia Beach, VA: 28,276–17. Virginia Beach: 40,756—–17. Omaha: 51,041 18. Wichita, KS: 27,938———18. Omaha: 39,288—————18. Virginia Beach: 42,319 19. Orlando, FL: 26,741——–19. Wichita: 39,128—————–19. Detroit: 41,374 20. Omaha, NE: 25,687———-20. Kansas City: 35,532———20. Wichita: 40,427 21. Kansas City, MO: 25,632—21. Detroit: 34,307—————-21. Kansas City: 37,833 22. Cleveland: 21,372————22. Madison: 24,929————–22. Madison: 32,066 23. Grand Rapids, MI: 20,814—23. St. Louis: 23,011————23. Des Moines: 29,876 24. St Louis, MO: 19,542——–24. Lincoln: 22,214—————24. Pittsburgh:26,504 25. Pittsburgh, PA: 18,874——-25. Des Moines: 20,798——–25. Grand Rapids: 26,014 26. Madison, WI: 18,792———26. Pittsburgh: 18,698———–26. Lincoln: 25,689 27. Des Moines, IA: 15,713—–27. Cleveland: 17,739————27. St. Louis: 23,659 28. Lincoln, NE: 13,246———-28. Grand Rapids: 16,615——-28. Fort Wayne: 22,186 29. Cincinnati: 12,461————29. Cincinnati: 16,531————29. Cleveland: 21,992 30. Fort Wayne, IN: 10,187—–30. Fort Wayne: 15,286———30. Cincinnati: 19,085 31. Toledo: 9,475——————31. Toledo: 11,159—————31. Akron: 13,423 32. Akron: 6,911——————-32. Akron: 8,524——————-32. Toledo: 11,260 33. Dayton: 3,245—————–33. Dayton: 5,102——————33. Dayton: 6,743 34. Youngstown: 1,605———-34. Youngstown: 3,695———–34. Youngstown: 1,401
Here’s the 2000-2017 total change. And the 2000-2017 change by %.
So Columbus has had above average total and % growth compared to its peers nationally since 2000. What about more recently?
Total change 2010-2017. And the 2010-2017 change by %. So now that we know how many foreign-born immigrants are arriving, let’s take a look at where they are coming from.
Total Foreign-Born Residents From Europe in 2000 and 2017 2000———————————————–2017 1. Chicago: 145,462———————1. Chicago: 96,656 2. San Jose: 21,904———————2. San Jose: 25,147 3. Portland: 17,572———————-3. Portland: 16,548 4. Las Vegas: 9,070———————4. Austin: 13,337 5. Cleveland: 8,796———————-5. Charlotte: 9,775 6. St. Louis: 8,543———————–6. Las Vegas: 8,536 7. San Antonio: 8,323——————7. San Antonio: 7,852 8. Sacramento: 8,204——————8. Virginia Beach: 7,368 9. Milwaukee: 7,841——————–9. Columbus: 6,860 10. Charlotte: 7,487——————–10. Indianapolis: 6,344 11. Austin: 7,474————————11. Sacramento: 6,008 12. Pittsburgh: 7,413——————-12. Nashville: 5,778 13. Columbus: 7,017——————-13. Orlando: 5,516 14. Indianapolis: 6,543—————-14. Minneapolis: 5,477 15. Virginia Beach: 6,333————-15. Milwaukee: 4,388 16. Detroit: 5,600————————16. Pittsburgh: 4,265 17. Minneapolis: 5,409—————–17. Providence: 4,022 18. Providence: 5,126——————18. Lincoln: 3,908 19. Nashville: 4,859——————–19. St. Louis: 3,680 20. Cincinnati: 3,851——————-20. Cincinnati: 3,556 21. Grand Rapids: 3,396————–21. Omaha: 3,483 22. Omaha: 3,320———————–22. Cleveland: 3,399 23. St. Paul: 3,255———————-23. Kansas City: 3,362 24. Des Moines: 3,216—————-24. Madison: 2,867 25. Kansas City: 2,985—————-25. St. Paul: 2,394 26. Madison: 2,871——————–26. Detroit: 2,393 27. Lincoln: 2,701———————-27. Fort Wayne: 2,388 28. Akron: 2,687———————–28. Des Moines: 2,156 29. Orlando: 2,509——————–29. Wichita: 1,660 30. Fort Wayne: 2,076—————30. Grand Rapids: 1,517 31. Toledo: 2,020———————31. Akron: 1,286 32. Wichita: 2,004———————32. Toledo: 1,242 33. Dayton: 901———————–33. Dayton: 877 34. Youngstown: 870—————-34. Youngstown: 173
Columbus had a high number of Europeans versus most peers, but almost all cities saw drops in this demographic between 2000 and 2017, some quite drastic. Columbus’ drop was relatively minor.
Total Foreign-born Population from Asia 2000 and 2017 2000————————————————–2017 1. San Jose: 182,712—————————1. San Jose: 262,208 2. Chicago: 112,932—————————-2. Chicago: 140,434 3. Sacramento: 40,253————————-3. Austin: 57,584 4. Portland: 26,271——————————4. Sacramento: 53,731 5. Austin: 25,036——————————–5. Charlotte: 46,698 6. St. Paul: 23,245——————————6. Columbus: 43,706 7. Columbus: 22,354—————————7. San Antonio: 40,642 8. Minneapolis: 17,376————————8. Portland: 38,224 9. Las Vegas: 17,062————————–9. Las Vegas: 35,087 10. San Antonio: 15,840———————-10. St. Paul: 34,678 11. Charlotte: 15,734————————–11. Nashville: 26,155 12. Virginia Beach: 15,176——————-12. Indianapolis: 23,934 13. Detroit: 15,114——————————13. Virginia Beach: 23,625 14. Nashville: 12,573—————————14. Madison: 18,795 15. Milwaukee: 12,114————————-15. Detroit: 18,681 16. Wichita: 10,826—————————–16. Milwaukee: 17,838 17. Madison: 9,736—————————–17. Minneapolis: 15,967 18. Indianapolis: 9,190————————-18. Pittsburgh: 15,873 19. Pittsburgh: 7,938—————————-19. Wichita: 15,466 20. Providence: 7,871————————–20. Omaha: 14,504 21. Kansas City: 7,312————————-21. Lincoln: 13,804 22. Lincoln: 6,691——————————-22. Kansas City: 12,043 23. St. Louis: 6,425—————————–23. Fort Wayne: 10,972 24. Omaha: 6,302——————————-24. Des Moines: 10,691 25. Cleveland: 6,213—————————25. St. Louis: 9,632 26. Des Moines: 5,239————————26. Orlando: 8,122 27. Orlando: 4,530—————————–27. Akron: 7,862 28. Cincinnati: 4,326————————–28. Cleveland: 7,450 29. Toledo: 3,847——————————29. Providence: 6,668 30. Grand Rapids: 3,206———————30. Grand Rapids: 6,585 31. Akron: 3,099——————————-31. Toledo: 6,196 32. Fort Wayne: 2,792————————32. Cincinnati: 6,002 33. Dayton: 903———————————33. Dayton: 1,614 34. Youngstown: 338————————–34. Youngstown: 448
Columbus ranks even higher with its foreign-born Asian population.
Total Foreign-born Population from Africa 2000 and 2017 2000—————————————————2017 1. Minneapolis: 12,765——————–1. Columbus: 33,607 2. Chicago: 12,613————————-2. Chicago: 26,995 3. Columbus: 9,530————————3. Minneapolis: 25,286 4. San Jose: 5,189————————-4. Nashville: 18,387 5. Charlotte: 4,722————————–5. Charlotte: 18,234 6. St. Paul: 4,697—————————-6. Indianapolis: 17,452 7. Nashville: 4,183————————–7. St. Paul: 15,926 8. Detroit: 3,249—————————–8. Omaha: 7,496 9. Providence: 3,138———————–9. San Jose: 7,400 10. Indianapolis: 2,650——————–10. Portland: 7,059 11. Portland: 2,430————————-11. Austin: 6,469 12. Austin: 2,263—————————-12. Des Moines: 6,124 13. Kansas City: 2,192——————–13. San Antonio: 5,718 14. Cincinnati: 1,781———————–14. Kansas City: 5,051 15. St. Louis: 1,500————————-15. St. Louis: 4,977 16. Omaha: 1,497—————————16. Providence: 4,697 17. San Antonio: 1,358——————–17. Milwaukee: 4,423 18. Milwaukee: 1,332———————-18. Cincinnati: 4,207 19. Cleveland: 1,075———————–19. Grand Rapids: 3,754 20. Sacramento: 1,051——————–20. Sacramento: 2,955 21. Des Moines: 1,038——————–21. Pittsburgh: 2,731 22. Madison: 991—————————22. Cleveland: 2,728 23. Orlando: 983—————————23. Orlando: 2,552 24. Wichita: 946—————————-24. Akron: 2,311 25. Las Vegas: 916———————–25. Madison: 2,180 26. Pittsburgh: 905————————26. Wichita: 2,142 27. Virginia Beach: 840——————27. Las Vegas: 1,846 28. Grand Rapids: 718——————-28. Lincoln: 1,680 29. Toledo: 638—————————-29. Dayton: 1,397 30. Lincoln: 637—————————30. Detroit: 1,082 31. Dayton: 522—————————-31. Virginia Beach: 847 32. Fort Wayne: 384———————-32. Fort Wayne: 628 33. Akron: 197—————————–33. Toledo: 615 34. Youngstown: 50———————-34. Youngstown: 0
Columbus has claimed the number 1 spot in its foreign-born African population, passing previous top city Minneapolis.
And finally, the total foreign-born population from the Americas in 2000 and 2017 2000—————————————————-2017 1. Chicago: 357,235————————–1. Chicago: 297,926 2. San Jose: 117,989————————2. San Antonio: 157,629 3. San Antonio: 107,906——————–3. San Jose: 120,657 4. Austin: 73,935——————————4. Austin: 99,482 5. Las Vegas: 63,277————————5. Las Vegas: 93,693 6. Charlotte: 31,625————————–6. Charlotte: 72,211 7. Sacramento: 28,927———————-7. Orlando: 52,421 8. Providence: 27,649———————–8. Sacramento: 42,632 9. Milwaukee: 24,781————————9. Indianapolis: 41,554 10. Detroit: 21,527—————————10. Providence: 39,093 11. Portland: 20,939————————-11. Nashville: 35,719 12. Minneapolis: 19,648——————–12. Milwaukee: 32,630 13. Orlando: 18,639————————-13. Portland: 25,417 14. Indianapolis: 17,530——————–14. Omaha: 25,385 15. Nashville: 17,125————————15. Minneapolis: 22,688 16. Omaha: 14,467————————–16. Columbus: 21,578 17. Wichita: 13,988—————————17. Wichita: 20,983 18. Grand Rapids: 13,477——————18. Detroit: 19,143 19. Kansas City: 12,948———————19. Kansas City: 17,377 20. St. Paul: 9,804—————————-20. Grand Rapids: 14,158 21. Columbus: 8,596————————21. St. Paul: 10,878 22. Des Moines: 6,201———————-22. Des Moines: 10,627 23. Virginia Beach: 5,754——————23. Virginia Beach: 10,415 24. Cleveland: 5,192————————24. Cleveland: 8,386 25. Madison: 5,080————————–25. Fort Wayne: 8,198 26. Fort Wayne: 4,930———————-26. Madison: 8,031 27. Lincoln: 3,106—————————-27. Lincoln: 6,190 28. St. Louis: 2,961————————–28. Cincinnati: 5,320 29. Toledo: 2,942—————————-29. St. Louis: 5,008 30. Pittsburgh: 2,463————————30. Pittsburgh: 3,443 31. Cincinnati: 2,432————————31. Toledo: 3,207 32. Dayton: 919——————————32. Dayton: 2,855 33. Akron: 891——————————-33. Akron: 1,699 34. Youngstown: 333———————–34. Youngstown: 780
Columbus does the worst with this group, but even here it moved up 5 spots in the rankings.
The rest of the foreign-born population is made up of small groups of people from Oceania- or basically island nations.
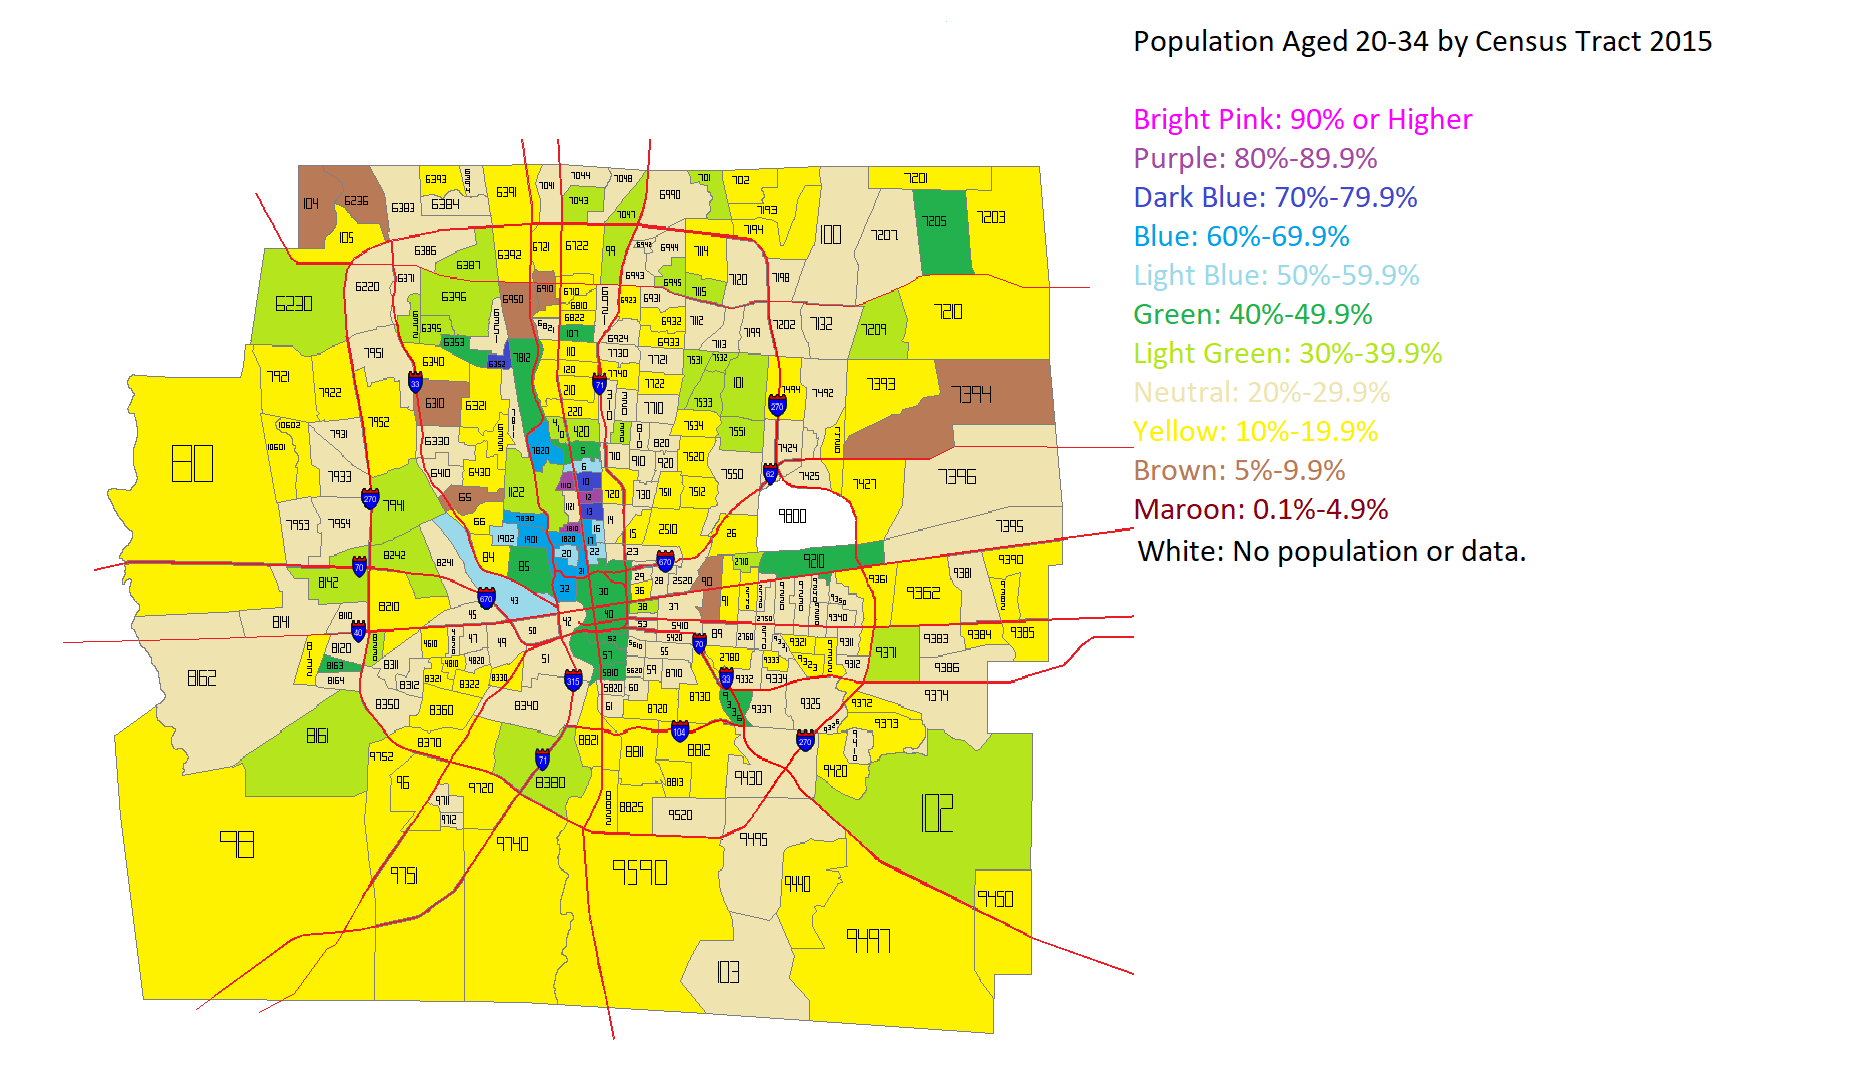
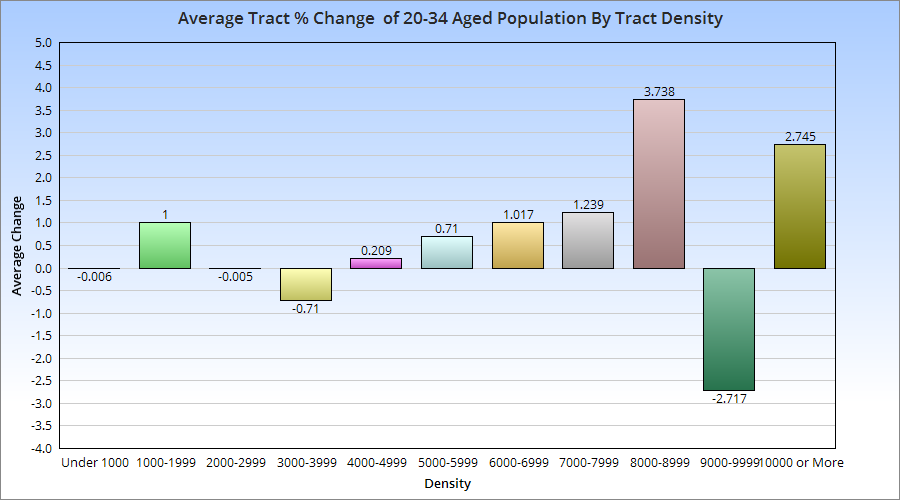
I’ve seen several articles across the internet lately questioning the idea that Millennials and young adults prefer density and urban areas. I decided to see how this played out in Franklin County overall. I first looked at the total population aged 20-34 in the year 2000 and the year 2015 by Census Tract. Here were the maps for those years.
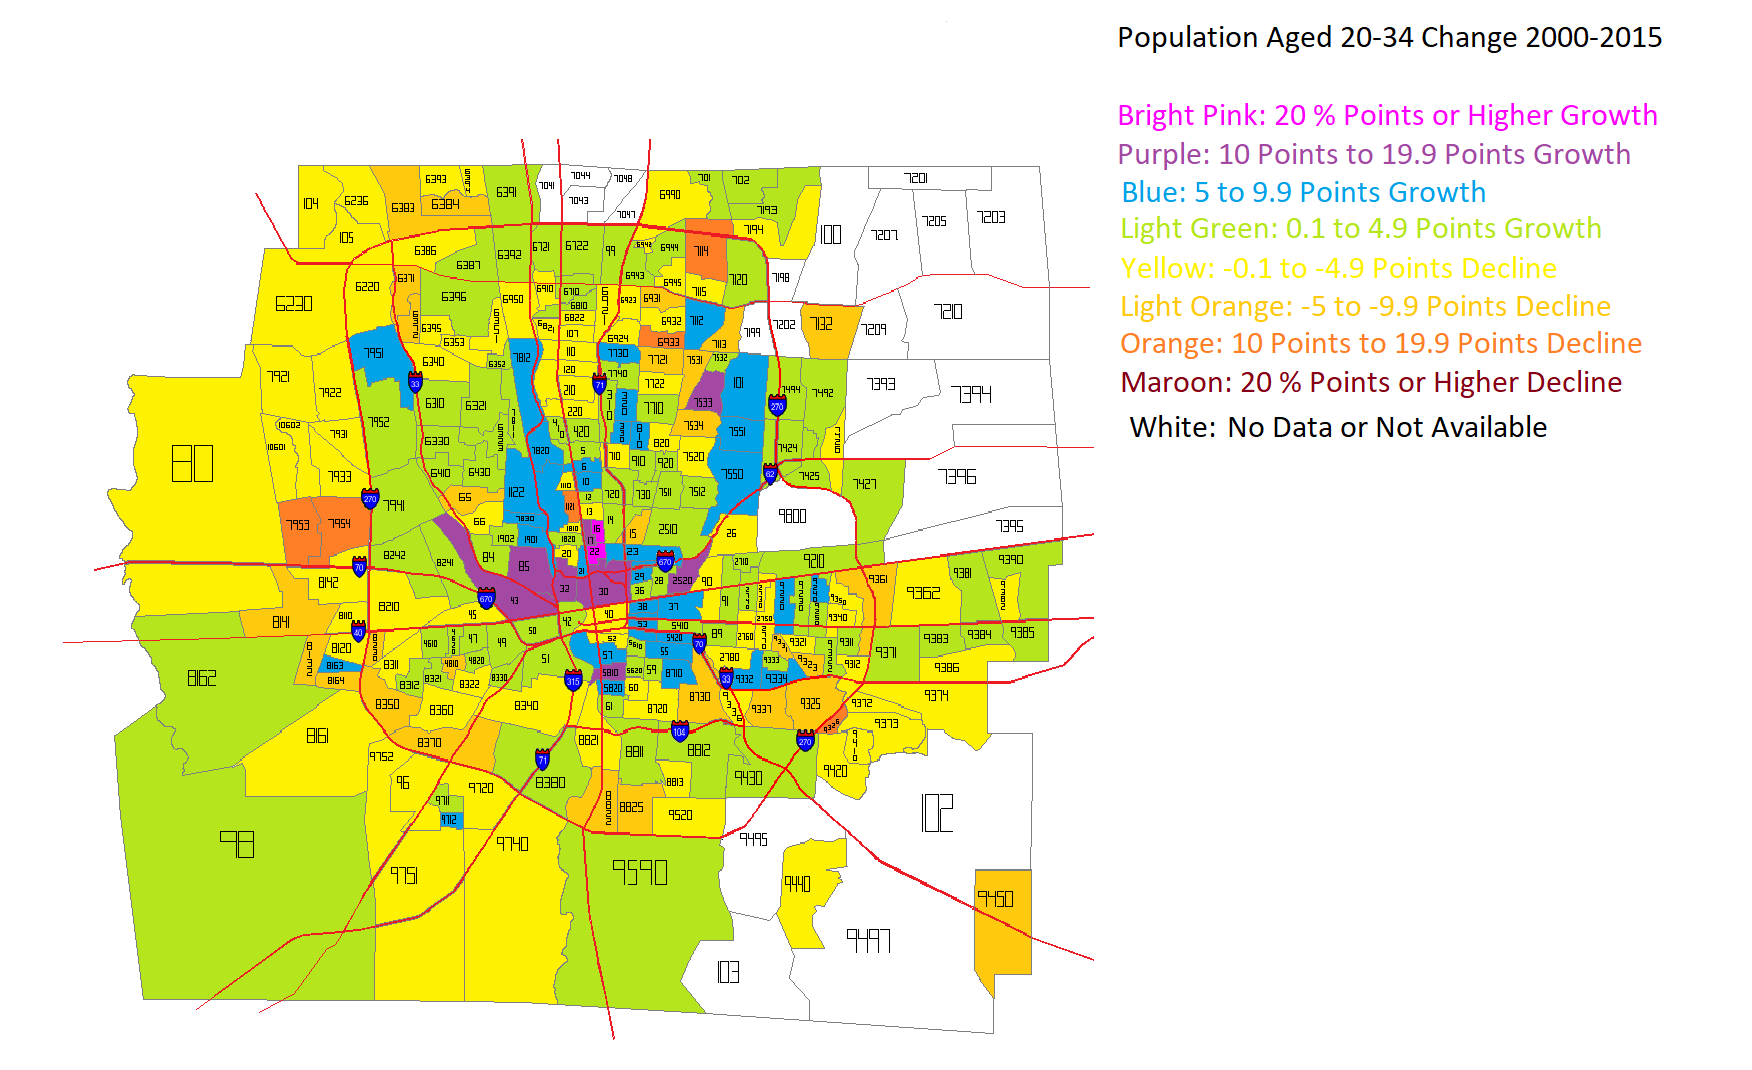
After looking at the numbers for both years, I came up with this map for how that age group had changed in the 2000-2015 period.
Unfortunately, some tracts, particularly in the eastern suburban areas, did not exist in 2000, and so I was not able to figure out the change for them during the period. The rest of the map, however, shows that the strongest growth in this age group was not only inside 270, but closest to Downtown and central corridors along Broad and High Streets. These maps don’t tell us about the relationship between those changes and the population density of the census tracts. So I went further and broke the tracts into increments of density to see where the strongest growth was occurring.
With a few exceptions, there appears to be a correlation between average 20-34 aged population growth and the density of the census tracts it occurs in. This suggests that this age group, at least in Franklin County, prefers areas with moderate to high density, which typically translates to urban living.