Second is this: http://www.bizjournals.com/columbus/news/2013/01/15/columbus-only-midwest-city-to-regain.html This link shows that the Columbus metro is one of only 14 major metros nationally (out of 102) that had gained more jobs through November 2012 than it lost during the Great Recession, meaning it has exceeded a 100% recovery from the downturn. It was also the only Midwestern metro to have achieved this feat.
Stories and rankings like this prove that Columbus has little or nothing in common with its nearby Rust Belt neighbors. It has long had a steady, growing economy that has been able to recover quickly from economic downturns. Say what you will about weather or other factors, but the #1 reason for people to move somewhere has to do with economics. So long as there are jobs available and a decent cost of living, people should continue to flock to that place. In that regard, Columbus definitely seems to have a bright future.
In this edition of Columbus retail history, we will talk about how the markets of the city were once a vibrant and important part of daily life. As in most cities, shopping in Columbus prior to 1950 was almost exclusively a function of Downtown. This was for the simple reason that widespread suburbs did not exist yet and Downtown was the heart of the city, where almost everyone lived and worked, and therefore did all of their shopping there as well. Most of this shopping occurred in family owned shops and small marketplaces, but as the city grew, the need for larger centers of commerce began to rise. Beginning in 1849 and continuing through early 1850, Central Market was built at S. 4th and E. Town Streets. Opening on June 1, 1850, Central Market was designed to be an economic center for the city, but also served as City Hall from May 1851 until 3/28/1872 when the new City Hall opened.
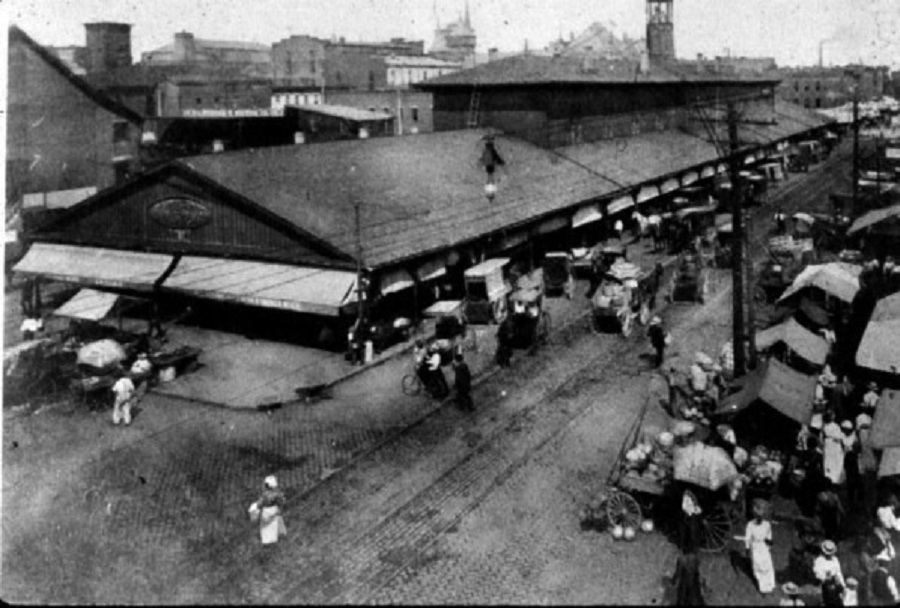
Central Market C. 1860-1880 Central Market was a very popular market for decades, and at its height, attracted some 20,000 shoppers during weekend days. Its success allowed for the creation of other, smaller markets nearby. East Market was located at the intersection of Mt Vernon and Miami Avenues in the King-Lincoln neighborhood. West Market was located on S. Gift Street in Franklinton. North Market, the last to be built, was finished in 1876 and located at the intersection of Spruce and N. Hight Streets.
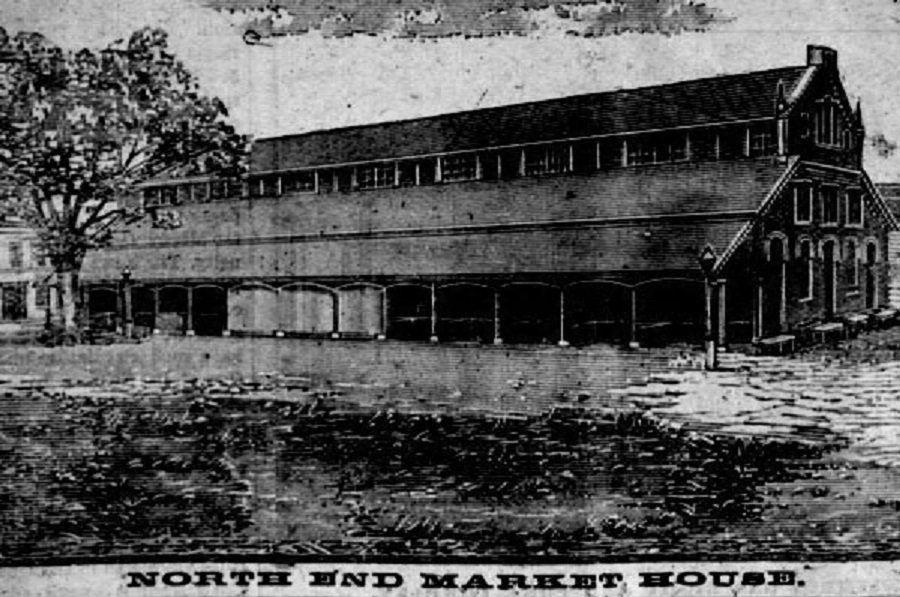
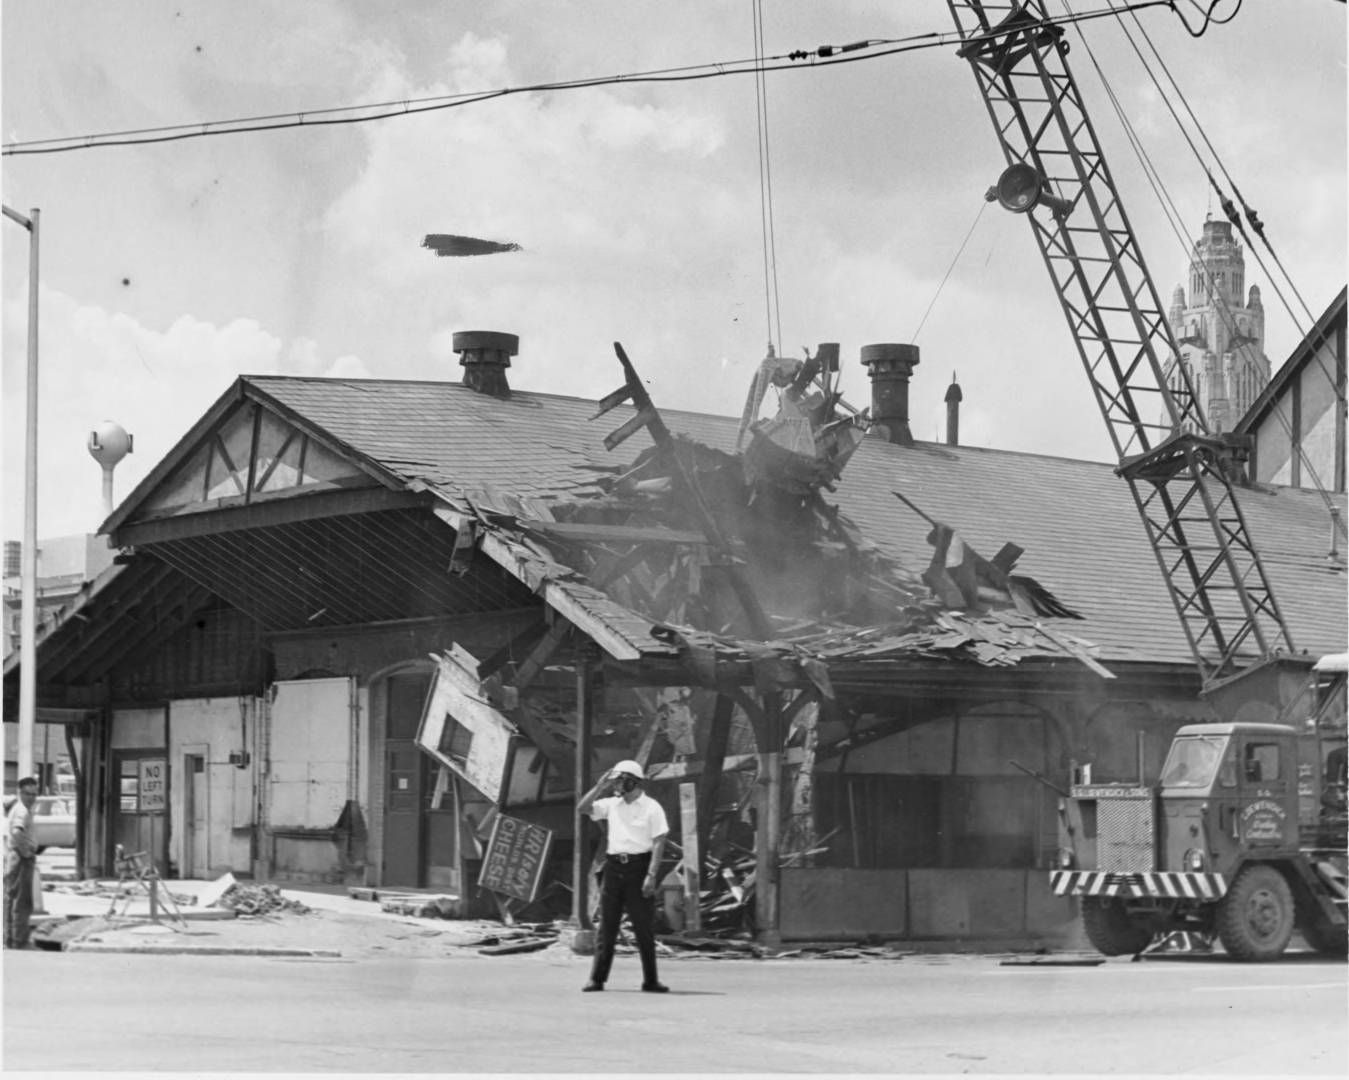
Original North Market: 1876-1948 As time passed, each of these markets succumbed, most notably through fire. East and West Markets were gone by the 1940s, and North Market, too, burned to the ground in February 1948. Central Market was spared fire and significant alteration, existing almost exactly as it was built through the entirety of its lifetime. It also continued to serve as a marketplace, albeit with steadily declining traffic, through the 1950s. Its future, however, was doomed. With no widespread preservation groups at the time and with the push for Urban Renewal, a historic relic like Central Market had no chance. So, in June 1966, Central Market was demolished to make way for a new Greyhound Bus terminal, an exceedingly ugly building built in the brutalist style that was popular during the time. Central Market’s Demolition: 1966
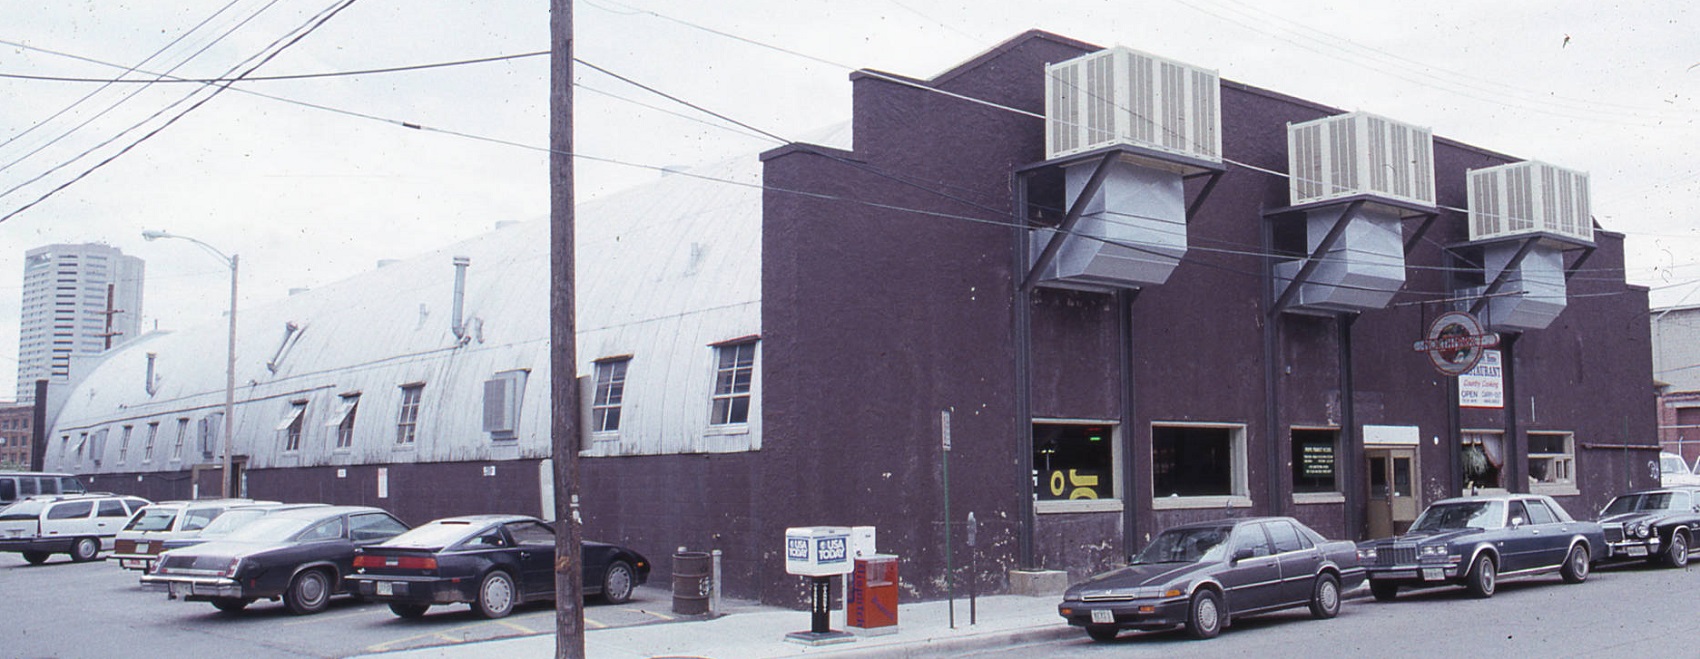
North Market’s replacement did survive somewhat, but was in pretty bad shape by the 1980s. In 1988, the North Market Development Authority was formed to bring the old market back to life. Unfortunately, the old building was not feasible to reuse as the market. The 1948 North Market building from Spruce Street: 1990
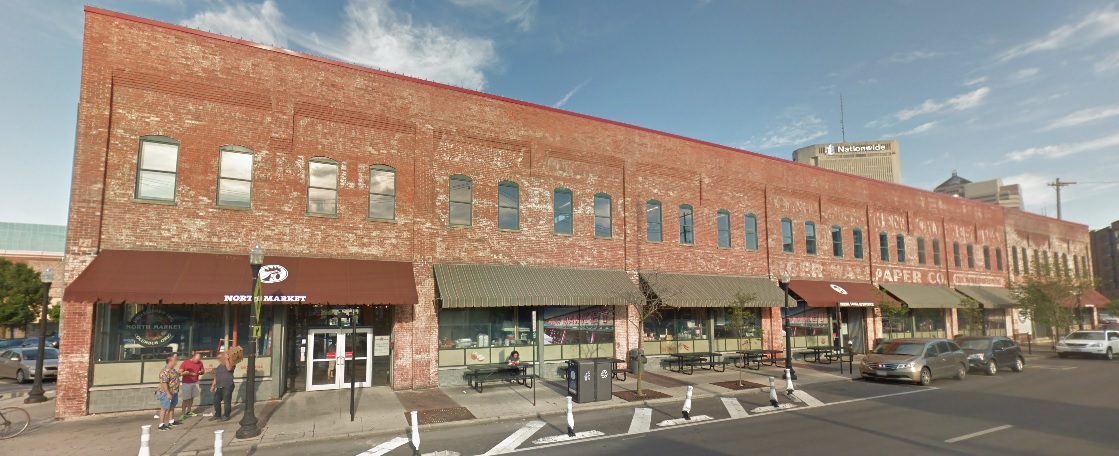
In 1992, Nationwide Insurance sold the NMDA a former warehouse just to the west of the original location. A $5 million renovation of the warehouse was completed and the new North Market opened in November 1995. Today, North Market remains a very popular destination and has played a role in the area’s revitalization, especially along Park Street, which has become a popular spot for new bars and restaurants. It has become a strong incubator for area small businesses and helped launch concepts such as Jeni’s Ice Creams. North Market: 2018
Although much has been lost to time, markets are now returning as an important part of urban life. With North Market’s success and a now increasing population in the Downtown area, a need for the market has returned. A Hills Market grocery store is now in the works at Grant Avenue and should be opening within the next month or two. While lacking the scale and nature of 19th century marketplaces, it will serve new generations of Downtown residents who are helping to bring back this urban neighborhood.
See Shopping Centers for the continuation of the local retail story.
Snow rollers in Columbus after the January 2-3, 1999 event.
In this episode of weather history, we’ll look at the January 1999 snowstorm that pummeled the Columbus area. New Year’s Day, 1999 dawned partly cloudy and cold in Ohio, a tranquil early January day in what had been until then a very warm fall and beginning to winter. Both November and December 1998 had been very warm months. December even had highs reaching into the 70’s early in the month, a truly rare occurrence. However, by the end of December, conditions had taken a turn.
On December 21, 1998, a cold front moved through Ohio, bringing copious amounts of rain. Most cities in Ohio received more than 1″ of rainfall, with several getting 2-3″. This front was the beginning of a very active period that would last for the next three weeks into mid-January. This pattern is not uncommon in La Nina winters, where the Midwest and Ohio Valley, in particular, are often much wetter than normal.
In any event, temperatures fell behind the front and remained generally below normal through the rest of the month of December, though no significant snow events came with the colder weather. That was about to change.
National radars on January 1, 1999 showed blossoming snow in the Great Plains, with cold air pushing south and abundant moisture pushing north from the Gulf of Mexico. Forecasts called for a significant winter storm beginning late on the 1st and lasting through the 2nd. The storm arrived a bit later than expected, but arrived in most areas during the overnight hours of the 1st/2nd as heavy snowfall. The snow initially fell at the rate of at least 1″ per hour, and thundersnow was reported from Cincinnati up through Dayton and Columbus.
During the day on the 2nd, warm air began to affect upper layers of the atmosphere, and the snow gradually began to change over to sleet and freezing rain, with an accumulation of ice of up to 1/2″ in some areas on top of the snow. By then, though, the damage was done. 4-6″ of snow fell in the Cincinnati area, with 6-10″ along the I-70 corridor. Up to 12″ fell to the north of there. Gusty winds created blowing and drifting snow at times, particularly in the northern areas that received less of a coating of ice.
Temperatures turned colder as the storm passed, and what precipitation remained changed back to snow showers by the 3rd of January. Temperatures would remain in the low to mid-teens for highs during the next two days before another storm would set eyes on the state.
Snow Totals for January 2-3, 1999 Dayton: 7.5″ Columbus: 6.6″ Cincinnati: 4.2″
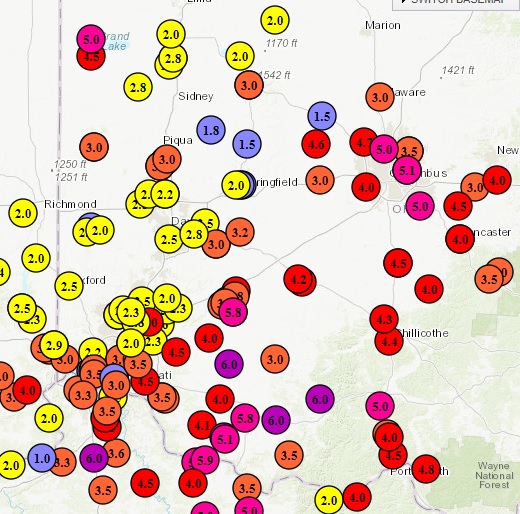
Snow totals in the area from the December 29, 2012 snowstorm.
For this December 2012 weather recap, we’ll quickly review what was probably one of the strangest months ever for weather. The first three weeks were extremely warm, being almost 10 degrees above normal. The last 10 days cooled off, but not enough to make up for the warmth. The mean was 39.4 degrees, or 5.9 degrees above normal, and December ended up being the 10th warmest on record.
Although the month was very wet from the beginning (3rd wettest), there was also only a trace of snowfall through the 20th, and it looked like the month might end with below normal snowfall. Then 4 separate snow events dropped 14.9″ the last 10 days, making the month the 4th snowiest December of all time. Not only that, but two of the snowfalls (5.9″ and 4.9″) were two of the top 20 snowfalls for a December.
December 2012 will definitely go down as one of those months that defied expectations.
In a first of its kind, this is the Columbus housing market update for December 2012. In it, the local housing market will be detailed by categories such as most expensive market, market listing rankings and more.
Note: LSD= Local School District, CSD= City School District. In both cases, school district boundaries differ from city boundaries.
Top 15 Most Expensive Locations By Median Sales Price in December 2012 1. New Albany: $535,000 2. New Albany Plain LSD: $397,450 3. German Village: $376,000 4. Grandview Heights: $362,500 5. Powell: $354,950 6. Dublin: $343,600 7. Granville CSD: $330,000 8. Bexley: $325,000 9. Upper Arlington CSD: $319,500 10. Olentangy LSD: $315,000 11. Big Walnut LSD: $306,250 12. Dublin CSD: $271,500 13. Worthington: $$270,000 14. Buckeye Valley LSD: $259,000 15. Sunbury: $253,000
New Albany was by far the most expensive local market around Columbus.
Top 15 Least Expensive Locations by Median Sales Price in December 2012 1. Obetz: $80,100 2. Hamilton LSD: $80,100 3. Whitehall: $85,950 4. Newark CSD: $86,900 5. Lancaster CSD: $103,000 6. Jefferson LSD: $123,000 7. London CSD: $124,000 8. Groveport Madison LSD: $125,900 9. Reynoldsburg CSD: $125,950 10. Columbus CSD: $129,900 11. South-Western CSD: $131,000 12. Columbus: $140,026 13. Jonathan Alder LSD: $150,000 14. Minerva Park: $159,500 15. Grove City: $160,950
Southern and eastern suburbs tend to perform best on this list, as well as Columbus itself.
Overall Market Median Sales Price in December 2012: $158,645
Top 15 Locations with the Highest Median Sales Price % Growth Between December 2011 and December 2012 1. Whitehall: +69.5% 2. Circleville CSD: +64.9% 3. Sunbury: +63.0% 4. Jefferson LSD: +53.5% 5. Big Walnut LSD: +44.1% 6. Canal Winchester CSD: +40.9% 7. Westerville: +29.8% 8. Westerville CSD: +27.3% 9. Powell: +25.4% 10. Pataskala: +24.0% 11. Olentangy LSD: +23.5% 12. Gahanna Jefferson CSD: +21.8% 13. Grandview Heights: +21.2% 14. Granville CSD: +20.0% 15. Pickerington: +17.7%
Top 15 Locations with the Lowest Median Sales Price % Growth Between December 2011 and December 2012 1. London CSD: -53.5% 2. Obetz: -38.3% 3. Hamilton LSD: -27.1% 4. Jonathan Alder LSD: -25.2% 5. Buckeye Valley LSD: -23.0% 6. Reynoldsburg CSD: -18.7% 7. Hilliard: -17.7% 8. Lancaster CSD: -17.6% 9. Grove City: -15.3% 10. Dublin CSD: -12.8% 11. Johnstown Monroe LSD: -10.8% 12. Upper Arlington CSD: -8.5% 13. Newark CSD: -8.1% 14. Dublin: -7.1% 15. South-Western CSD: -6.4%
Overall Market Median Sales Price % Change December 2011 vs. December 2012: -0.3%
Top 10 Locations with the Most New Listings in December 2012 1. Columbus: 829 2. Columbus CSD: 544 3. South-Western CSD: 136 4. Olentangy LSD: 122 5. Westerville CSD: 100 6. Hilliard CSD: 94 7. Dublin CSD: 89 8. Worthington CSD: 66 9. Dublin: 64 10. Pickerington LSD: 60
Top 10 Locations with the Fewest New Listings in December 2012 1. Valleyview: 0 2. Lithopolis: 1 3. Sunbury: 2 4. Minerva Park: 2 5. Obetz: 3 6. Johnstown Monroe LSD: 5 7. Jefferson LSD: 8 8. German Village: 8 9. Hamilton LSD: 8 10. Whitehall: 11 11. Granville CSD: 12
Total New Listings in the Columbus Metro in December 2012: 2,002 Overall Metro New Listings % Change December 2011-December 2012: +10.5%
Overall, prices are slightly down as supply is currently outstripping demand.
For more information on the local market, go here: Columbus Realtors