Ohio 2020 Election Voting Trends


Ohio 2020 election voting trends

Handy Election Links
Ohio Board of Elections
US Election Atlas

This post will update daily county voting data, where available, through the election. Numbers in parenthesis are from the previous day, for comparison. There are 8 counties without data, as those county board of elections do not post their statistics online.

**Last Updated: 11/2/2020- 10AM

Total Votes in Ohio Through 11/1: 2,909,171 (2,854,258)

Total Votes By County Through 11/1
Adams: 6,772 (6,671)
Allen: 23,182 (22,933)
Ashland: 15,801 (15,490)
Ashtabula: 21,965 (21,965)
Athens: 15,356 (15,174)
Auglaize: 13,535 (13,185)
Belmont: 19,061 (18,838)
Brown: 11,252 (11,075)
Butler: 22,972 (22,768)
Carroll: 7,313 (7,209)
Champaign: 11,201 (11,029)
Clark: 38,899 (38,343)
Clermont: County not reporting.
Clinton: 11,651 (11,441)
Columbiana: 21,210 (20,849)
Coshocton: 10,556 (10,399)
Crawford: 11,804 (11,804)
Cuyahoga: 353,965 (345,496)
Darke: 15,243 (14,905)
Defiance: 12,729 (12,461)
Delaware: 82,556 (81,087)
Erie: 21,899 (21,566)
Fairfield: 26,869 (25,350)
Fayette: 6,843 (6,655)
Franklin: 347,811 (335,495)
Fulton: 12,244 (11,890)
Gallia: 7,821 (7,694)
Geauga: 32,862 (32,367)
Greene: 50,008 (48,243)
Guernsey: 9,082 (9,082)
Hamilton: 235,412 (227,802)
Hancock: County not reporting.
Hardin: 7,289 (7,074)
Harrison: 3,650 (3,599)
Henry: 8,687 (8,433)
Highland: 9,630 (9,365)
Hocking: 8,983 (8,827)
Holmes: 7,325 (7,325)
Huron: 15,374 (15,071)
Jackson: 10,155 (9,965)
Jefferson: 17,441 (17,227)
Knox: 18,807 (18,554)
Lake: 79,840 (75,508)
Lawrence: 13,749 (13,469)
Licking: 59,108 (57,533)
Logan: 15,956 (15,644)
Lorain: 93,233 (92,027)
Lucas: 90,962 (90,089)
Madison: 11,671 (11,424)
Mahoning: 65,722 (64,003)
Marion: 18,048 (17,647)
Medina: 62,168 (61,353)
Meigs: 6,048 (6,048)
Mercer: County not reporting.
Miami: 35,168 (34,486)
Monroe: 4,003 (3,956)
Montgomery: 148,677 (146,289)
Morgan: 4,363 (4,284)
Morrow: County not reporting.
Muskingum: 23,241 (22,990)
Noble: 3,772 (3,772)
Ottawa: County not reporting.
Paulding: 5,558 (5,445)
Perry: 8,974 (8,771)
Pickaway: 14,676 (14,443)
Pike: 8,515 (8,279)
Portage: 45,041 (44,366)
Preble: 10,994 (10,818)
Putnam: 11,608 (11,366)
Richland: 36,453 (35,548)
Ross: 19,779 (19,581)
Sandusky: County not reporting.
Scioto: 17,883 (17,595)
Seneca: 13,273 (13,047)
Shelby: 13,867 (13,676)
Stark: County not reporting.
Summit: 144,983 (143,107)
Trumbull: 27,901 (27,901)
Tuscarawas: 19,975 (19,686)
Union: 22,739 (22,379)
Van Wert: 10,322 (10,040)
Vinton: 3,262 (3,198)
Warren: 86,450 (84,772)
Washington: 20,072 (19,781)
Wayne: County not reporting.
Williams: 10,409 (10,051)
Wood: 35,492 (35,492)
Wyandot: County not reporting.

Top 20 Counties with the Highest % of 2016’s Absentee Vote Through 11/1
1. Seneca: 242.96% (238.82%)
2. Meigs: 238.67% (238.67%)
3. Williams: 231.83% (223.85%)
4. Defiance: 225.13% (220.39%)
5. Auglaize: 220.37% (214.67%)
6. Fulton: 218.68% (212.36%)
7. Union: 216.27% (212.85%)
8. Putnam: 214.92% (210.44%)
9. Brown: 214.28% (210.91%)
10. Preble: 211.91% (208.52%)
11. Logan: 210.33% (206.22%)
12. Gallia: 209.34% (205.94%)
13. Hamilton: 208.96% (202.20%)
14. Shelby: 206.82% (203.97%)
15. Henry: 206.54% (200.50%)
16. Columbiana: 202.66% (199.21%)
17. Ashtabula: 198.03% (198.03%)
18. Washington: 196.19% (193.34%)
19. Wood: 195.93% (195.93%)
20. Delaware: 195.44% (92.16%)

County Average of 2016’s Absentee Vote: 153.92% (151.01%)

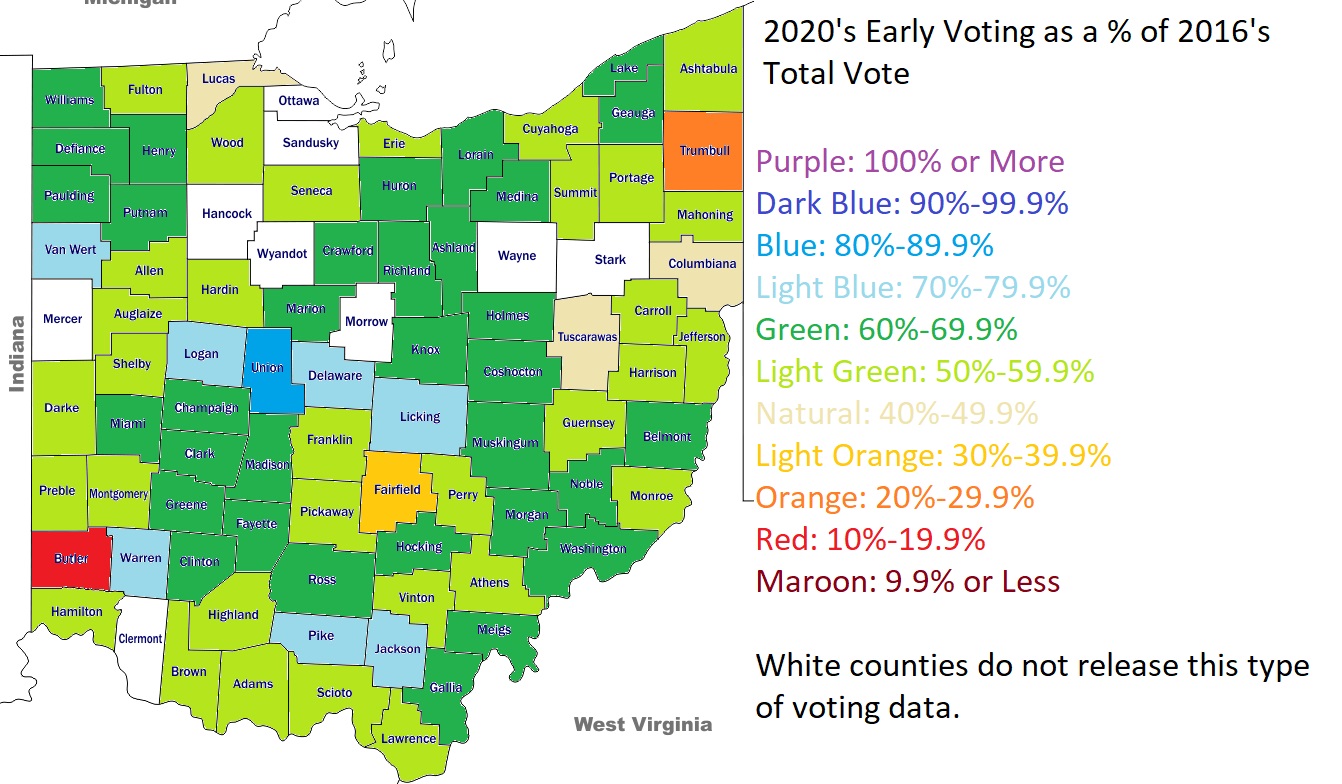
Top 20 Counties with the Highest % of 2016’s Total Vote Through 11/1
1. Union: 82.11% (80.81%)
2. Delaware: 78.15% (76.76%)
3. Van Wert: 74.96% (72.91%)
4. Jackson: 73.72% (72.34%)
5. Logan: 73.49% (72.05%)
6. Warren: 73.07% (71.65%)
7. Pike: 71.25% (69.27%)
8. Licking: 70.68% (68.80%)
9. Hocking: 69.48% (68.27%)
10. Defiance: 69.37% (67.91%)
11. Marion: 68.16% (66.65%)
12. Lake: 68.13% (64.43%)
13. Medina: 67.45% (66.57%)
14. Coshocton: 67.41% (66.41%)
15. Morgan: 67.36% (66.14%)
16. Madison: 66.99% (65.58%)
17. Washington: 66.60% (65.64%)
18. Lorain: 66.33% (65.47%)
19. Miami: 66.24% (64.95%)
20. Holmes: 65.96% (65.96%)

County Average of 2016’s Total Vote: 52.54% (51.55%)

Top 20 Counties with the Highest Return Rate for 2020 Absentee Ballots Through 11/1
1. Van Wert: 97.18% (96.33%)
2. Logan: 96.87% (96.61%)
3. Putnam: 96.49% (96.31%)
4. Defiance: 96.48% (96.20%)
5. Shelby: 96.33% (96.02%)
6. Henry: 96.21% (95.71%)
7. Washington: 96.20% (95.91%)
8. Paulding: 96.18% (96.08%)
9. Darke: 96.16% (95.43%)
10. Hocking: 96.09% (95.60%)
11. Preble: 96.07% (96.00%)
12. Auglaize: 95.93% (95.61%)
13. Union: 95.92% (94.41%)
14. Ashland: 95.90% (95.81%)
15. Hardin: 95.81% (95.39%)
16. Brown: 95.80% (95.65%)
17. Marion: 95.79% (95.47%)
18. Meigs: 95.79% (95.79%)
19. Miami: 95.75% (93.89%)
20. Fulton: 95.74% (92.97%)

County Average of the Return Rate for 2020 Absentee Ballots: 92.02% (91.09%)

Ohio does not register voters by party, but most counties do release the breakdown of how registered voters voted in previous elections and apply that breakdown to current early voting totals. These numbers are in no way any guarantee of how voters will actually vote in 2020, but they do provide at least some context as to *who* is voting so far. So which party’s past voters are ahead in the counties?

And here is a map of the net change of Democratic and Republican early votes between 2016 and 2020. Again, although we can’t be sure who these people voted for, it does appear that Democrats have made broad gains across most of the state.


Columbus Halloween Climatology


Columbus' Halloween climatology

Halloween in Columbus has historically not been as volatile as some other holidays. If anything, a bit of rain and chilly temperatures are what ruin the festivities more often than not. This post examines Columbus Halloween climatology across several categories. Data comes from historic records and the Wilmington National Weather Service.

Here are the temperature extremes that have occurred.

Top 10 Coldest Highs
1. 1906: 38
2. 1993: 39
3. 1878, 1895: 40
4. 1913, 1923, 1954: 41
5. 1885, 1917, 2012: 42
6. 1890: 43
7. 1908, 1925, 1926, 2017: 44
8. 1898, 1905: 45
9. 1930, 1976: 46
10. 1879, 1931, 2002: 47

Top 10 Coldest Lows
1. 1887: 20
2. 1962, 1988: 25
3. 1923: 27
4. 1908, 1925: 28
5. 1885, 1893, 1913, 1917, 1953, 1975: 29
6. 1904, 1906: 30
7. 1878, 1938, 1954, 1968: 31
8. 1928, 1934, 1949, 1958, 1964, 1976, 1980, 2000: 32
9. 1879, 1926, 1930, 2017: 33
10.1890, 1936, 1951, 1966, 1969, 1993, 1996, 2002, 2008, 2010: 34

Top 10 Coldest Means
1. 1906, 1923: 34
2. 1913: 35
3. 1878, 1885, 1908, 1917, 1925, 1954: 36
4. 1887, 1962, 1993: 37
5. 1895: 38
6. 1890, 1926, 1976, 1988, 2017 39
7. 1879, 1930, 2012: 40
8. 2002: 41
9. 1893, 1894, 1898, 1905, 1975, 1996: 42
10. 1939, 1955, 2010: 43

Top 10 Warmest Highs
1. 1950: 83
2. 1974: 80
3. 1900: 79
4. 1927, 1933: 78
5. 1979, 2003: 75
6. 1882, 1901, 1982, 1999: 74
7. 1909, 1990: 73
8. 1888, 1935, 1944, 1987 72
9. 1915, 1971: 71
10. 1919: 70

Top 10 Warmest Lows
1. 1919: 61
2. 1882: 60
3. 2003: 59
4. 1927, 1929: 58
5. 1900, 1956, 2013: 57
6. 1921, 1941, 1982, 2018: 56
7. 1950: 55
8. 1959, 1979: 54
9. 1971: 53
10. 1881, 1891, 1933, 1946, 1974, 1991: 52

Top 10 Warmest Means
1. 1950: 69
2. 1900, 1927: 68
3. 1882, 2003: 67
4. 1919, 1974: 66
5. 1933, 1979, 1982: 65
6. 1901, 1929, 1956: 63
7. 1971, 2013: 62
8. 1890, 1999: 61
9. 1909, 1921, 1935, 1941, 1946, 1991, 2018: 60
10. 1984, 2001: 59

Halloween High Temperatures by Occurrence since 1878
Below 40: 2
40-49: 27
50-59: 35
60-69: 59
70-79: 18
80 and Above: 2

Halloween Low Temperature by Occurrence since 1878
Below 20: 0
20-29: 12
30-39: 54
40-49: 51
50-59: 24
60 and Above: 2

And the precipitation extremes.

Top 10 Wettest
1. 2019: 1.51″
2. 1932: 1.44″
3. 2009: 1.21″
4. 2013: 0.98″
5. 1941: 0.97″
6. 1919: 0.91″
7. 2018: 0.63″
8. 1942: 0.51″
9. 1960: 0.45″
10. 1905, 1973: 0.43″

Halloween Precipitation by Amount Occurrence since 1878
None: 78
Trace: 11
0.01-0.24: 37
0.25-0.49: 9
0.50-0.99: 5
1.00 or More: 3

Snow has been very rare for Halloween, especially accumulating snow. 1993 saw the only time that an inch or more of snow fell.

Top 10 Snowiest
1. 1993: 1.0″
2. 1954: 0.2″
3. 1906, 1917, 1926, 1930, 2012, 2019: Trace


Cool Link Ohio’s Haunted Halloween Attractions


Ohio's haunted Halloween attractions

Halloween is just weeks away, and although the pandemic continues and festivities have been greatly reduced, some haunted Halloween attractions will be open this season, particularly those that are outdoors. Today’s link provides information on how to find the best of Ohio’s attractions, both locally and elsewhere in the state.

Haunt World
https://www.hauntworld.com/ohio-haunted-houses
Haunt World has a searchable database of haunted attractions nationally, with everything from videos and photos to hours of operation and reviews. You can even order tickets.

The Scare Factor
https://www.thescarefactor.com/haunt-blog/2020-list-of-haunted-houses-in-ohio-open-or-closed-for-covid-19/
This site doesn’t quite have as much information, but it is still a good national source.

Ohio Haunted Houses
https://www.ohiohauntedhouses.com/
This site is specific to Ohio and does a great job of listing haunts by type, giving a breakdown of everything from corn mazes and haunted trails to safe Trick ‘r Treating for kids throughout the state. It’s definitely worth a look.

After the chaos of this year, we all deserve to have a little fun, but as always, be safe out there!


Does Fall Weather Correlate to Winter Severity?


winter severity

Republished with data through the 2019-2020 winter.

As we go into the winter season, it’s time to talk about how this one might end up. There’s a belief that fall weather is a good sign of how cold or warm winter will be. Let’s see if that holds true.

First, let’s just look at October temperatures.
The October normal mean temperature for Columbus is 55 degrees.

Between 1878 and 2019, there have been 47 Octobers that featured a mean temperature of 53.9 degrees or lower, what we’re considering a Cold October for the purposes of this comparison.
Of those 47 Octobers, 27 of the 47 had following winters that were colder than normal, or 57.4%, 13 had average temperature winters, or 27.7%, and the remaining 7 were warmer than normal, or 14.9%.
Interestingly, this category contains both the warmest winter on record- 1889-1890 and the coldest on record- 1976-1977- as shown by the chart below.

Next, we look at Normal Octobers, which are +/- 1 degree of the 1981-2010 Average of 55 degrees.
Between 1878 and 2019, there were 45 normal Octobers. Of those, 21 had colder than normal following winters, or 46.7%. 11 were followed by normal winters, or 24.4%, and 13 had warmer than normal winters, or 28.9%.

Finally, let’s look at warm Octobers, which are those with means of 56.1 degrees or higher. There were 49 Octobers with warmer than normal means since 1878. Of those, 18 featured following winters that were colder than normal, or 36.7%. Another 19, or 38.8%, were followed by average winters. The final 12 winters, or 24.5%, were warmer than normal. Here’s the graph.

So just based on the October mean temperature, Octobers that are colder than normal are almost twice as likely as normal Octobers and almost 4x as likely as warm Octobers to be followed by a cold winter. But what about Novembers? It is closer to winter itself, so does its weather matter even more?

Colder than normal Novembers- 43.3 degrees or lower- included 80 Novembers since 1878. Of those, 38 or 47.5% had colder than normal winters. 22 (27.5%) had normal winters and 19, or 23.8%, had warmer than normal winters.

With the 39 normal Novembers, 43.4 to 45.4 degrees, there were 18 that had colder than normal winters, or 46.2%, with 12 normal winters (30.8%) and 9 warmer than normal winters (23.1%).

Finally, there were 24 warmer than normal Novembers since 1878- 45.5 degrees or higher. Only 6, or 25%, were followed by cold winters. An additional 9 (37.5%) were normal, while the last 9 (37.5%) were warmer than normal.

To reiterate, here are the ranked percentages of cold winters by the preceding October or November.
1. Cold Octobers: 57.4%
2. Cold Novembers: 47.5%
3. Normal Octobers: 46.7%
4. Normal Novembers: 46.2%
5. Warm Octobers: 36.7%
6. Warm Novembers: 25.0%

It should be no surprise that cold Octobers and Novembers have a stronger correlation to the following winters also being colder, with colder winters becoming increasingly unlikely as those months warm. What is surprising is that October weather, across the board, was more predictive of cold winters than Novembers were.

Going further, though, what about bi-monthly combinations?

Rank of Bi-Monthly Combinations and the percentage of colder than normal following winters, along with total years in sample:
Normal October/Normal November: 87.5% 8 Years
Cold October/Warm November: 57.1% 7 Years
Cold October/Cold November: 53.8% 26 Years
Normal October/Cold November: 48.1% 27 Years
Warm October/Cold November: 40.7% 27 Years
Cold October/Normal November: 38.5% 13 Years
Warm October/Warm November: 28.6% 7 Years
Warm October/Normal November: 25.0% 16 Years
Normal October/Warm November: 0.0% 8 Years

So a normal fall is clearly the best, but the sample size is not particularly high. Normal to Warm is unanimously warm, but again, it has a small sample size.

So does fall weather ultimately have a correlation to winter severity? To some degree yes, as patterns established in the fall tend to appear in the winter as well, but October, rather than November, has a clear higher correlation. But as with everything, there are many other factors involved.

October 2020 looks to at least begin with below normal temperatures, but it remains to be seen how it ends up.

To see records for Columbus falls and winters going back to 1878, visit the following links.
Autumn Weather Records
Winter Season Records

And to see current local weather and forecasts, visit: Wilmington National Weather Service


Ohio Census 2020 Response Rates


Ohio census 2020 response rates

The 2020 US Census is currently winding down, perhaps somewhat earlier than planned, but wrapping up nonetheless.
The accuracy of the Census relies heavily on enough people responding to the surveys. Because of the pandemic this year, the internet has played a bigger role in the response rates than normal, but there were still plenty of door to door workers doing surveys. How did Columbus, Central Ohio and other parts of the state do? Here are the Ohio census 2020 response rates.

First, let’s look at Ohio counties. These numbers are through September 2nd.

Top 10 counties for Census Response
1. Medina County: 81.9%
2. Delaware County: 79.7%
3. Geauga County, Warren County: 78.7%
4. Union County: 78.0%
5. Lake County: 77.4%
6. Auglaize County: 76.9%
7. Wayne County: 76.8%
8. Greene County: 76.0%
9. Miami County: 75.9%
10. Fulton County: 75.2%

Bottom 10 Counties for Census Response
1. Harrison County: 55.5%
2. Morgan County: 57.7%
3. Vinton County: 57.9%
4. Pike County: 58.5%
5. Monroe County: 58.8%
6. Lawrence County: 59.3%
7. Scioto County: 59.4%
8. Meigs County: 59.6%
9. Adams County: 59.9%
10. Ashtabula County, Athens County: 60.8%

Most of the high-reporting counties were large metro counties, while most of the low ones were Appalachia. This may be related to access to the internet, which again, played a crucial role this year.

Here are the counties that anchor Ohio’s largest metros
Lucas County: 64.6%
Cuyahoga County: 65.5%
Franklin County: 66.7%
Hamilton County: 66.7%
Mahoning County: 67.4%
Montgomery County: 68.0%
Stark County: 74.3%

Columbus’ Franklin County was tied for 3rd worst.

Now let’s look at Central Ohio cities and towns.
Minerva Park: 88.6%
Worthington: 86.8%
Upper Arlington: 85.7%
Westerville: 83.2%
Dublin: 82.7%
Canal Winchester: 81.8%
Grandview Heights: 81.8%
Gahanna: 81.1%
New Albany: 81.1%
Bexley: 79.5%
Grove City: 78.9%
Groveport: 78.9%
Pataskala: 77.4%
Hilliard: 77.0%
Valleyview: 76.5%
Reynoldsburg: 75.3%
Obetz: 72.7%
Pickerington: 71.6%
Columbus: 62.1%
Whitehall: 58.5%

Generally, the more urban commmunities tended to do worse than the outer suburbs. This has implications on urban areas possibly being undercounted, though the response rates are generally similar to what they were in 2010, so that concern is probably overblown to some extent.

If your’e interested in taking a further look at Ohio’s and other states numbers, visit the following link, in which response rates are tracked all the way down to the Census Tract level: https://2020census.gov/en/response-rates/self-response.html