A view of permitted residential units in Ohio going back to 1980.
With the Housing Data App, users can access different types of housing data for the state, metro, county and city levels going back to 1980. The housing data comparison can be viewed view residential units permitted, total buildings permitted or overall property values. The data can also be view in total and per-capita. Additionally, if you prefer, you can compare different cities or counties or states and see how their performance compares over time.
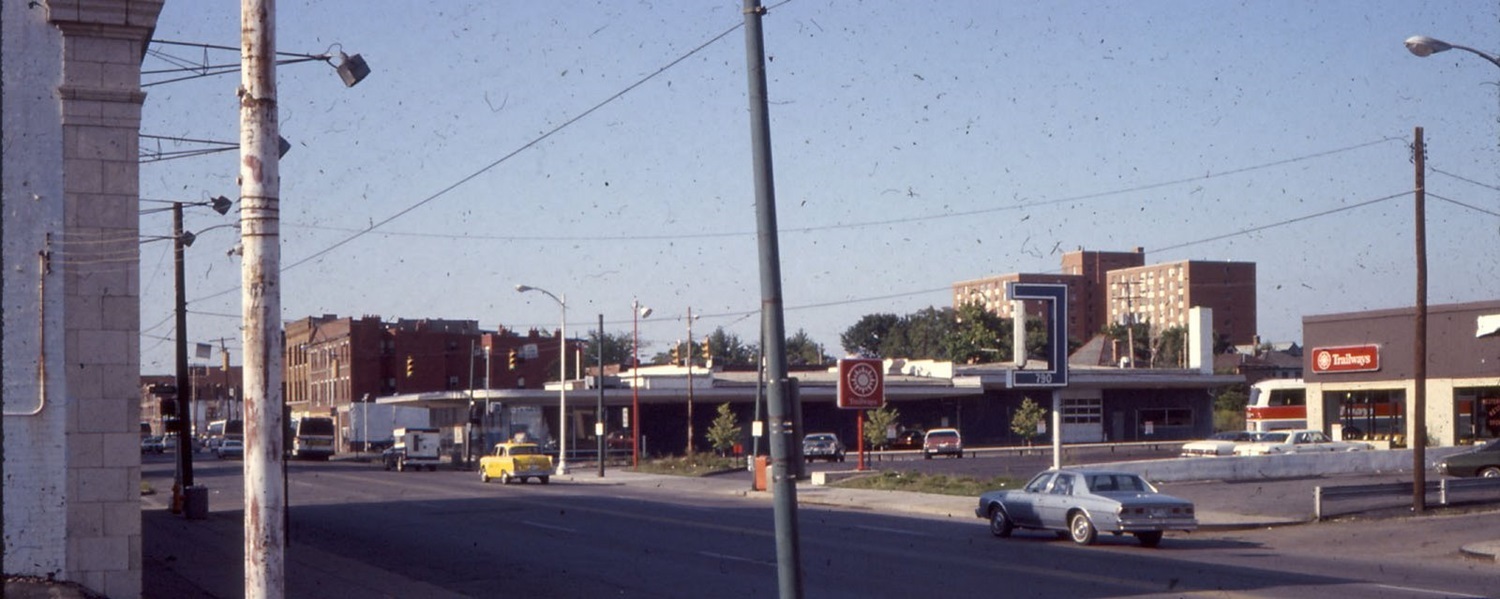
For today’s Random Columbus Photo 12, we don’t go back too far in history, but the before and after are definitely one of the more dramatic comparisons featured so far. Larger versions of both photos are available if you click on them.
Before: N. High Street at Hubbard Avenue looking northeast, around 1980. The Short North by the 1970s was considered a declined neighborhood with significant crime and prostitution problems. Police were called there often, and history tells that it was the police themselves who coined the name of the neighborhood, since it was an area that was just “short of Downtown”. In the photo, you can see buildings at 790 N. High and beyond. At the time, they were a Trailways bus station and some kind of office building. Trailways was eventually replaced by other businesses and restaurants over the years, the last being the restaurant Haiku until it was all demolished for the current hotel building.
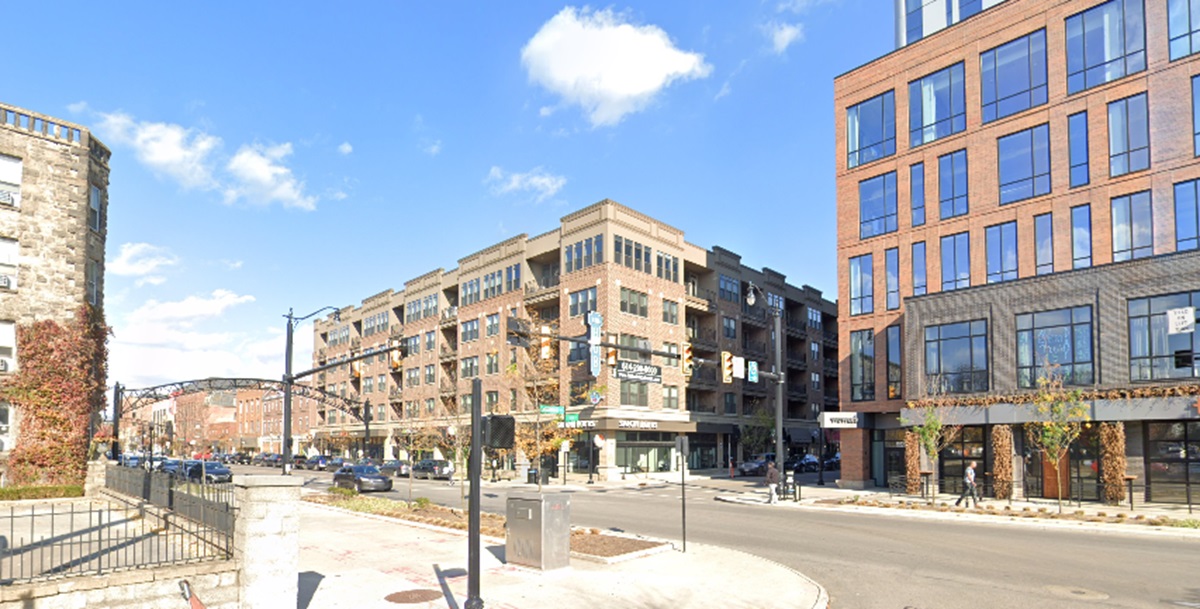
After: The same view in 2024. The picture from 2024 shows a drastically transformed neighborhood. After more than 40 years of renovations, revitalization and construction, the Short North has shed it’s drab and shady past. Crime stubbornly persists despite the improvements, but not nearly to the same degree. The taller apartment building in the older photo was torn down in the 1990s.
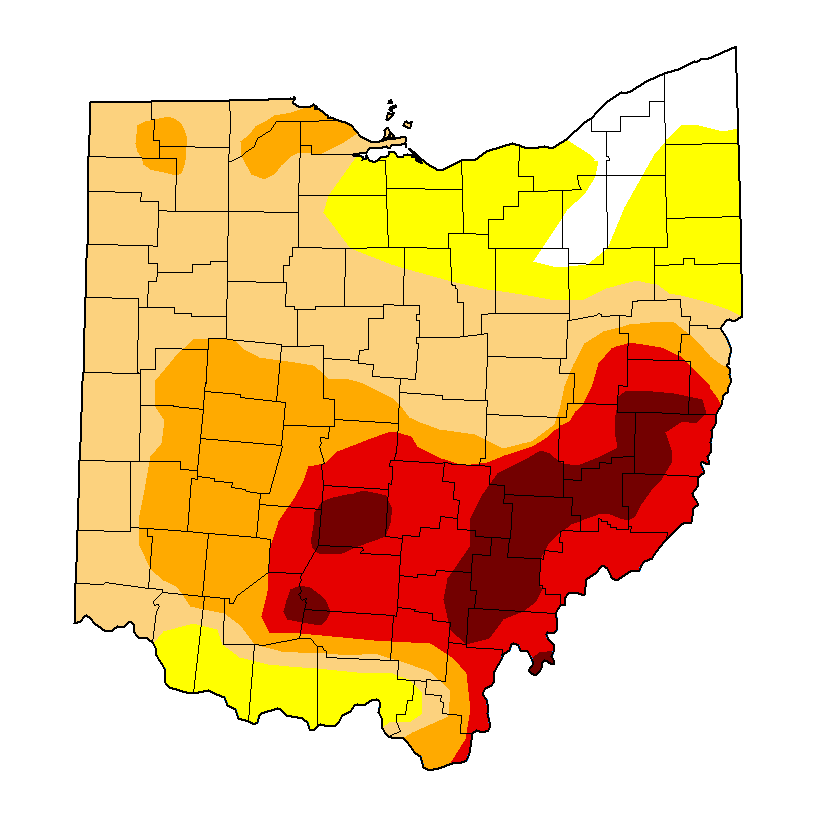
The Columbus area saw very little rain over the summer, and that trend has continued this September. This severe drought is affecting other parts of the state as well. How does the current dry period compare to the worst Columbus droughts historically, though?
2024’s longest period without measurable precipitation was 17 days, from 6/6/2024 to 6/22/2024.
However, having no precipitation at all for a significant period of time is relatively rare, and the formation of a drought usually occurs just because of low precipitation, not just no precipitation. And that’s certainly the case for 2024.
Top 10 Longest Periods with the Most Consecutive Days with 0.1″ or Less 1. 9/13/1963-10/30/1963: 48 2. 10/26/1904-12/9/1904: 45 3. 9/30/1924-11/12/1924: 44 4. 2/9/1969-3/23/1969: 43 5. 8/18/1908-9/27/1908, 6/12/1936-7/22/1936: 41 6. 10/1/1887-11/9/1887: 40 7. 7/17/1910-8/24/1910, 8/19/2024-9/26/2024: 39 8. 12/3/1955-1/9/1956: 38 9. 1/6/1944-2/10/1944, 9/29/1944-11/3/1944: 36 10. 12/14/1985-1/16/1986: 34
2024 produced the 9th longest period where daily rainfall failed to surpass 0.1″ for 39 consecutive days. Only 2 days during that period saw any measurable rainfall whatsoever.
The Summer of 2024 produced the 3rd lowest precipitation amount since reliable records began in 1879, with only the Dust Bowl years of 1930 and 1933 having slightly less. The 5.07″ that fell between June and August is extremely low. June’s precipitation was 6th lowest, July’s was a bit better at 16th lowest, and August’s was better still at 29th lowest. No month, though, saw 2″ or more, and the summer precipitation deficit was 7.68″ below normal, or less than 40% of normal. September is starting off dry as well. It’s already more than an inch below normal through the 11th, and there hasn’t been a single day with 0.1″ or more since August 18th. The forecast doesn’t show much hope, either. No rain- not even a small chance of it- is currently predicted through September 18th. If this pattern continues long enough, reservoirs may become dangerously low.
For Franklin County specifically, as of September 10th, 100% of the county is in the classification of Severe Drought, and 66.4% is classified as being in Extreme Drought.
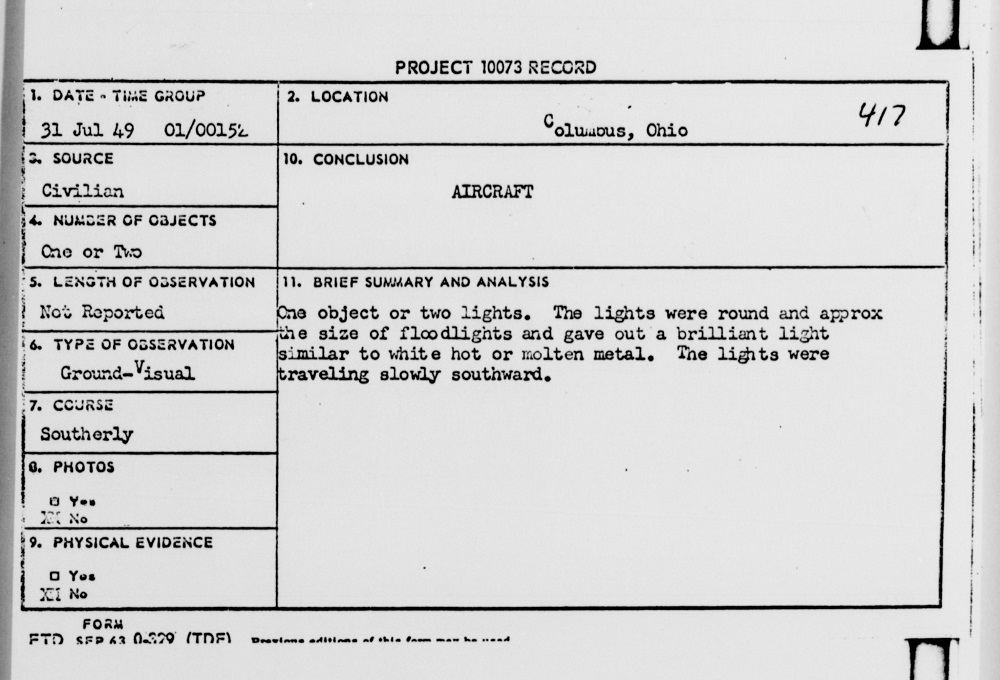
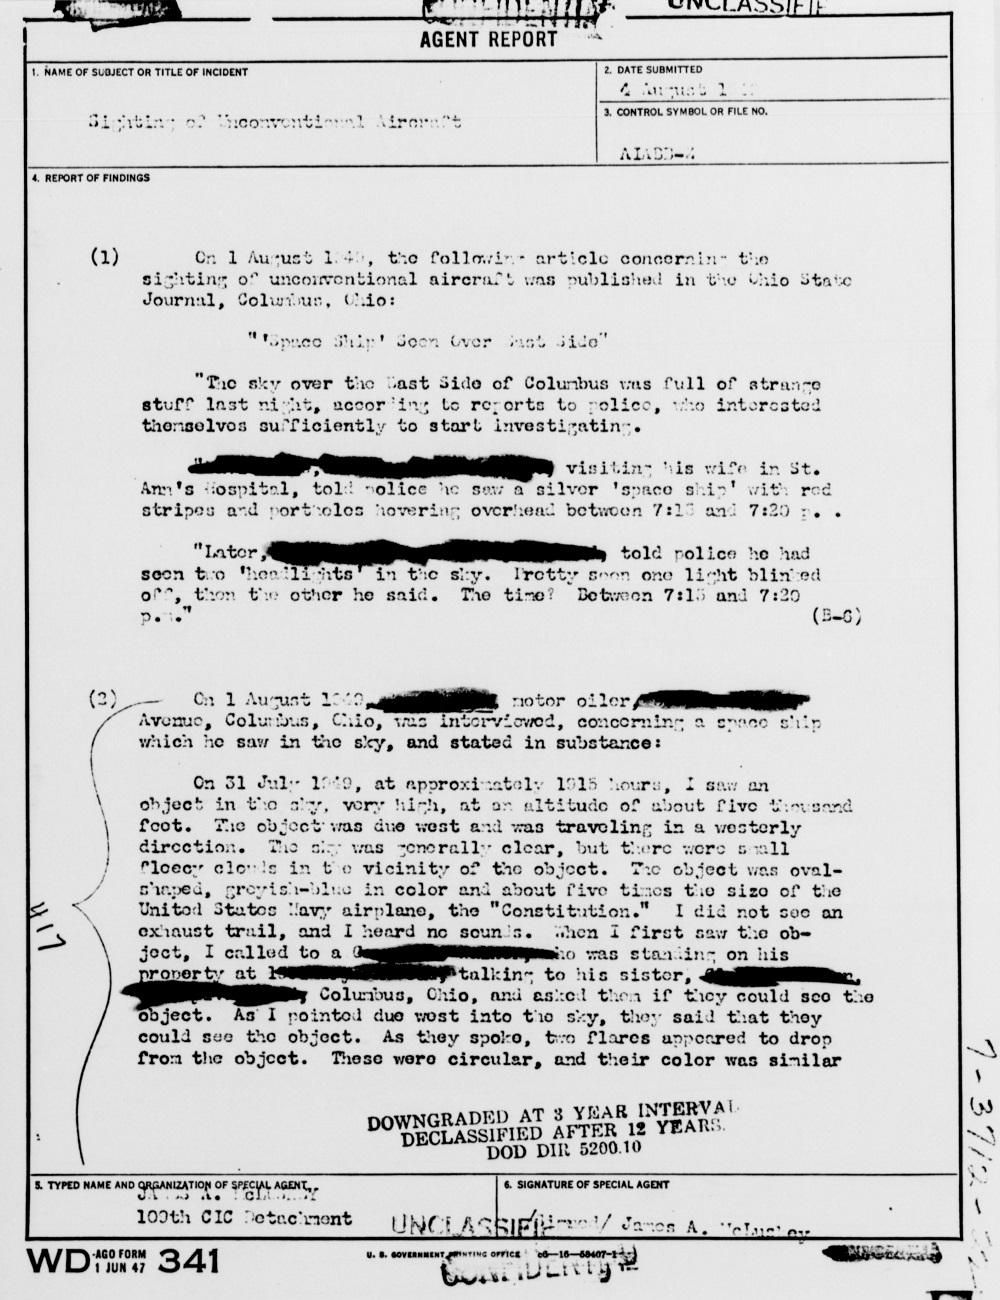
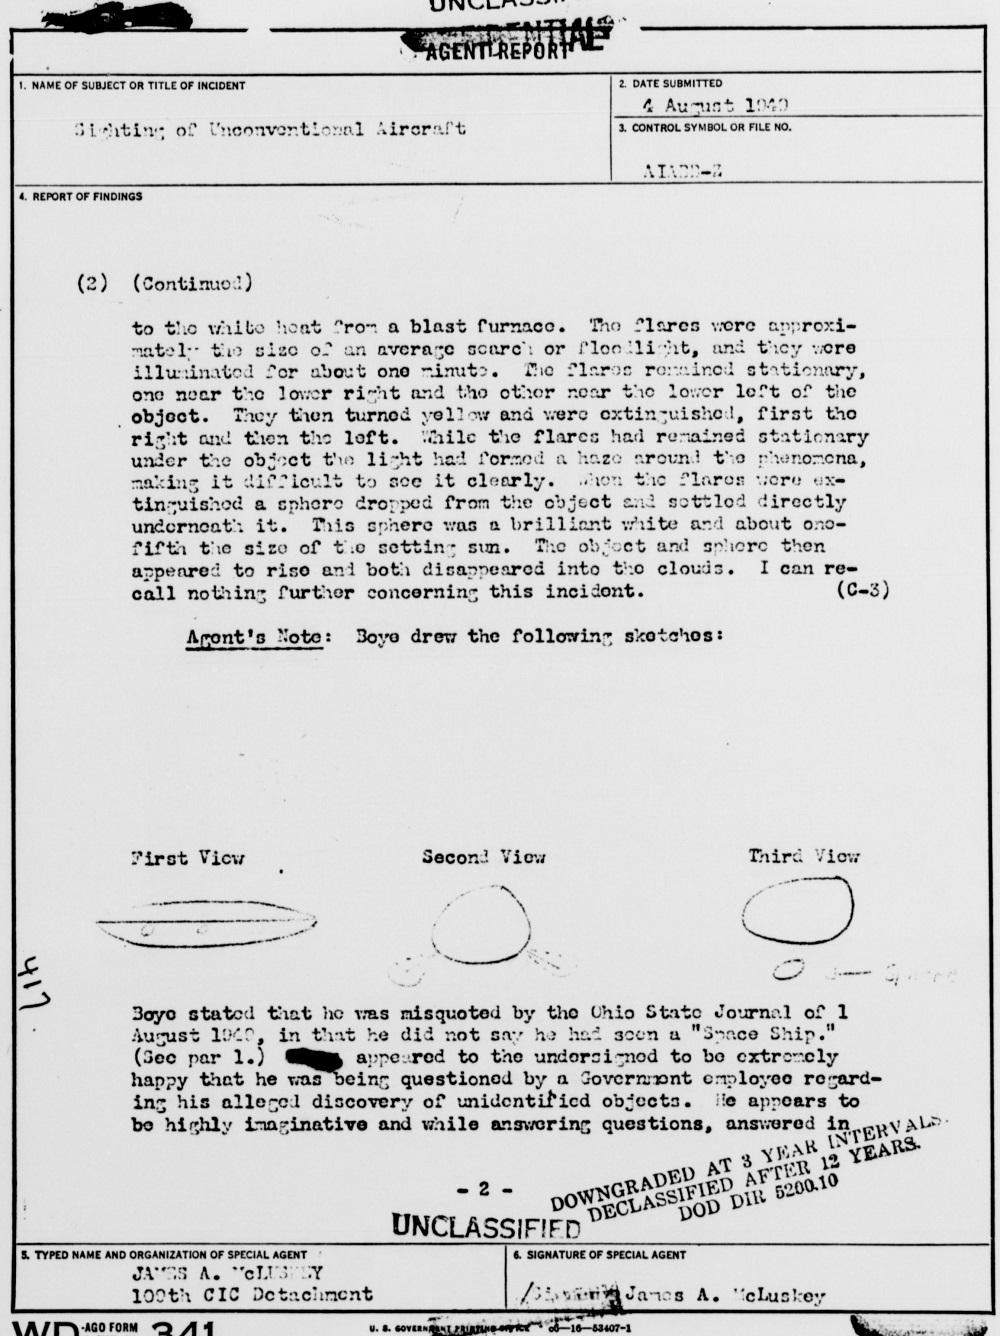
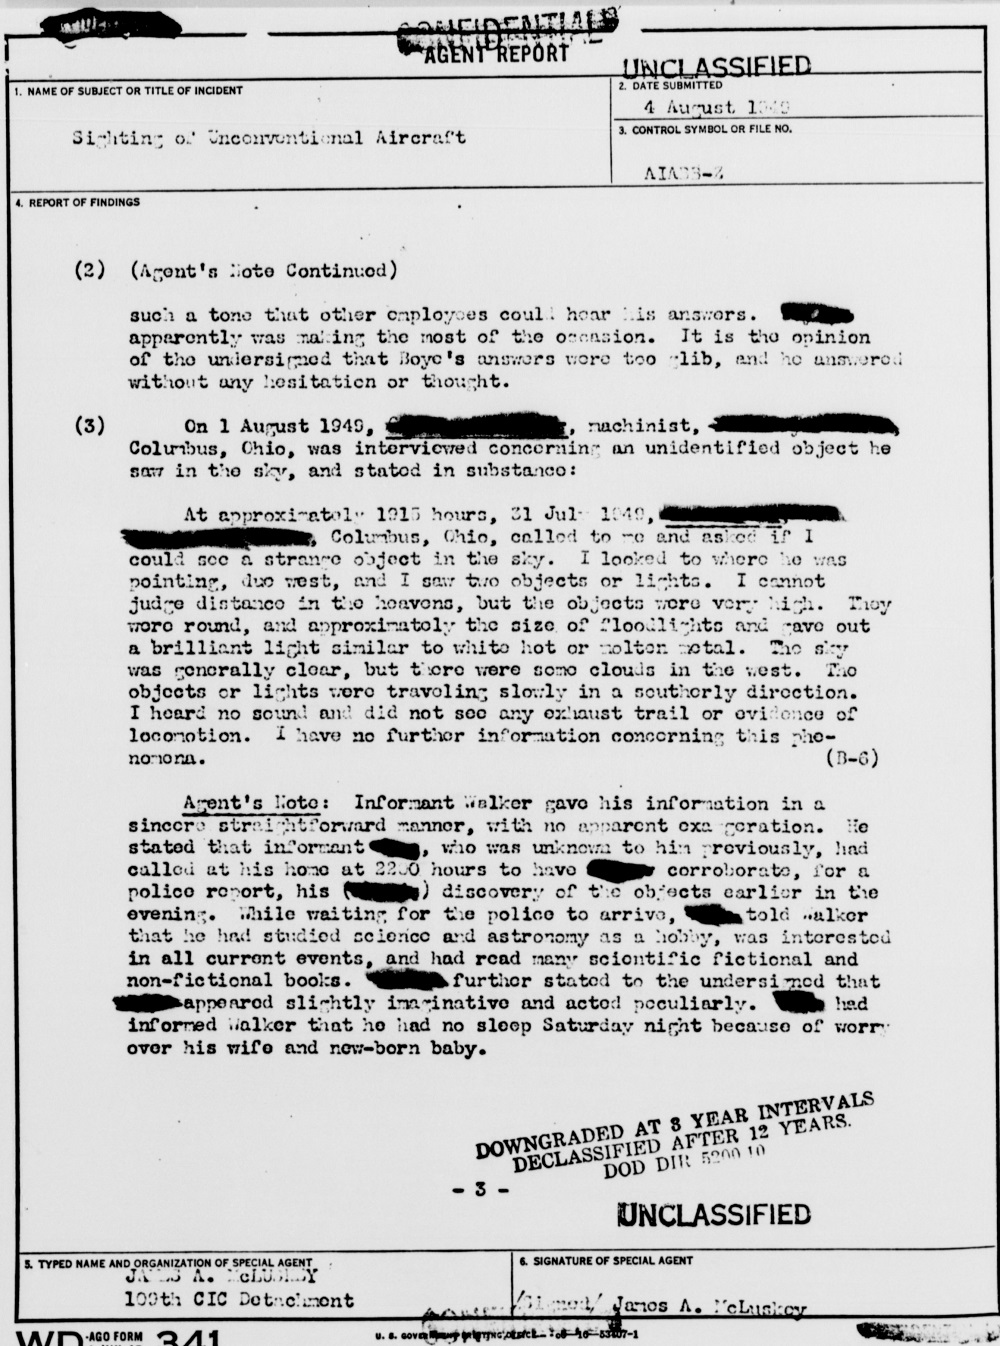
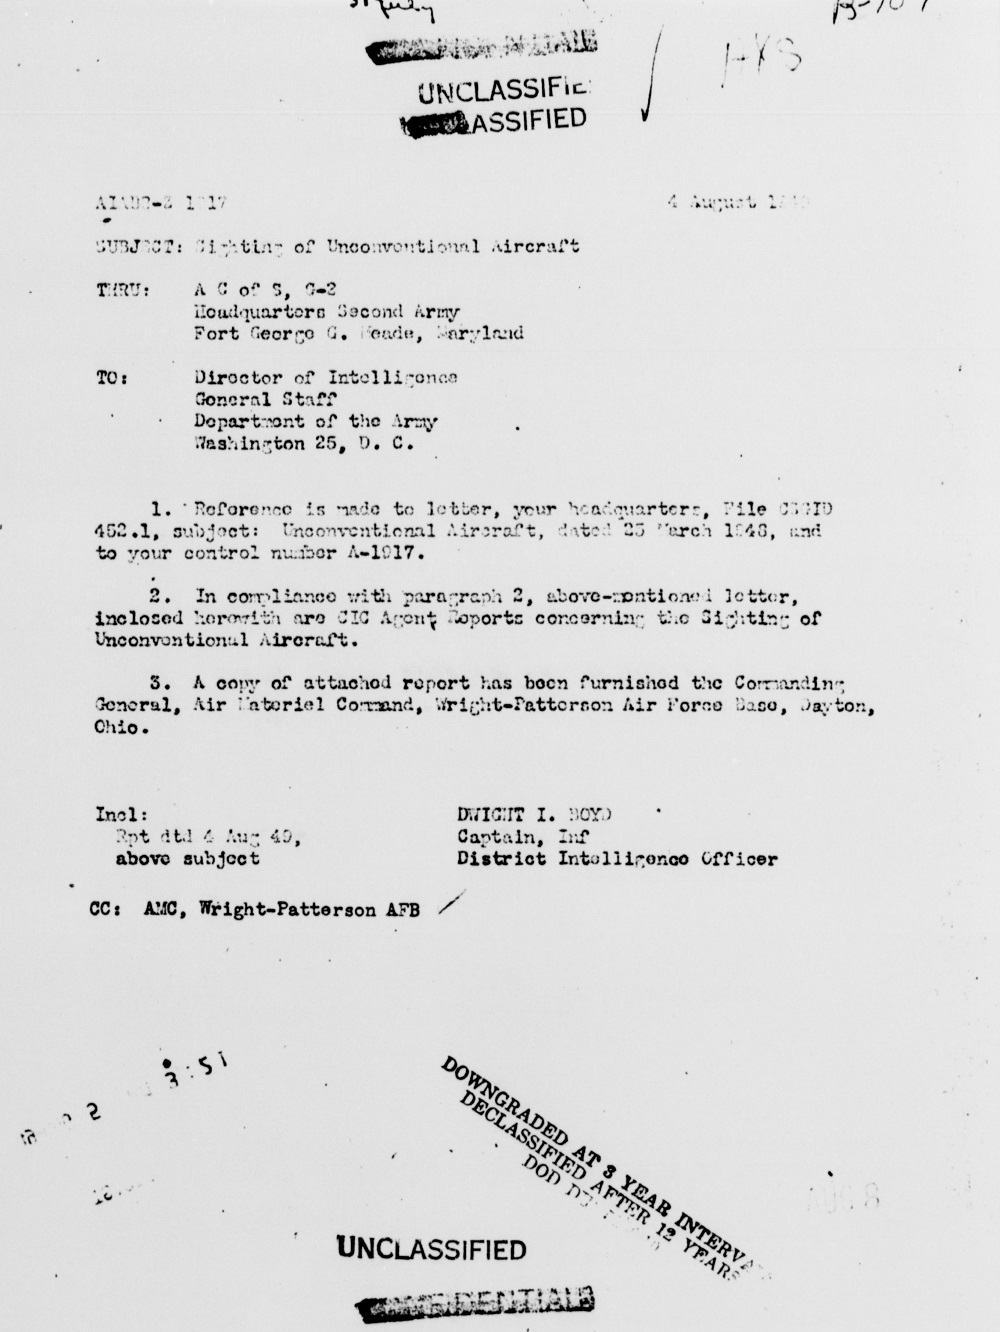
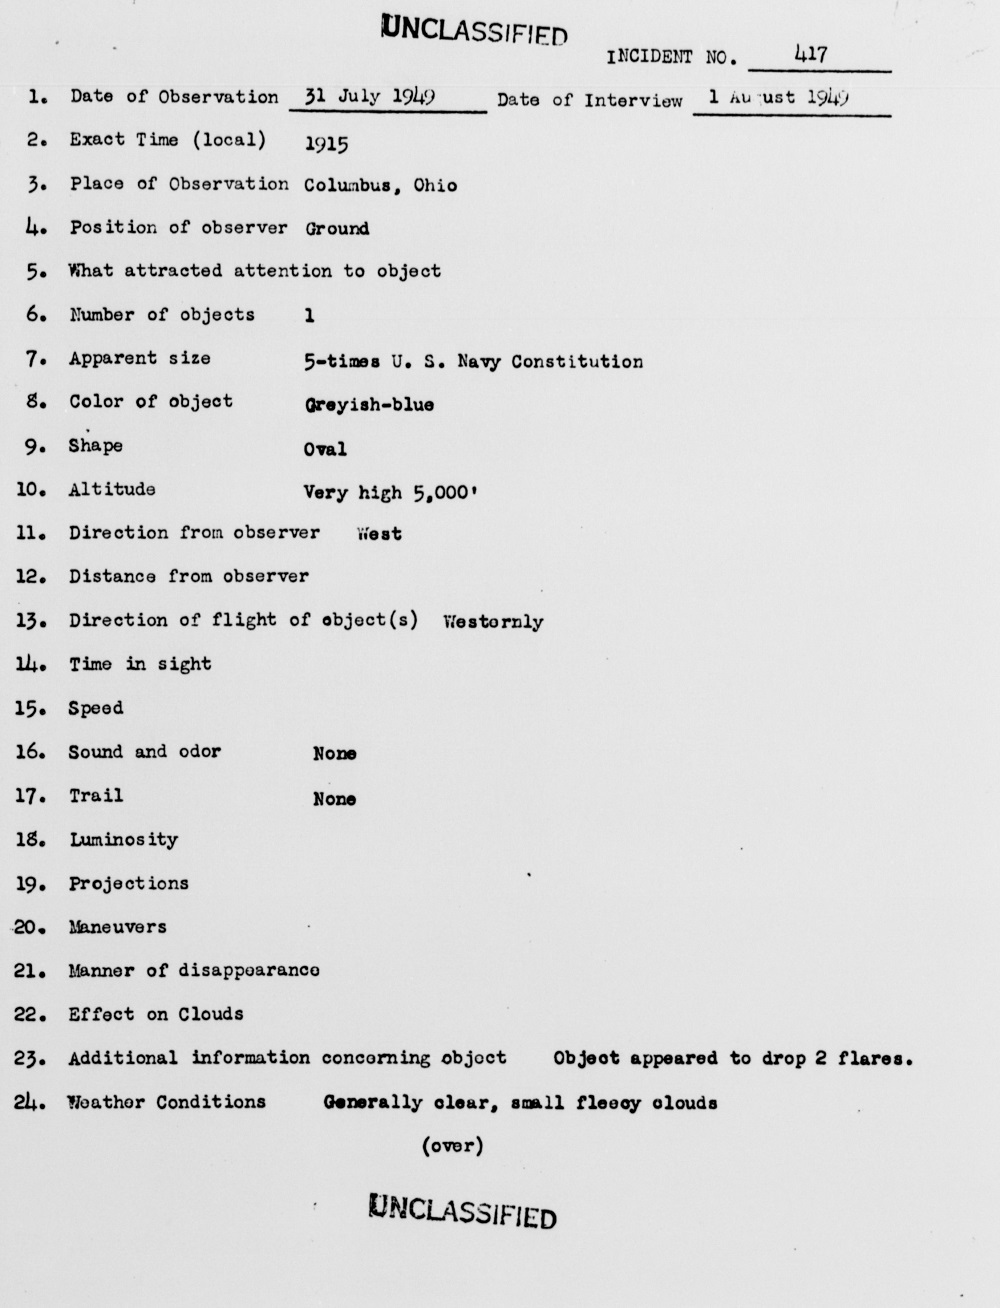
From the files of Project Blue Book, this event had quite a few witnesses, particularly on the East Side of Columbus. The witnesses included local police, and the object was described as “unconventional aircraft”. It was reported by at least two media outlets at the time. Despite the witness accounts, the report concluded it was merely a conventional aircraft.
To view more incidents around the world, visit this link. UFO Database
New 2023 population estimates of Columbus metro places were just released by the US Census. In general, they showed that most places are now recovering from the pandemic population decline blip.
First, the full list of all available population estimates for Columbus metro area incorporated places. This list does not include Census Designated Places, as estimates for those are only done once per decade. Red places have moved down in the rankings, green have moved up.
2023 Population Estimates by Columbus Metro Places
Rank
2020
2023
1
Columbus: 905,939
Columbus: 913,175
2
Newark: 49,948
Newark: 51,046
3
Dublin: 49,313
Dublin: 48,923
4
Delaware: 41,327
Delaware: 45,158
5
Grove City: 41,244
Grove City: 42,782
6
Reynoldsburg: 41,070
Lancaster: 41,422
7
Lancaster: 40,540
Reynoldsburg: 41,220
8
Westerville: 39,194
Westerville: 37,958
9
Hilliard: 37,113
Hilliard: 37,262
10
Upper Arlington: 36,795
Upper Arlington: 35,743
11
Gahanna: 35,726
Gahanna: 35,159
12
Marysville: 25,585
Marysville: 28,423
13
Pickerington: 23,100
Pickerington: 25,256
14
Whitehall: 20,127
Whitehall: 19,727
15
Pataskala: 17,883
Patakala: 18,346
16
Worthington: 14,783
Worthington: 14,497
17
Powell: 14,250
Powell: 14,491
18
Bexley: 13,925
Circleville: 14,452
19
Circleville: 13,925
Bexley: 12,785
20
New Albany: 11,053
New Albany: 11,335
21
Heath: 10,414
Heath: 10,693
22
London: 10,272
London: 10,533
23
Canal Winchester: 9,119
Canal Winchester: 9,777
24
Grandview Heights: 8,085
Grandview Heights: 8,841
25
Logan: 7,292
Sunbury: 8,340
26
Sunbury: 6,610
Logan: 7,166
27
Groveport: 6,009
Obetz: 6,971
28
Granville: 5,950
Granville: 6,281
29
Obetz: 5,483
Groveport: 5,806
30
Johnstown: 5,183
Johnstown: 5,310
31
Ashville: 4,533
Ashville: 4,760
32
New Lexington: 4,430
West Jefferson: 4,488
33
West Jefferson: 4,145
New Lexington: 4,447
34
Plain City: 4,103
Plain City: 4,338
35
Mount Gilead: 3,499
Mount Gilead: 3,533
36
Commercial Point: 3,079
Commercial Point: 3,215
37
Baltimore: 2,980
Baltimore: 2,991
38
Buckeye Lake: 2,516
Lithopolis: 2,708
39
Crooksville: 2,421
South Bloomfield: 2,660
40
Hebron: 2,325
Buckeye Lake: 2,588
41
Richwood: 2,222
Richwood: 2,494
42
South Bloomfield: 2,147
Crooksville: 2,402
43
Lithopolis: 2,142
Hebron: 2,384
44
Cardington: 2,079
Utica: 2,115
45
Utica: 2,067
Cardington: 2,101
46
Minerva Park: 2,012
Mount Sterling: 2,030
47
Mount Sterling: 1,944
Minerva Park: 1,944
48
Roseville: 1,745
Roseville: 1,740
49
Somerset: 1,482
Bremen: 1,502
50
Bremen: 1,478
Somerset: 1,473
51
Hanover: 1,271
Ashley: 1,318
52
Ashley: 1,201
Hanover: 1,317
53
Ostrander: 1,094
Ostrander: 1,197
54
Thornville: 1,083
Thornville: 1,092
55
Urbancrest: 1,031
Galena: 1,018
56
Millersport: 977
Williamsport: 1,012
57
Williamsport: 972
Urbancrest: 996
58
Pleasantville: 943
Millersport: 975
59
Galena: 929
Pleasantville: 951
60
Shawnee Hills: 836
Shawnee Hills: 915
61
Milford Center: 805
Milford Center: 903
62
New Holland: 803
New Holland: 830
63
Junction City: 722
Junction City: 720
64
Amanda: 669
Marble Cliff: 699
65
Valleyview: 668
Amanda: 680
66
New Straitsville: 653
New Straitsville: 651
67
Marble Cliff: 638
Valleyview: 647
68
Thurston: 606
Thurston: 605
69
Riverlea: 596
Stoutsville: 577
70
Stoutsville: 578
Riverlea: 575
71
Buchtel: 519
Buchtel: 513
72
Laurelville: 512
Shawnee: 500
73
Shawnee: 504
Carroll: 500
74
Carroll: 501
Laurelville: 498
75
Corning: 489
Alexandria: 490
76
Alexandria: 481
Corning: 485
77
Kirkersville: 468
Kirkersville: 477
78
Sugar Grove: 427
Edison: 441
79
Edison: 420
Sugar Grove: 425
80
Hartford: 401
Hartford: 404
81
St. Louisville: 351
St. Louisville: 363
82
Murray City: 345
Murray City: 336
83
South Solon: 326
South Solon: 326
84
Harrisburg: 313
Harrisburg: 309
85
Rushville: 306
Rushville: 304
86
Marengo: 280
Magnetic Springs: 293
87
Midway: 269
Marengo: 280
88
Magnetic Springs: 261
Midway: 269
89
Tarlton: 254
Tarlton: 264
90
Fulton: 249
Fulton: 249
91
Unionville Center: 239
Unionville Center: 234
92
Lockbourne: 237
Lockbourne: 229
93
Gratiot: 214
Gratiot: 216
94
Chesterville: 194
Chesterville: 195
95
Darbyville: 185
Darbyville: 189
96
West Rushville: 165
West Rushville: 165
97
Glenford: 165
Glenford: 164
98
Hemlock: 145
Hemlock: 145
99
Sparta: 122
Sparta: 123
100
Brice: 94
Brice: 91
Out of Ohio’s 925 incorporated communities, 660 showed a population loss between 2020-2023, or 71.35%. 27 saw no population change, and 238- or 25.73%- saw population growth. In the Columbus metro, however, 60% of its communities saw growth, with 6% seeing no change and 34% seeing a loss. The Columbus metro places represented just 5.15% of the total communities seeing loss within the state, but 25.73% of all the communities seeing growth. This shows just how poorly most of the state is doing in comparison to the Columbus area.