Today’s Spring 2021 weather review shows that the season represented a significant departure from other recent years in that it was drier than average. In fact, there were fewer measurable precipitation days during the season than any other spring since 1879. Snowfall was also well below normal aside from a rare late April event. Temperatures swung wildly, with highs generally well above normal and lows slightly below normal.
1991-2020 Spring Normals Average High: 63.1 Average Low: 42.2 Mean: 52.7 Precipitation: 11.46″ Snowfall: 4.6″
2021 March-May Average High: 65.2 9th Warmest Average Low: 42.0 Tied for 29th Warmest Mean: 53.6 +0.9 20th Warmest Precipitation: 9.59″ 62nd Driest Snowfall: 1.2″ Ties for 12th Least Snowiest Average Daily Snow Depth: 0.0″ Largest Snowstorm: 1.2″ on April 21st # of 32 or Below Highs: 0 Tied for 1st Fewest # of 32 or Below Lows: 20 Tied for 12th Fewest # of 80 or Above Highs: 14 Tied for 12th Most # of 70 or Above Lows: 0 Tied for 1st Fewest # of Measurable Precipitation Days: 27 1st Fewest on Record # of Measurable Snowfall Days: 1 Tied for 2nd Fewest
Average High By Month March 2021: 59.0 7th Warmest April 2021: 64.4 Tied for 29th Warmest May 2021: 72.1 Tied for 44th Coldest
Average Low By Month March 2021: 34.7 27th Warmest April 2021: 42.0 Tied for 35th Warmest May 2021: 49.2 27th Coldest
Mean By Month March 2021: 46.9 12th Warmest April 2021: 53.2 Tied for 28th Warmest May 2021: 60.6 Tied for 32nd Coldest
Precipitation By Month March 2021: 2.85″ 54th Driest April 2021: 3.28″ 60th Wettest May 2021: 3.46″ 61st Driest
Snowfall By Month March 2021: 0.0″ Tied for Least Snowy April 2021: 1.2″ 14th Least Snowy May 2021: 0.0″ Tied for Least Snowy- Only a handful of years have had a trace or more of snow in May.
Average Snow Depth By Month March 2021: 0.0″ April 2021: 0.0″ May 2021: 0.0″
Maximum High By Month March 2021: 75 on the 24th April 2021: 83 on the 27th May 2021: 91 on the 25th
Minimum High By Month March 2021: 40 on the 15th April 2021: 37 o the 1st Mays 2021: 51 on the 9th
Maximum Low By Month March 2021: 56 on the 11th April 2021: 65 on the 28th May 2021: 69 on the 24th
Maximum Low Records -The 65 on April 28th tied the record for the date with 1914.
Minimum Low By Month March 2021: 19 on the 5th April 2021: 21 on the 2nd May 2021: 34 on the 1st
Highest Daily Precipitation By Month March 2021: 1.12″ on the 18th April 2021: 1.88″ on the 29th May 2021: 1.43″ on the 9th
Precipitation Records -The 1.88″ on April 29th was a record for the date, beating the old record of 1.82″ set in 1996. -The 1.43″ on May 9th was a record for the date, beating the old record of 1.12″ set in 1909.
Highest Daily Snowfall By Month March 2021: 0.0″ April 2021: 1.2″ on the 21st May 2021: 0.0″
Deepest Snow Depth By Month March 2021: 0.0″ April 2021: 1″ on the 21st May 2021: 0.0″
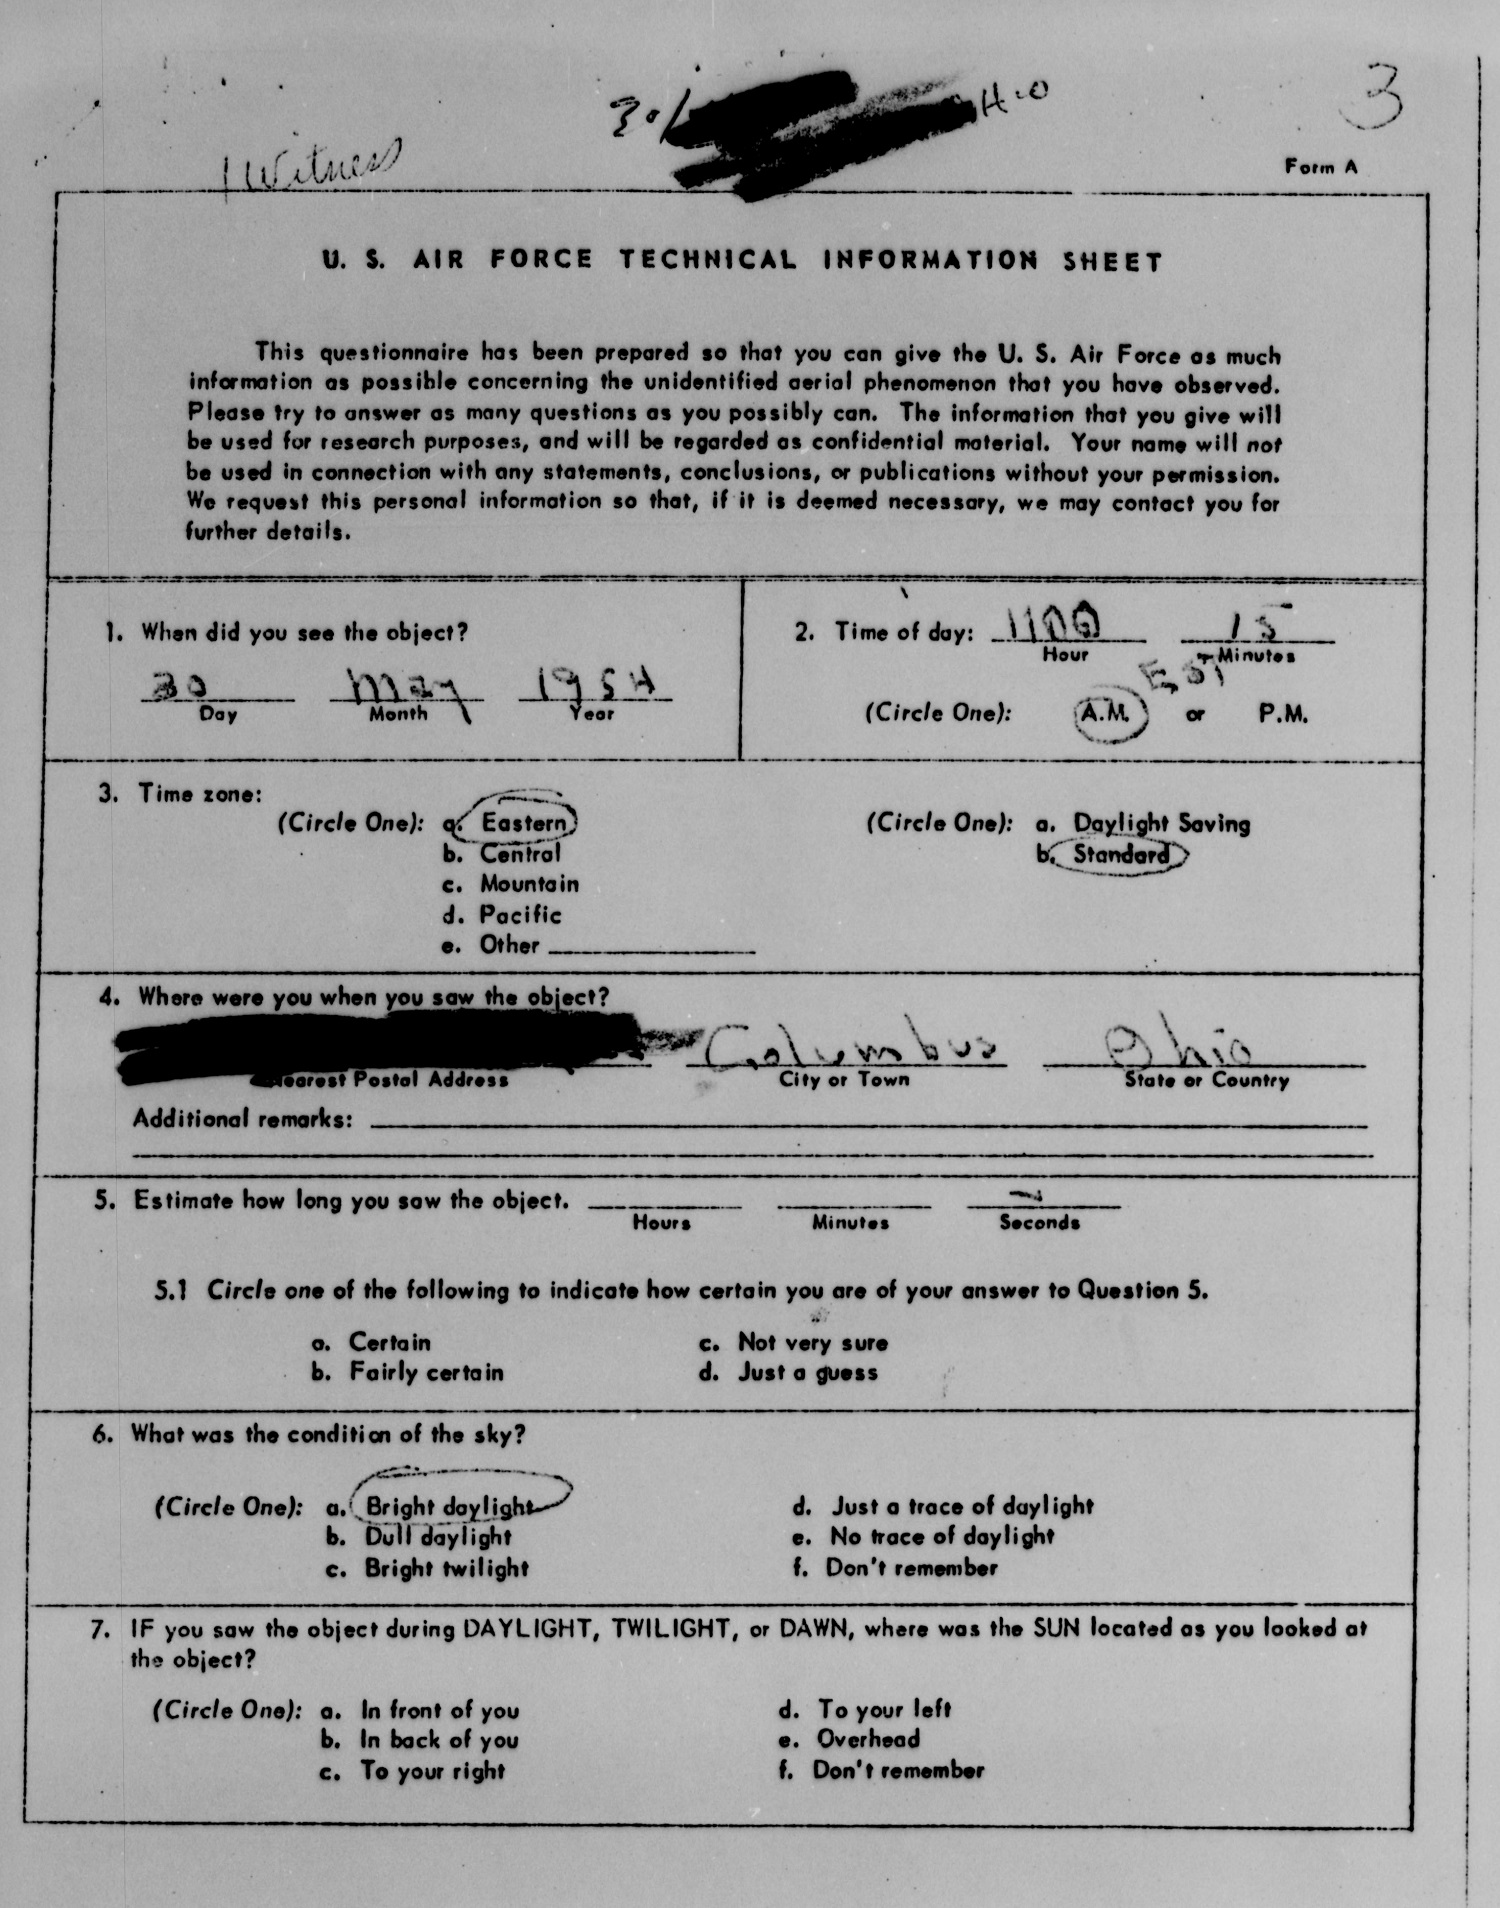
UFOs are kind of a hot topic right now. The US government has recently been releasing videos and documentation on what they acknowledge they can’t explain. The releases have begun to gain mainstream media attention, including a recent 60 Minutes report. The Pentagon is currently preparing a report to release to Congress sometime in June on these events, the contents of which could either be mundane or extraordinary. Is it a new technology from a foreign adversary? Optical illusions or natural events? Or something altogether far weirder? In the spirit of these recent news events, I thought it’d be interesting to go over some of the UFO sightings in and around Columbus over the years. This new series, Strange Columbus Things, will also highlight other types of weird local phenomenon throughout history. I hope to give a new post in this series 1-2 times per month.
The UFO events come from declassified files of the infamous Project Blue Book, which ran from the late 1940s to 1969. For the most part, the Blue Book files will just be scanned photos of the actual reports, with only occasional commentary.
This event was never explained due to a lack of information.
To view other information on global incidents, go here. UFO Database
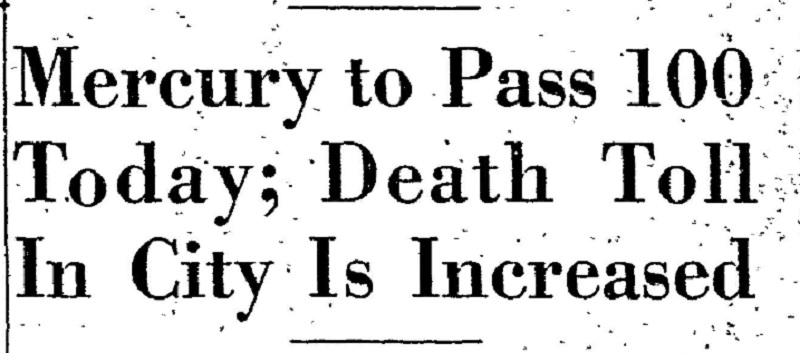
What are the worst heat waves in history? The climate in Ohio is gradually getting warmer and wetter, and persistent record heat is becoming ever more common, but do recent heatwaves compare to those of the past? Let’s find out.
To find out what the worst heatwaves were, I looked at average temperatures for different consecutive time periods- 2 days, 3 days, 7 days, 10 days, 14 days and 30 days. Unsurprisingly, some historically hot summers popped up, particularly from the 1930s.
Top 10 2-Day Periods with the Warmest Average High Temperature 1. 7/21-7/22/1934: 104.5 2. 7/20-7/21/1934, 7/8-7/9/1936, 7/11-7/12/1936, 7/13-7/14/1936: 103.5 3. 7/24-7/25/1934, 7/25-7/26/1934, 7/9-7/10/1936: 103.0 4. 7/3-7/4/1911, 8/5-8/6/1918, 7/10-7/11/1936: 102.5 5. 7/9-7/10/1881, 7/12-7/13/1936: 102.0 6. 7/3-7/4/1897, 7/21-7/22/1901, 6/27-6/28/1944: 101.5 7. 7/6-7/7/2012: 101.0 8. 7/8-7/9/1881, 7/4-7/5/1911, 6/28-6/29/1934, 7/14-7/15/1936: 100.5 9. 7/7-7/8/1881, 8/6-8/7/1918, 7/20-7/21/1930, 7/26-7/27/1941, 7/7-7/8/1988, 7/8-7/9/1988, 7/15-7/16/1988: 100.0 10. 7/10-7/11/1881, 7/17-7/18/1887, 7/2-7/3/1911, 8/4-8/5/1918, 7/19-7/20/1930, 7/26-7/27/1936, 9/1-9/2/1953, 9/2-9/3/1953, 7/13-7/14/1954, 8/3-8/4/1955, 7/5-7/6/2012: 99.5
Top 10 3-Day Periods with the Warmest Average High Temperature 1. 7/20-7/22/1934, 7/9-7/11/1936, 7/12-7/14/1936: 103.3 2. 7/24-7/26/1934, 7/8-7/10/1936, 7/10-7/12/1936, 7/11-7/13/1936: 102.7 3. 7/8-7/10/1881: 101.3 4. 7/2-7/4/1911, 8/5-8/7/1918, 7/21-7/23/1934, 7/7-7/9/1936: 101.0 5. 7/3-7/5/1911, 7/13-7/15/1936: 100.7 6. 7/7-7/9/1881, 7/10-7/12/1881, 8/4-8/6/1918: 100.3 7. 7/9-7/11/1881, 7/23-7/25/1934, 7/7-7/9/1988, 7/5-7/7/2012: 100.0 8. 7/3-7/5/1897, 7/19-7/21/1934, 7/22-7/24/1934, 7/4-7/6/2012: 99.7 9. 7/6-7/8/1881, 7/19-7/21/1930, 9/1-9/3/1953: 99.3 10. 7/26-7/28/1941, 6/26-6/28/1944, 8/30-9/1/1953, 8/31-9/2/1953, 8/2-8/4/1955, 7/6-7/8/1988: 99.0
Top 10 7-Day Periods with the Warmest Average High Temperature 1. 7/8-7/14/1936: 103.1 2. 7/9-7/15/1936: 102.1 3. 7/20-7/26/1934, 7/7-7/13/1936: 101.7 4. 7/10-7/16/1936: 100.7 5. 7/19-7/25/1934, 7/11-7/17/1936: 100.3 6. 7/6-7/12/1881, 7/6-7/12/1936: 100.0 7. 7/21-7/27/1934: 99.4 8. 7/7-7/13/1881: 99.1 9. 7/5-7/11/1881: 99.0 10. 7/4-7/10/1881, 8/28-9/3/1953: 98.6
Top 10 10-Day Periods with the Warmest Average High Temperature 1. 7/8-7/17/1936: 101.0 2. 7/7-7/16/1936: 100.8 3. 7/6-7/15/1936: 100.2 4. 7/9-7/18/196: 99.8 5. 7/5-7/14/1936: 99.2 6. 7/4-7/13/1881: 98.0 7. 7/10-7/19/1936: 97.9 8. 7/3-7/12/1881: 97.8 9. 7/5-7/14/1881, 7/17-7/26/1934, 7/18-7/27/1934, 7/19-7/28/1934: 97.7 10. 7/6-7/15/1881: 97.4
Top 10 14-Day Periods with the Warmest Average High Temperature 1. 7/5-7/18/1936, 7/6-7/19/1936: 97.9 2. 7/4-7/17/1936: 97.6 3. 7/7-7/20/1936: 97.5 4. 7/3-7/16/1936: 97.1 5. 7/8-7/21/1936: 96.5 6. 7/2-7/15/1936: 96.0 7. 7/2-7/15/1881, 7/4-7/17/1881, 7/9-7/22/1936: 95.6 8. 7/13-7/26/1934: 95.5 9. 7/14-7/27/1934, 7/15-7/28/1934, 7/1-7/14/1936: 95.4 10. 7/16-7/29/1901, 7/17-7/30/1901: 95.1
Top 10 30-Day Periods with the Warmest Average High Temperature 1. 6/29-7/28/1936: 92.7 2. 6/28-7/27/1936: 92.6 3. 6/27-7/26/1934: 92.5 4. 6/26-7/25/1934, 6/30-7/29/1936: 92.3 5. 6/28-7/27/1934: 92.2 6. 7/6-8/4/1936, 7/13-8/11/1955: 92.1 7. 7/10-8/8/1955, 6/28-7/27/2012: 92.0 8. 6/25-7/24/1934, 6/27-7/26/1936, 7/1-7/30/1936, 7/2-7/31/1936, 7/5-8/3/1936, 7/7-8/5/1936, 7/14-8/12/1955, 6/27-7/26/2012: 91.9 9. 6/29-7/28/1934, 6/26-7/25/1936, 7/3-8/1/1936, 7/4-8/2/1936, 7/8-8/6/1955, 7/9-8/7/1955, 6/18-7/17/2012, 6/20-7/19/2012: 91.8 1. 6/25-7/24/1936, 7/23-8/21/1955: 91.7
The heat waves in 1934 and 1936 dominated for high temperatures, and for the most part, nothing before or since has really come close. 1881, 1901, 1918, 1955 and 2012, among others, all make appearances.
Now that we’ve see the worst periods for high temperature, let’s look at the worst for the mean temperature, which is the average between the high and low. Because this measurement includes the low temperatures, it could be considered the definitive look at what the absolute hottest heat waves in history really were.
Top 10 2-Day Periods with the Warmest Average Temperature 1. 7/21-7/22/1934: 92.0 2. 7/9-7/10/1881: 91.5 3. 7/9-7/10/1936: 90.5 4. 7/20-7/21/1934: 90.3 5. 7/25-7/26/1934, 7/13-7/14/1936: 90.0 6. 7/10-7/11/1881, 7/3-7/4/1911: 89.8 7. 8/5-8/6/1918, 7/20-7/21/1930: 89.3 8. 7/10-7/11/1936: 89.0 9. 7/4-7/5/1911, 7/24-7/25/1934, 7/12-7/13/1936, 7/30-7/31/1999: 88.8 10. 7/11-7/12/1881, 8/6-8/7/1918, 7/8-7/9/1936, 7/11-7/12/1936: 88.5
Top 10 3-Days Periods with the Warmest Average Temperature 1. 7/20-7/22/1934: 90.5 2. 7/8-7/10/1881: 90.3 3. 7/9-7/11/1881: 90.0 4. 7/10-7/12/1881, 7/9-7/11/1936: 89.8 5. 7/12-7/14/1936: 89.5 6. 7/21-7/23/1934: 89.3 7. 7/7-7/9/1881: 89.0 8. 8/5-8/7/1918, 7/24-7/26/1934, 7/8-7/10/1936, 7/10-7/12/1936: 88.8 9. 7/11-7/13/1936: 88.7 10. 7/3-7/5/1911, 7/13-7/15/1936: 88.5
Top 10 7-Day Periods with the Warmest Average Temperature 1. 7/8-7/14/1936, 7/9-7/15/1936: 89.1 2. 7/6-7/12/1881: 89.0 3. 7/20-7/26/1934: 88.9 4. 7/7-7/13/1881: 88.6 5. 7/5-7/11/1881, 7/10-7/16/1936: 87.9 6. 7/19-7/25/1934: 87.7 7. 7/8-7/14/1881: 87.6 8. 7/21-7/27/1934: 87.5 9. 7/7-7/13/1936: 87.4 10. 7/4-7/10/1881: 86.9
Top 10 10-Day Periods with the Warmest Average Temperature 1. 7/8-7/17/1936: 87.4 2. 7/7-7/16/1936: 87.2 3. 7/5-7/14/1881, 7/6-7/15/1881, 7/9-7/18/1936: 87.1 4. 7/4-7/13/1881: 86.9 5. 7/6-7/15/1936, 7/7-7/16/1881: 86.6 6. 7/3-7/12/1881: 86.2 7. 7/19-7/28/1934: 86.0 8. 7/18-7/27/1934, 7/10-7/19/1936: 85.7 9. 7/20-7/29/1934, 7/5-7/14/1936: 85.6 10. 7/8-7/17/1881, 7/17-7/26/1934: 85.4
Top 10 14-Day Periods with the Warmest Average Temperature 1. 7/3-7/16/1881, 7/4-7/17/1881: 85.1 2. 7/6-7/19/1936: 85.0 3. 7/5-7/18/1936: 84.9 4. 7/7-7/20/1936: 84.6 5. 7/2-7/15/1881, 7/5-7/18/1881, 7/4-7/17/1936: 84.5 6. 7/3-7/16/1936: 84.3 7. 7/6-7/19/1881, 7/8-7/21/1936, 7/18-7/31/1940: 83.9 8. 7/13-7/26/1934, 7/14-7/27/1934, 7/15-7/28/1934: 83.8 9. 7/2-7/15/1936: 83.7 10. 7/1-7/14/1881: 83.6
1934 and 1936 still dominate, but other years show up more often as well. Only 2012 shows up with anything in the last 60 years, though. That year also saw one of the worst wind events in Ohio history, partially fueled by the heat of that summer: North American Derecho of 2012
Finally, let’s look at periods that featured consecutive days with highs of 90 degrees or higher. What are the longest?
# of Consecutive Days with Highs 90 or Above 1. 7/3-7/16/1881: 14 2. 7/18-7/30/1940: 13 3. 6/24-7/5/1934, 7/7-7/18/1936, 6/28-7/9/1949, 7/21-8/1/1999, 6/29-7/10/2020: 12 4. 7/20-7/30/1901, 8/4-8/14/1918, 8/25-9/4/1953, 8/8-8/18/1988, 6/28-7/8/2012: 11 5. 7/27-8/5/1887, 9/7-9/16/1897, 7/29-8/7/1955, 6/13-6/22/1994: 10
A short video and article from 2016 about the 1936 heatwave, still the hottest in history. 1936 Heat Wave
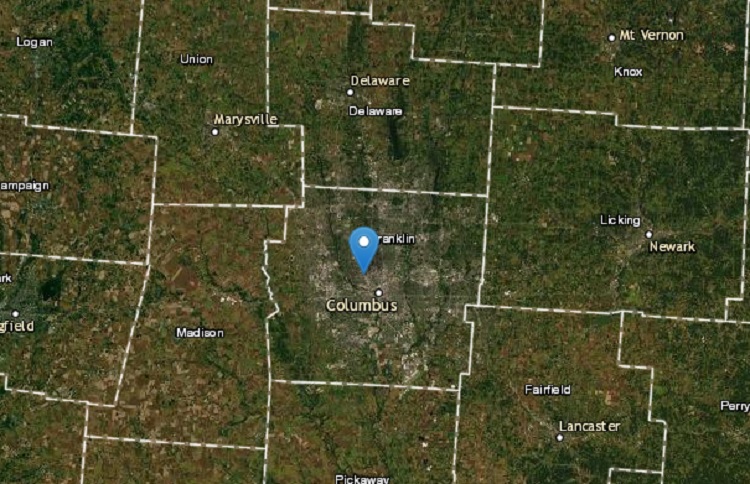
This program from the United States Geological Survey website, EarthExplorer, allows users to search information on both geological and manmade features across both the US and rest of the world. Just about every possible feature is available, from zip codes to cemeteries, bridges to waterfalls, military sites and oil fields.
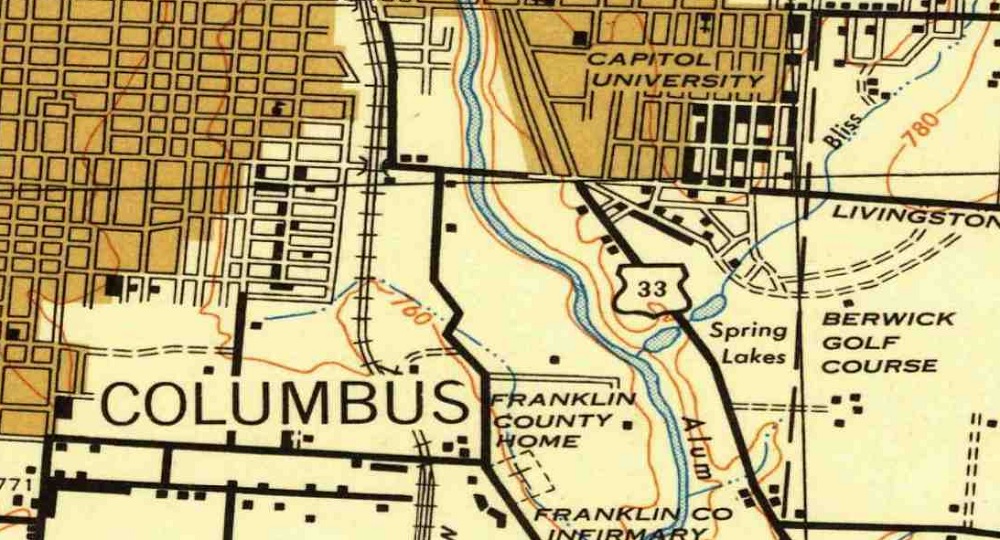
This link is a great resource to find old local maps for cities, counties and states from the US to around the world. For Columbus, maps go back to the 1920s, but other locations have even older versions. The maps are helpful for those doing research on this history of their cities.
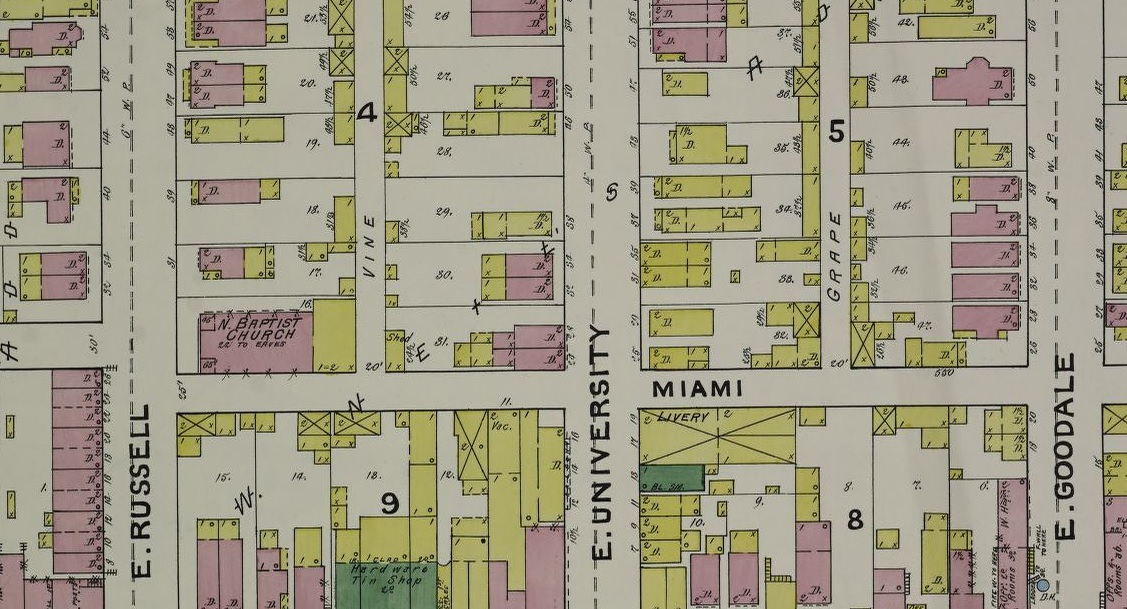
Another favorite link is the Sanborn Fire Insurance Maps. These maps are even more detailed and you can view individual buildings down to the street level back to the 19th Century. These maps are available at the Library of Congress and require a bit more searching to find what you’re looking for.