Winter 2024-2025 was the 4th season in a row in which snowfall was well below normal. Only a single winter in the past 10- 2017-2018- has had above normal snowfall, and only just. Two others- 2018-2019 and 2020-2021- had near normal snowfall, though still slightly below the 30-year average, and the other 7 have been significantly below normal. Average winter snowfall for the past decade has been just 17.8″, more than 10″ below the 1991-2020 average. Additionally, the 2024-2025 season lacked a 6″ snowfall, either daily or in any single event. There has been no 6″ snowfall since February 22, 2015, the second longest such period since records began.
The December-February period was colder than normal, and it was the coldest heart of winter since 2014-2015. This was thanks largely to January, which also featured the majority of the season’s snowfall.
December-February
Traditional winter numbers, 1991-2020 departures from normal where relevant, and overall winter rankings.
Rankings are accurate as of the time of the post.
Average High: 38.1 (-1.7) 44th Coldest
Average Low: 23.6 (-0.9) 45th Coldest
Mean: 30.8 (-1.4) Tied for 39th Coldest
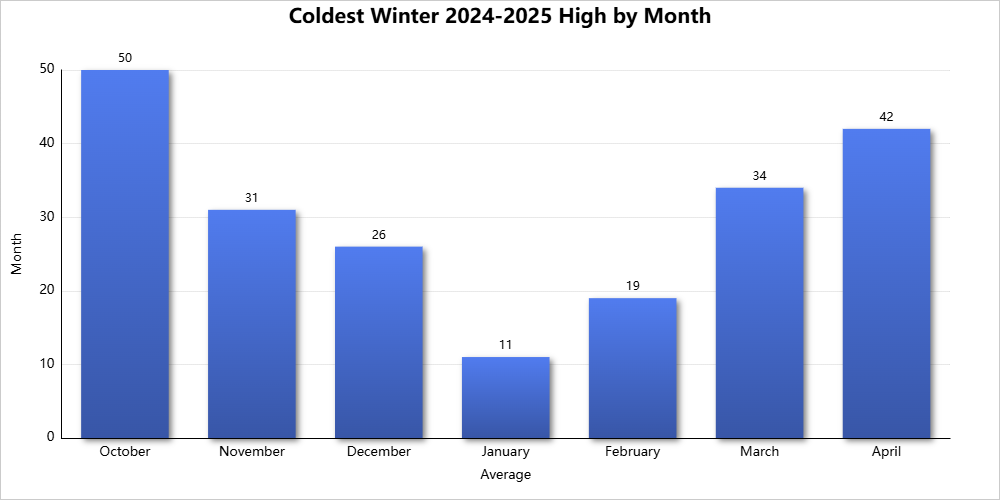
Coldest High: 11 on January 20th
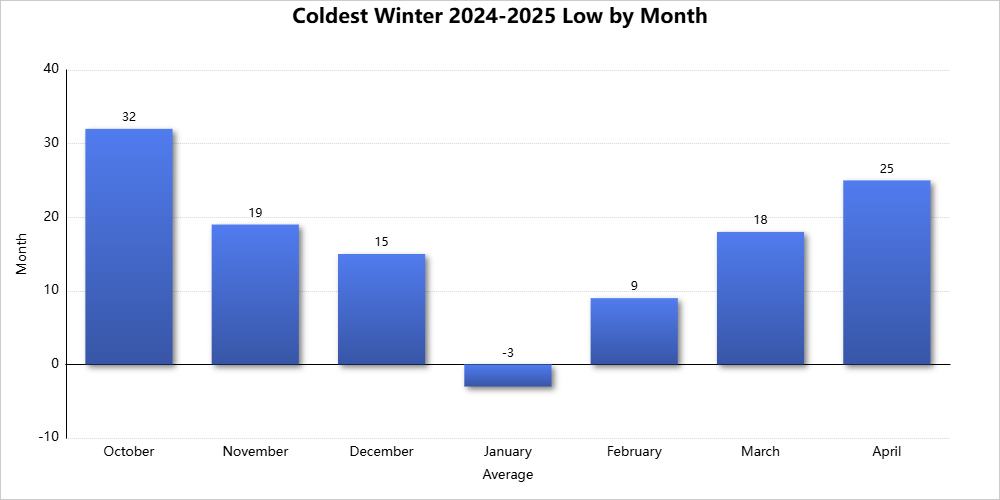
Coldest Low: -3 on January 22nd
Coldest Mean: 5.5 on January 21st
# of 32 or Below Highs: 29 (+3.2) 21st Most
# of 32 or Below Lows: 72 (+3.2) 17th Most
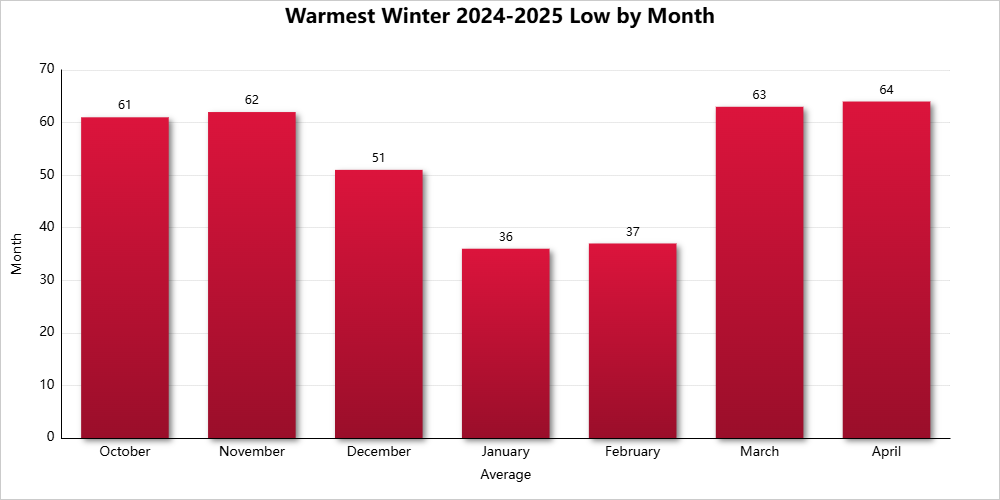
Warmest High: 65 on February 3rd
Warmest Low: 51 on December 28th
Warmest Mean: 57 on December 28th
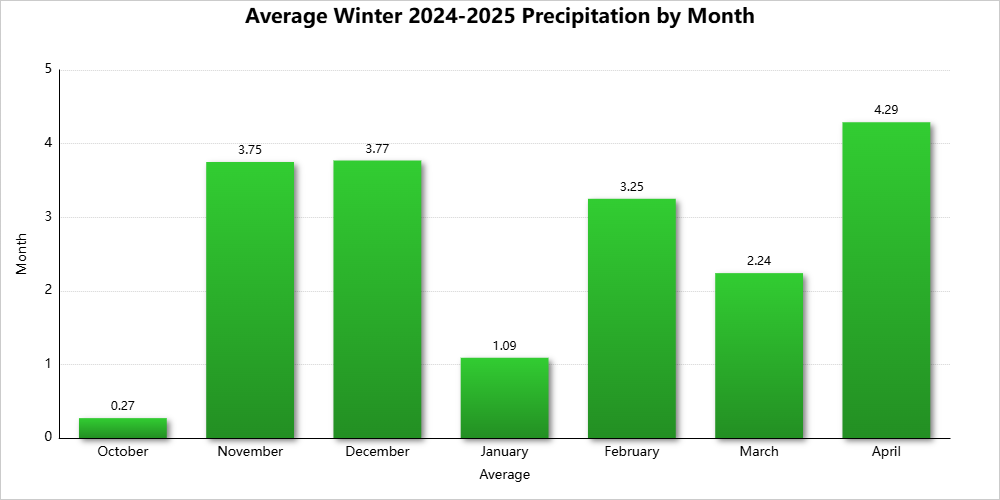
Precipitation: 8.11″ (-0.43″) 59th Wettest
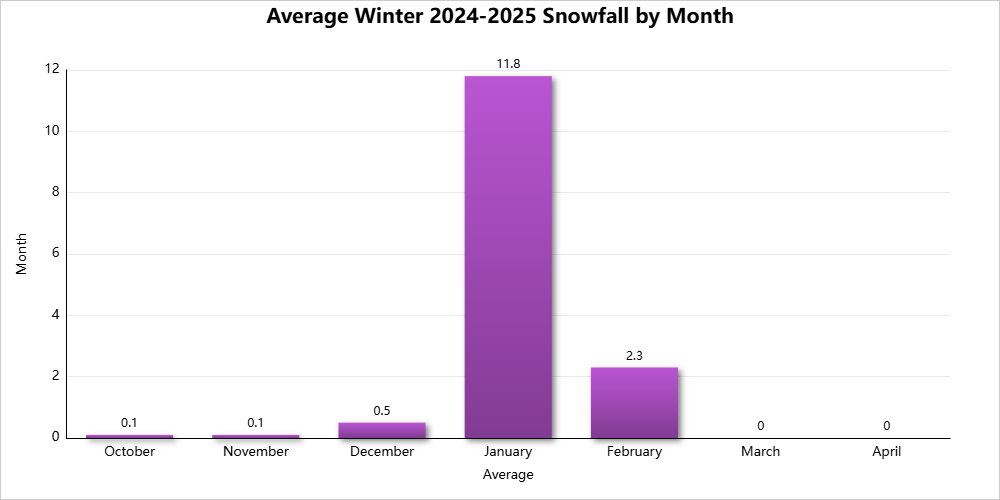
Snowfall: 14.6″ (-13.6″) 46th Least Snowy
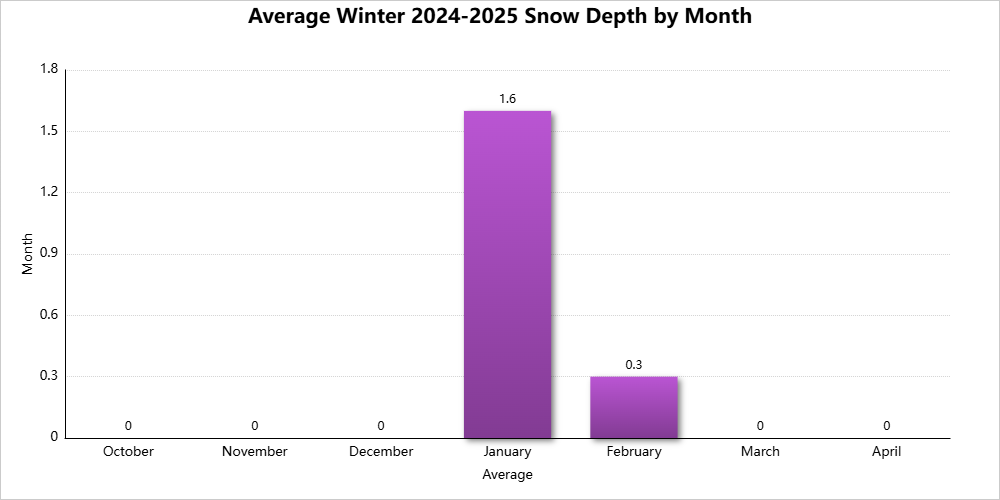
Average Daily Snow Depth: 0.6″ (-0.2″) Tied for 7th Lowest
Maximum Snow Depth: 5″ on January 6th and 11th.
Largest Snowstorm: 4.4″ on January 5th-6th.
1″+ Snowfall Events: 7 Tied for 8th Fewest
# of Measurable Precipitation Days: 37 (-2.1) Tied for 13th Fewest
# of Measurable Snowfall Days: 15 (-6.4) Tied for 11th Fewest
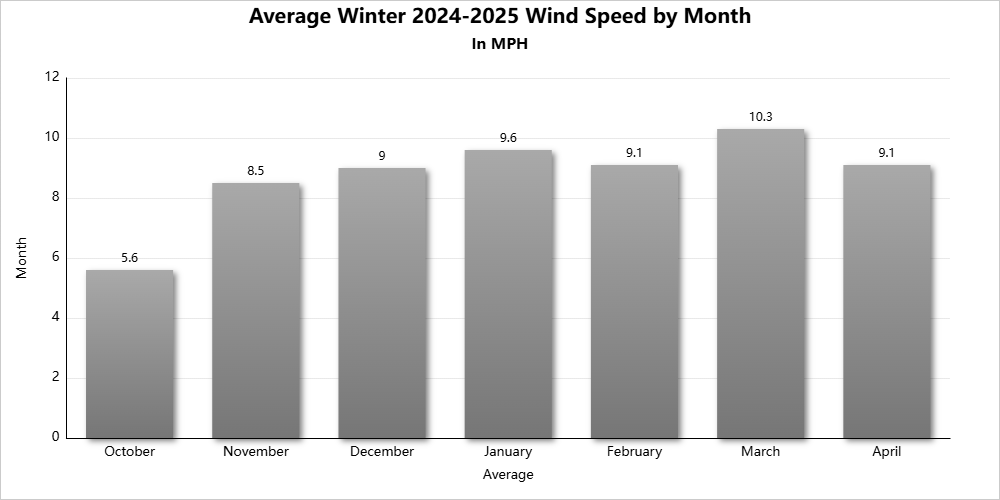
Highest Average Daily Wind Speed in MPH: 19.2 on December 5th
Highest Wind Gust in MPH: 55 on December 5th
# of Clear Days: 4 4.44%
# of Partly Cloudy Days: 39 43.33%
# of Cloudy Days: 47 52.23%
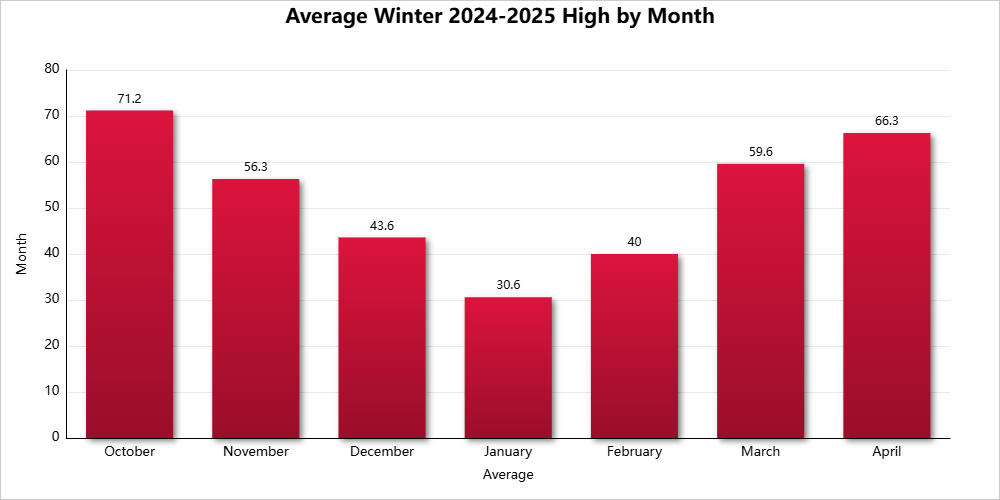
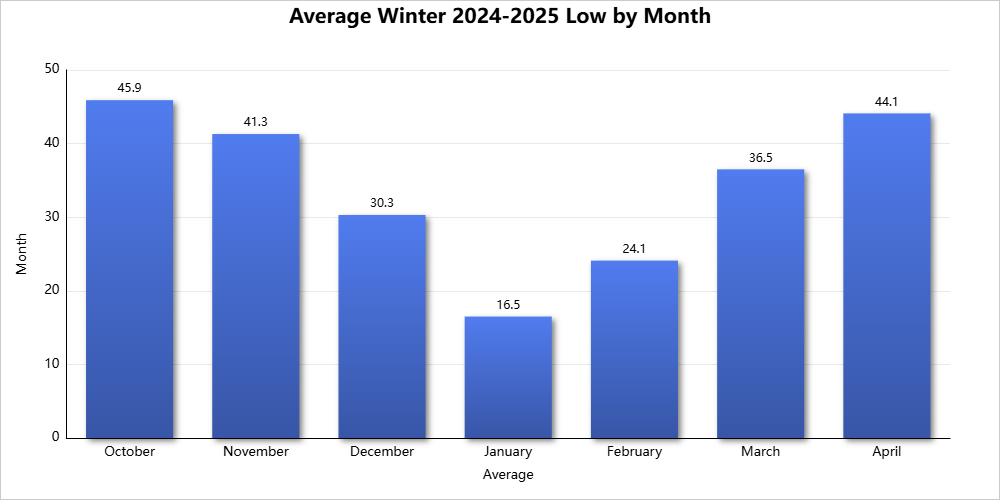
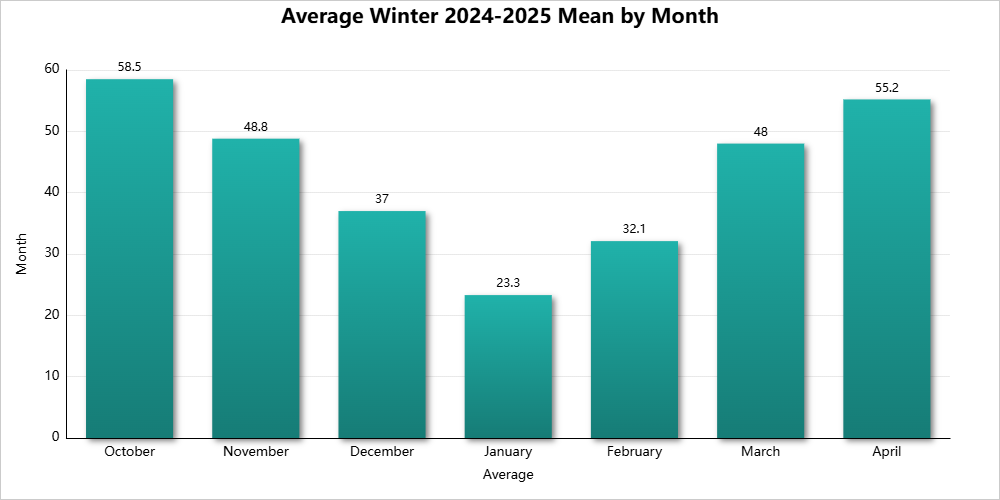
Entire Cold Season: October-April
Average High: 52.7 9th Warmest
Average Low: 34.1 18th Warmest
Mean: 43.4 9th Warmest
Precipitation: 18.66″ 56th Wettest
Snowfall: 14.8″ 29th Least Snowy
Average Snow Depth: 0.3″ Tied for 4th Lowest
Largest Snowstorm: 4.4″ on January 5th-6th
# of 32 or Below Highs: 30 Tied for 21st Fewest
# of 32 or Below Lows: 96 Tied for 17th Fewest
# of Measurable Precipitation Days: 74 Tied for 9th Fewest
# of Measurable Snowfall Days: 17 Tied for 8th Fewest
Highest Average Daily Wind Speed in MPH: 19.2 on December 5th
Highest Wind Gust in MPH: 59 on April 29th
# of Clear Days: 34 16.04%
# of Partly Cloudy Days: 90 42.45%
# of Cloudy Days: 88 41.51%
High Temperature Records Set
11/1/2024- A record warm high of 78 was set for the date, breaking the old record of 77 set in 2022.
11/5/2024- A record warm high of 79 was set for the date, breaking the old record of 77 set in 2022.
2/3/2025- A record warm high of 65 was set for the date, breaking the old record of 63 set in 1890.
3/14/2025- A record warm high of 79 was set for the date, breaking the old record of 78 set in 1990.
Low Temperature Records Set
10/30/2024- A record warm low of 59 degrees was tied for the date, matching the previous record set in 2004.
11/5/2024- A record warm low of 62 was tied for the date, matching the old record set in 2022.
3/29/2025- A record warm low of 63 was set for the date, breaking the old record of 59 set in 1977.
Precipitation Records Set
None set.
Snowfall Records Set
10/15/2024- A record 0.1″ of snowfall occurred for the date. It was the first recorded instance of measurable snowfall for the date.
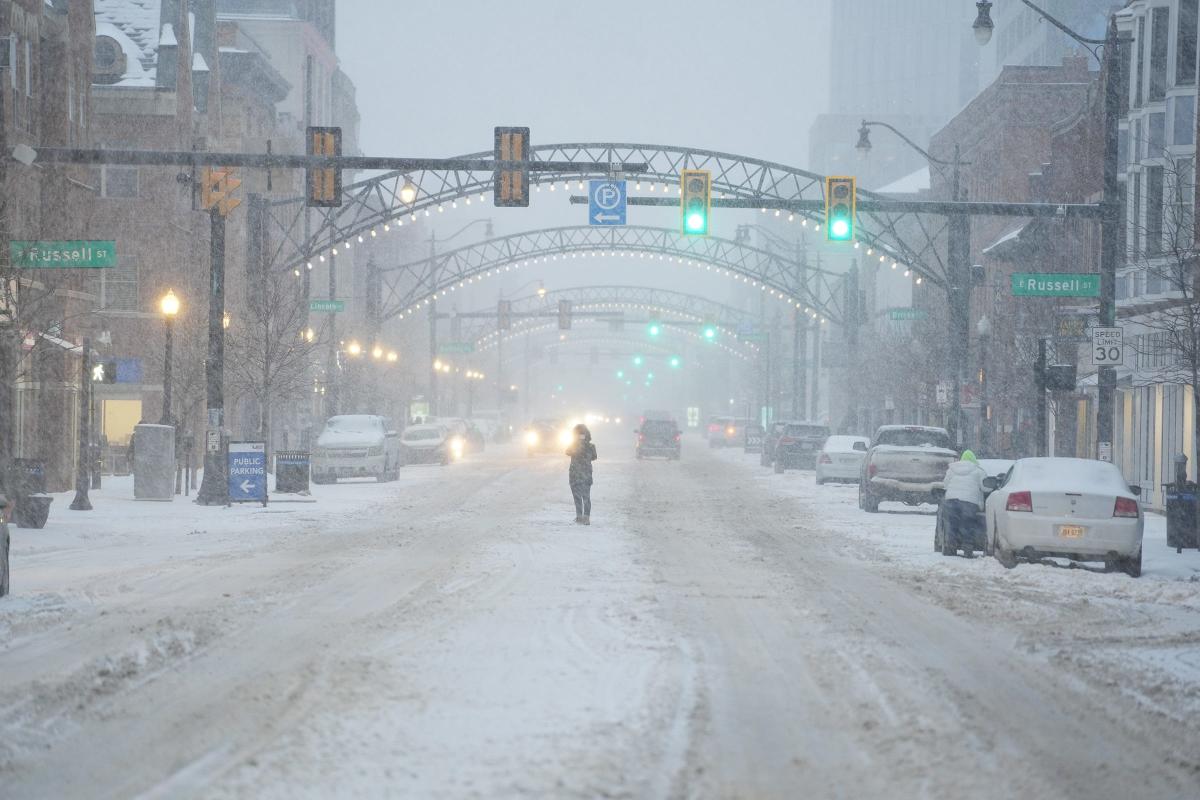
Forecast for what would be Columbus’ largest snowfall of the season.
Highest Daily Precipitation by Month
October 2024: 0.12″ on the 15th
November 2024: 0.97″ on the 14th
December 2024: 1.03″ on the 29th
January 2025: 0.24″ on the 18th
February 2025: 1.15″ on the 16th
March 2025: 0.65″ on the 30th
April 2025: 1.88″ on the 3rd
Highest Daily Snowfall By Month
October 2024: 0.1″ on the 15th
November 2024: 0.1″ on the 21st
December 2024: 0.3″ on the 11th
January 2025: 2.4″ on the 6th
February 2025: 1.9″ on the 16th
March 2025: Trace on multiple days.
April 2025: Trace on the 6th and 7th
Deepest Snow Depth By Month
October 2024: 0″ on all days.
November 2024: Trace on the 29th
December 2024: Trace on the 12th and 13th
January 2025: 5″ on the 6th and 11th
February 2025: 2″ on the 17th and 18th
March 2025: Trace on the 17th
April 2025: 0″ on all days.
Highest Wind Gust by Month in MPH
October 2024: 46 on the 13th
November 2024: 43 on the 20th
December 2024: 55 on the 5th
January 2025: 38 on the 16th
February 2025: 43 on the 28th
March 2025: 53 on the 30th
April 2025: 59 on the 29th
Clear Days by Month
October 2024: 18 58.06%
November 2024: 3 10.0%
December 2024: 0 0.0%
January 2025: 3 9.68%
February 2025: 1 3.57%
March 2025: 4 12.9%
April 2025: 5 16.67%
Partly Cloudy Days by Month
October 2024: 12 38.71%
November 2024: 11 36.67%
December 2024: 12 38.71%
January 2025: 13 41.94%
February 2025: 14 50.0%
March 2025: 17 54.84%
April 2025: 11 36.66%
Cloudy Days by Month
October 2024: 1 3.23%
November 2024: 16 53.33%
December 2024: 19 61.29%
January 2025: 15 48.39%
February 2025: 13 46.43%
March 2025: 10 32.26%
April 2025: 14 46.67%