The US Census has released 2024 city population estimates. These estimates are for all incorporated places.
First, let’s look at the top 25 largest Ohio cities on July 1, 2024. Purple cities moved up in the ranking since 2020 and red moved down.
Rank
City
2020
2023
2024
1
Columbus
905,939
920,569
933,263
2
Cleveland
372,626
364,276
365,379
3
Cincinnati
309,561
312,703
314,915
4
Toledo
270,877
265,798
265,638
5
Akron
190,408
189,142
189,664
6
Dayton
137,677
135,936
136,346
7
Parma
81,121
79,310
79,,350
8
Canton
70,743
69,230
69,211
9
Lorain
65,218
65,413
65,751
10
Hamilton
63,393
63,516
63,953
11
Youngstown
60,047
59,195
59,123
12
Springfield
58,644
58,041
58,138
13
Kettering
57,860
57,035
57,028
14
Elyria
52,668
53,181
53,604
15
Middletown
50,986
51,882
52,291
16
Newark
49,970
51,162
51,424
17
Cuyahoga Falls
51,116
50,865
50,979
18
Lakewood
50,940
49,564
49,517
19
Dublin
49,315
49,292
49,456
20
Euclid
49,689
48,439
48,421
21
Beavercreek
46,562
47,327
48,012
22
Mansfield
47,530
47,676
47,593
23
Mentor
47,442
47,000
47,113
24
Delaware
41,327
45,364
46,521
25
Strongsville
46,487
45,719
45,768
Columbus gained 12,694 residents July 1, 2023 to July 1, 2024. This was the 14th highest numeric change of all US cities at or above 20,000 in population. In doing so, it became Ohio’s all-time largest city by population in history, surpassing Cleveland’s historic high of 914,80 in 1950.
90% of Columbus metro places were either steady or saw outright growth 2023-2024. These numbers are much improved from the Covid era where many places were seeing population declines, especially the larger cities and suburbs.
Columbus’ growth represented 73% of Franklin County’s total growth 2023-2024 and 84.1% of the county’s growth 2020-2024. Additionally, Columbus alone repesented 41.8% of the metro’s growth 2023-2024 and 31.6% of the metro’s growth 2020-2024.
Over the years, I’ve learned that Columbus has a very suburban reputation, meaning that it is perceived to have very low density throughout, especially because it aggressively annexed suburban areas into the city limits decades ago. With those claims, I wondered what the metro population densities would be if Columbus’ area size was scaled down to others, with the goal of finding out if it really deserves the suburban reputation. Bare with me, because there is a lot to look at.
First, I used Columbus’ 18 peer metros (population 1.5-2.5 million) per the Census, as well as the 14 largest Midwest metros. Since there was some overlap in the 2 groups, it made for a total group comparison of 27. So a fairly sizeable group. Next, I used the mile marker population, which in the City Hall census analysis is made up of circles going out from the center. So it’s just a matter of finding the area of each circle and dividing the population into that. What’s left is the density by area.
Density at Mile Marker 3, with an Area of 28.27 Square Miles 2000————————————2010 1. Chicago: 17,528.7_____________________ 1. Chicago: 18,003.2 2. San Jose, CA: 13,883.0________________ 2. San Jose, CA: 14,549.2 3. Las Vegas: 11,646.0___________________ 3. Las Vegas: 11,576.2 4. Minneapolis: 11,494.2_________________ 4. Minneapolis: 11,503.3 5. Milwaukee: 11,448.9___________________ 5. Milwaukee: 11,288.0 6. Providence: 11,173.7__________________ 6. Providence, RI: 11,240.2 7. Pittsburgh: 10,594.4__________________ 7. Pittsburgh: 9,738.7 8. San Antonio. TX: 9,234.3______________ 8. Portland, OR: 8,973.6 9. Portland, OR: 8,257.0_________________ 9. San Antonio, TX: 8,846.8 10. Cincinnati: 8,141.9__________________ 10. Columbus: 7,834.0 11. Columbus: 8,134.9____________________ 11. Sacramento, CA: 7,668.7 12. Sacramento, CA: 7,261.5______________ 12. Austin, TX: 7,534.0 13. Austin, TX: 7,232.3__________________ 13. Cincinnati: 7,273.6 14. Akron: 6,925.4_______________________ 14. Grand Rapids, MI: 6,540.0 15. Grand Rapids, MI: 6,852.0____________ 15. Akron: 6,284.9 16. Indianapolis: 6,727.9________________ 16. Orlando: 6,055.1 17. Toledo: 6,651.5______________________ 17. Omaha: 5,968.3 18. Dayton: 6,382.8______________________ 18. Toledo: 5,982.1 19. St. Louis: 6,093.7___________________ 19. Indianapolis: 5,879.9 20. Kansas City: 6,025.1_________________ 20. St. Louis: 5,663.8
Density at Mile Marker 4, with an Area of 50.27 Square Miles 2000———————————2010 1. Chicago: 15,447.2____________________ 1. Chicago: 15,205.9 2. San Jose, CA: 12,209.3_______________ 2. San Jose, CA: 12,629.6 3. Las Vegas: 9,788.0___________________ 3. Las Vegas: 10,022.2 4. Minneapolis: 8,874.4_________________ 4. Minneapolis: 8,921.8 5. Milwaukee: 8,823.8___________________ 5. Milwaukee: 8,725.5 6. Providence, RI: 8,454.3______________ 6. Providence, RI: 8,483.8 7. Pittsburgh: 8,216.0__________________ 7. Portland, OR: 7,785.5 8. Portland, OR: 7,282.9________________ 8. Pittsburgh: 7,602.6 9. San Antonio, TX: 7,208.6_____________ 9. San Antonio, TX: 6,995.5 10. Cincinnati: 6,922.8_________________ 10. Cincinnati: 6,279.4 11. Columbus: 6,449.3___________________ 11. Columbus: 6,257.4 12. Sacramento, CA: 5,744.7_____________ 12. Sacramento, CA: 6,138.5 13. Austin, TX: 5,541.5_________________ 13. Austin, TX: 5,847.2 14. St. Louis: 5,447.5__________________ 14. Omaha: 5,047.2 15. Cleveland: 5,356.2__________________ 15. St. Louis: 5,001.6 16. Indianapolis: 5,348.8_______________ 16. Grand Rapids, MI: 4,922.9 17. Detroit: 5,163.1____________________ 17. Orlando: 4,911.7 18. Omaha: 5,019.8______________________ 18. Indianapolis: 4,793.5 19. Akron: 4,900.7______________________ 19. Akron: 4,532.0 20. Dayton: 4,889.3_____________________ 20. Cleveland: 4,521.8
Density at Mile Marker 5, with an Area of 78.54 Square Miles Note that this area size is about the current city size of Cincinnati and Cleveland. 2000————————————2010 1. Chicago: 14,213.6___________________ 1. Chicago: 13,591.0 2. San Jose, CA: 10,464.0______________ 2. San Jose, CA: 11,037.1 3. Las Vegas: 8,521.9__________________ 3. Las Vegas: 9,062.8 4. Minneapolis: 7,443.0________________ 4. Minneapolis: 7,455.9 5. Milwaukee: 7,081.2__________________ 5. Milwaukee: 7,029.1 6. Pittsburgh: 7,009.9_________________ 6. Pittsburgh: 6,492.7 7. San Antonio, TX: 6,326.6____________ 7. Portland, OR: 6,442.3 8. Providence, RI: 6,048.3_____________ 8. San Antonio, TX: 6,223.4 9. Portland, OR: 5,950.1_______________ 9. Providence, RI: 6,055.8 10. Cincinnati: 5,588.9________________ 10. Sacramento, CA: 5,664.2 11. Cleveland: 5,494.6_________________ 11. Orlando: 5,274.1 12. Columbus: 5,252.9__________________ 12. Columbus: 5,152.1 13. Sacramento, CA: 5,104.0____________ 13. Cincinnati: 5,096.2 14. Orlando: 4,993.7___________________ 14. Austin, TX: 4,993.7 15. Austin, TX: 4,786.5________________ 15. Cleveland: 4,602.4 16. Detroit: 4,748.7___________________ 16. St. Louis: 4,285.4 17. St. Louis: 4,731.5_________________ 17. Indianapolis: 4,086.1 18. Indianapolis: 4,447.7______________ 18. Omaha: 3,962.2 19. Akron: 4,025.9_____________________ 19. Grand Rapids, MI: 3,887.3 20. Grand Rapids, MI: 3,990.6__________ 20. Akron: 3,778.8
So if Columbus was the same size as Cincinnati and Cleveland, it would be the most dense city of the 3. And it’s generally in the top half of the grouping in its most urban areas.
But what about further out, past the urban core?
Density at Mile Marker 10, with an Area of 314.16 Square Miles. This area size is much larger than the city limits of Columbus, but it gives an idea of the larger area’s density and not just within the city limits. 2000———————————–2010 1. Chicago: 9,344.3______________________ 1. Chicago: 8,795.0 2. San Jose, CA: 4,563.2_________________ 2. San Jose, CA: 4,809.8 3. Minneapolis: 4,183.2__________________ 3. Las Vegas: 4,794.2 4. Detroit: 4,117.4______________________ 4. Portland, OR: 4,230.3 5. Las Vegas: 3,877.3____________________ 5. Minneapolis: 4,178.3 6. Portland: 3,780.8_____________________ 6. San Antonio, TX: 3,454.9 7. Cleveland: 3,308.4____________________ 7. Detroit: 3,354.7 8. Pittsburgh: 3,279.8___________________ 8. Columbus: 3,163.9 9. San Antonio, TX: 3,217.8______________ 9. Pittsburgh: 3,080.4 10. Milwaukee: 3,013.7___________________ 10. Orlando: 3,055.0 11. Columbus: 2,973.3____________________ 11. Sacramento, CA: 3,016.4 12. St. Louis: 2,937.6___________________ 12. Milwaukee: 3,006.2 13. Cincinnati: 2,873.4__________________ 13. Cleveland: 2,923.7 14. Orlando: 2,783.9_____________________ 14. Indianapolis: 2,772.6 15. Sacramento, CA: 2,736.7______________ 15. St. Louis: 2,751.3 16. Indianapolis: 2,652.6________________ 16. Cincinnati: 2,746.8 17. Kansas City: 2,599.0_________________ 17. Kansas City: 2,538.3 18. Providence, RI: 2,360.0______________ 18. Austin, TX: 2,439.6 19. Austin, TX: 2,111.3__________________ 19. Providence, RI: 2,375.1 20. Dayton: 1,920.7______________________ 20. Charlotte, NC: 2,332.7
So what does all this tell us? That while Columbus is not the most dense city of its peer group, or within the Midwest group, it probably does not wholly deserve its low-density, suburban reputation. Most of the measurements are in the top half of the grouping for density, yes, but it is clearly the most weak in the urban core closest to Downtown, as that ranking is the lowest for it. The Mile 0 population, for example, is down near the very bottom, and that is a good reason why densities are not as high as they should/could be. Currently, Downtown and surrounding neighborhoods are seeing a residential development boom, so that will help, but the city needs to think a lot bigger if it wants that stereotype to truly go away. The recent abandonment of the Convention Center mixed-use project is not a good way to go about that goal… and it should be a goal.
Today, the Census released new population figures for cities and incorporated places. I looked at all those places within the Columbus metro area and came up with the following stats on 2013 city population estimates.
So by the trends, it definitely appears that most suburbs have slowed, while Columbus and its inner suburbs increased. This seems like a pretty good indication of the ongoing urban movement to me.
The Columbus Metropolitan Area resides within a group of metros between 1.5 and 2.5 million people. I wanted to take a look at population densities between that group of metros to see how different they really are and where Columbus might fall within them.
Metro Area Population Density Per Square Mile in 2011 and 2012 by Rank 2011 —————————– 2012 1. San Jose: 1,430.6 — 1. Cleveland: 1,033.3 2. Cleveland: 1,035.7 — 2. Providence: 978.8 3. Providence: 978.1 — 3. Milwaukee: 859.6 4. Milwaukee: 856.9 — 4. San Jose: 702.9 5. Charlotte: 687.7 — 5. Virginia Beach: 642.2 6. Virginia Beach: 634.6 — 6. Orlando: 637.0 7. Orlando: 622.0 — 7. Cincinnati: 484.4 8. Cincinnati: 486.6 — 8. Indianapolis: 444.4 9. Columbus: 468.5 — 9. Charlotte: 443.4 10. Indianapolis: 457.5 — 10. Austin: 428.6 11. Austin: 416.7 — 11. Pittsburgh: 413.7 12. Pittsburgh: 413.6 — 12. Columbus: 400.8 13. Portland, OR: 331.9 — 13. Portland: 335.9 14. Sacramento: 313.8 — 14. Sacramento: 316.7 15. San Antonio: 297.1 — 15. San Antonio: 302.4 16. Nashville: 280.6 — 16. Kansas City: 276.5 17. Kansas City: 258.2 — 17. Nashville: 270.7 18. Las Vegas: 243.5 — 18. Las Vegas: 247.3
Higher metro population doesn’t necessarily equate to higher density. The smaller metros tend to have higher densities. Columbus is middle of the pack.
Core County Population in 2011 and 2012 by Rank 2011 —————————————— 2012 1. Clark (Las Vegas): 1,969,975 — 1. Clark (Las Vegas): 2,000,759 2. Santa Clara (San Jose): 1,809,378 — 2. Santa Clara (San Jose): 1,837,504 3. Bexar (San Antonio): 1,756,153 — 3. Bexar (San Antonio) 1,785,704 4. Sacramento (Sacramento): 1,436,105 — 4. Sacramento (Sacramento): 1,450,121 5. Cuyahoga (Cleveland): 1,270,294 — 5. Cuyahoga (Cleveland): 1,265,111 6. Allegheny (Pittsburgh): 1,227,066 — 6. Allegheny (Pittsburgh): 1,229,338 7. Franklin (Columbus): 1,178,799 — 7. Orange (Orlando): 1,202,234 8. Orange (Orlando): 1,169,107 — 8. Franklin: (Columbus): 1,195,338 9. Travis (Austin): 1,063,130 — 9. Travis (Austin): 1,095,584 10. Milwaukee (Milwaukee): 952,532 — 10. Mecklenburg (Charlotte): 969,031 11. Mecklenburg (Charlotte): 944,373 — 11. Milwaukee (Milwaukee): 955,205 12. Marion (Indianapolis): 911,296 — 12. Marion (Indianapolis): 918,977 13. Hamilton (Cincinnati): 800,362 — 13. Hamilton (Cincinnati): 802,038 14. Multnomah (Portland): 748,031 — 14. Multnomah (Portland): 759,256 15. Jackson (Kansas City): 676,360 — 15. Jackson (Kansas City): 677,377 16. Davidson (Nashville): 635,475 — 16. Davidson (Nashville): 648,295 17. Providence (Providence): 626,709 — 17. Providence (Providence): 628,323 18. Virginia Beach (No County): 442,707 — 18. Virginia Beach (No County): 447,021
Core County Area Size in Square Miles in 2011 by Rank Clark (Las Vegas): 8,091 Santa Clara (San Jose): 1,304 Bexar (San Antonio): 1,257 Travis (Austin): 1,022 Orange (Orlando): 1,004 Sacramento (Sacramento): 995 Allegheny (Pittsburgh): 745 Jackson (Kansas City): 616 Mecklenburg (Charlotte): 546 Franklin (Columbus): 544 Davidson (Nashville): 526 Multnomah (Portland): 466 Cuyahoga (Cleveland): 457 Providence (Providence): 436 Hamilton (Cincinnati): 413 Marion (Indianapolis): 403 Virginia Beach (No County): 248 Milwaukee (Milwaukee): 242
Core County Population Density Per Square Mile in 2011 and 2012 by Rank 2011 ——————————————— 2012 1. Milwaukee (Milwaukee): 3,936.1 — 1. Milwaukee: 3,947.1 2. Cuyahoga (Cleveland): 2,779.6 — 2. Cuyahoga: 2,768.3 3. Marion (Indianapolis): 2,261.3 — 3. Marion: 2,280.3 4. Franklin (Columbus): 2,166.9 — 4. Franklin: 2,197.7 5. Hamilton (Cincinnati): 1,937.9 — 5. Hamilton: 1,942.0 6. Virginia Beach (No County): 1,785.1 — 6. Virginia Beach: 1,802.5 7. Mecklenburg (Charlotte): 1,729.6 — 7. Mecklenburg: 1,774.8 8. Allegheny (Pittsburgh): 1,647.1 — 8. Allegheny: 1,650.1 9. Multnomah (Portland: 1,605.2 — 9. Multnomah: 1,629.3 10. Sacramento (Sacramento): 1,443.3 — 10. Sacramento: 1,457.4 11. Providence (Providence): 1,437.4 — 11. Providence: 1,441.1 12. Bexar (San Antonio): 1,397.1 — 12. Bexar: 1,420.6 13. Santa Clara (San Jose): 1,387.6 — 13. Santa Clara: 1,409.1 14. Davidson (Nashville): 1,208.1 — 14. Davidson: 1,232.5 15. Orange (Orlando): 1,164.4 — 15. Orange: 1,197.4 16. Jackson (Kansas City): 1,098.0 — 16. Jackson: 1,099.6 17. Travis (Austin): 1,040.2 — 17. Travis: 1,072.0 18. Clark (Las Vegas): 243.5 — 18. Clark: 247.3
The core counties of metros within the Midwest are clearly the most dense, with most hovering around or above 2,000 people per square mile. Columbus has the 4th densist core county of the bunch.
City Population in 2011 and 2012 by Rank 2011 —————— 2012 1. San Antonio: 1,359,758 2012 numbers to be released in May 2013. 2. San Jose: 967,487 3. Indianapolis: 827,609 4. Austin: 820,611 5. Columbus: 797,434 6. Charlotte: 751,087 7. Nashville: 609,644 8. Milwaukee: 597,867 9. Portland: 593,820 10. Las Vegas: 589,317 11. Sacramento: 472,178 12. Kansas City: 463,202 13. Virginia Beach: 442,707 14. Cleveland: 393,806 15. Pittsburgh: 307,484 16. Cincinnati: 296,223 17. Orlando: 243,195 18. Providence: 178,053
City Area Size in Square Miles in 2011 by Rank Nashville: 527.9 Virginia Beach: 497.3 San Antonio: 412.1 Indianapolis: 372.0 Kansas City: 319.0 Charlotte: 297.7 Austin: 297.0 Columbus: 217.2 San Jose: 180.0 Portland: 145.1 Las Vegas: 135.8 Orlando: 110.7 Sacramento: 100.1 Milwaukee: 96.8 Cleveland: 82.5 Cincinnati: 79.4 Pittsburgh: 58.3 Providence: 20.5
City Population Density Per Square Mile in 2011 by Rank Providence: 8,685.5 Milwaukee: 6,176.3 San Jose: 5,374.9 Pittsburgh: 5274.2 Cleveland: 4,773.4 Sacramento: 4,717.1 Las Vegas: 4,339.6 Portland: 4,092.5 Cincinnati: 3,726.1 Columbus: 3,671.4 San Antonio: 3,299.6 Austin: 2,763.0 Charlotte: 2,523.0 Indianapolis: 2,224.8 Orlando: 2,196.9 Kansas City: 1,452.0 Nashville: 1,154.8 Virginia Beach: 890.2
So for the most part, when it comes to metro density, Columbus runs mostly in the middle, although it does have a rather dense core county.
I’ll examine some tract densities in Part 2, as well as the overall trends for Columbus and where it might fall come 2020.
Columbus’ downtown has seen many many changes, especially over the last decade. Developments like the Arena District, Columbus Commons, the Scioto Mile and more have brought new life to the area. Dozens of new restaurants have opened the past year or two alone, and a new grocery store will be opening for area residents in February. More developments coming up include the Scioto River restoration project that will create acres of new Downtown park space and pathways, and the redevelopment of the Scioto Peninsula behind COSI should connect the two sides of the river. All of this had led to rising population, now approaching 7,000. More than 1,000 residential units are currently under construction and more is on the way. So the question I was wondering is how has population been changing not only in Columbus’ downtown, but in comparison to Cleveland and Cincinnati. Both of those cities have also seen major projects in their downtown cores and are seeing an uptick in their downtown populations.
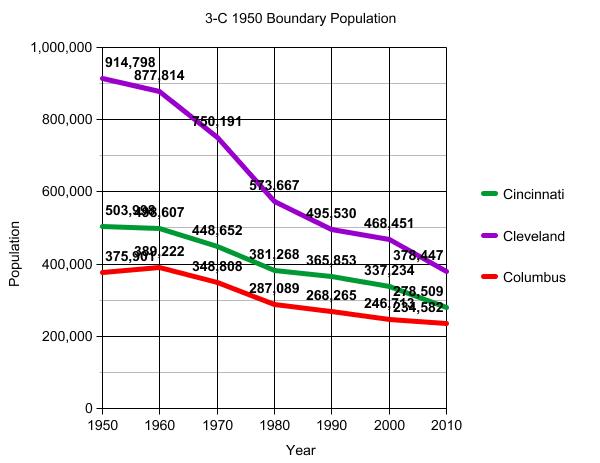
First, I examined the 1950 city limits for all three cities. This was the last census year before sprawl really took hold and changed the city dynamics and growth patterns. 1950 is also when most cities in Ohio reached their peak urban population, so I thought it would be interesting to see how those old boundaries had changed over the years. I went to the US census website and began to look up all the census tracts that existed in each city in 1950. Those would represent my base area that I would use to see the changes in the city core. All of the 3-Cs have grown beyond those 1950 boundaries, especially Columbus, but these areas were the hardest hit when the urban decline came the last 50-60 years while the suburbs grew. The results are both sobering and hopeful.
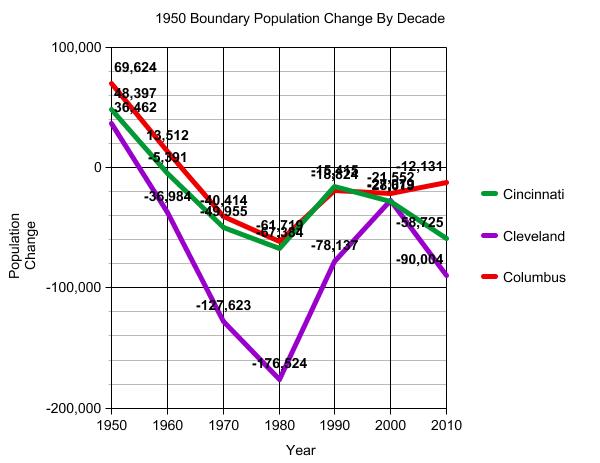
So what do these numbers show? Well, it’s clear that all 3 cities had urban core population declines the past 60 years just like just about every other city in the nation did. This was mostly a result of the suburban movement. In Cleveland, the rate of loss had gradually been slowing down since the 1970s, but suddenly skyrocketed again in the 2000s. I’m not sure what exactly caused this. The double recessions made it more difficult for people to move, so if anything, the losses should’ve not accelerated. Cleveland lost over 90,000 people in its urban core from 2000-2010, the highest lost by % and total of any Ohio city. In Cincinnati, population loss had peaked in the 1970s and the rate of loss fell substantially the following decade. However, the past 2 decades have actually seen a gradual acceleration of losses. The 2000-2010 period saw the second biggest total loss for the urban core. For Columbus, it’s been the opposite picture. Like the other 2-Cs, losses peaked in the 1970s. Since then, the urban core losses have been in gradual decline. The 2000-2010 period had the smallest rate and total loss of any decade the past 60 years.
So interesting results, but these numbers don’t show any trends of what’s going on inside the 1950 boundaries, especially not the relatively small part that would be the downtowns. So let’s break the numbers down to the tract level.
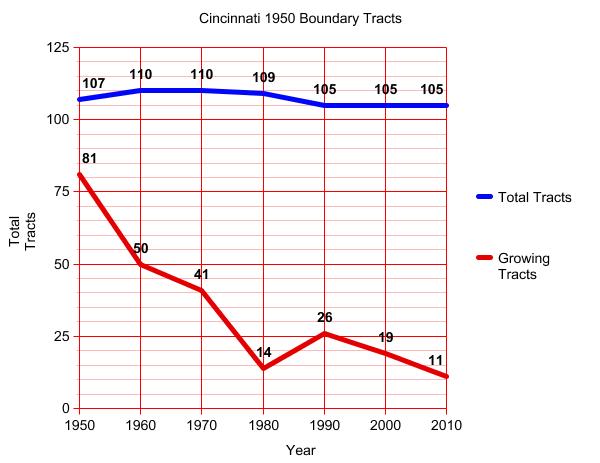
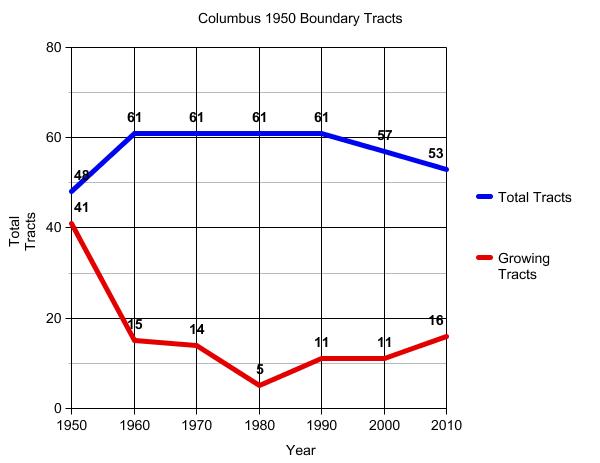
# of Tracts in 1950* Cincinnat: 107 Cleveland: 201 Columbus: 48
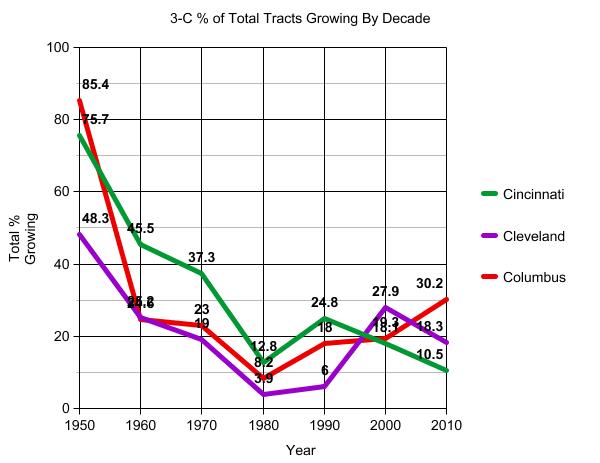
*The number of tracts changed from 1950 on as some were split or consolidated. This made it more complicated, but luckily the Census gives lists on how tracts changed over time, so one can figure out what tract became what and reasonably keep up with the same boundaries that existed in 1950. So with this breakdown, we can see more of the trends within the 1950 boundaries. In Cincinnati, a long decline was followed by a recovery in 1990, only to have the next 20 years show an increasing decline. The 2010 census showed the fewest number of tracts growing on record. This is the worst performance of the 3-Cs. Cleveland also had a steep decline followed by a recovery, but it too declined more at the last census, but not nearly to the low point it reached in the 1970s and 1980s.
Meanwhile, Columbus also faced an initial steep decline and barely had any tracts growing during the 1970s. Since then, the trend has been up. The 16 growing tracts in 2010 were the highest since the 1940s. This is the best performance of the 3-Cs, and Columbus had the highest % of growing tracts in its core. Still, those 16 represent less than 1/3rd of the total tracts within the 1950 boundaries. So while there appears to be recovery ongoing in Columbus, especially compared to Cleveland and Cincinnati, it’s not where it needs to be.
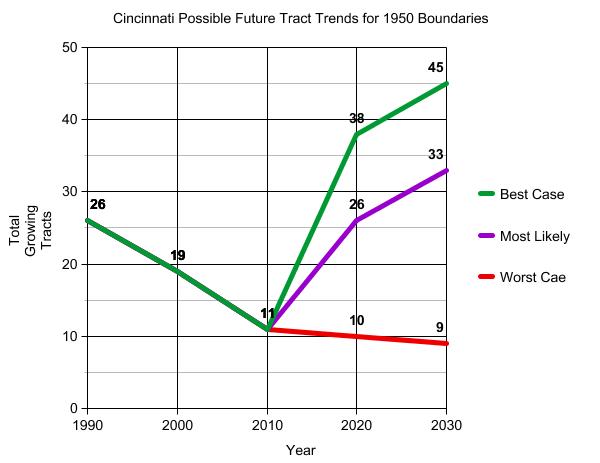
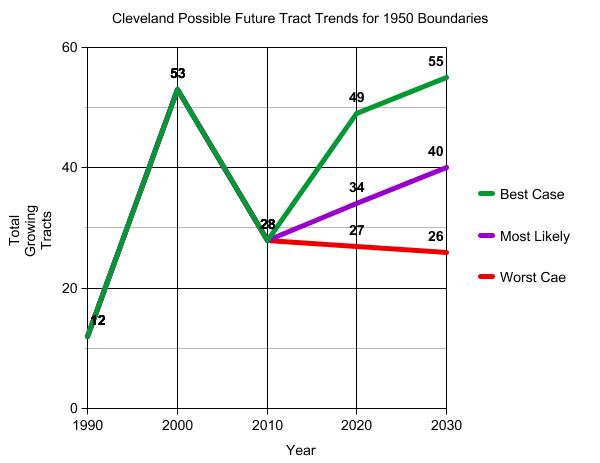
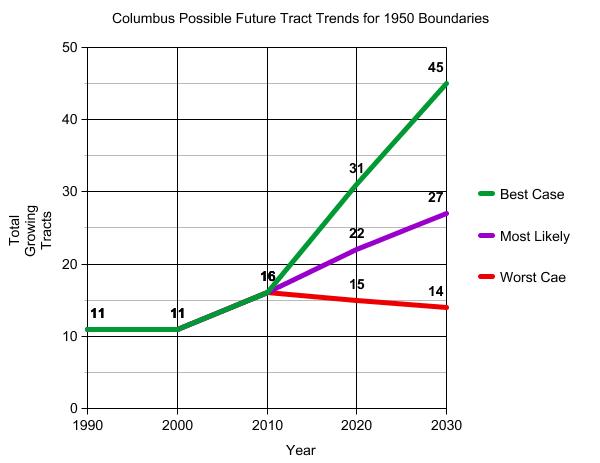
So let’s look to the future. All these tracts are trending in certain directions themselves. While they may be losing now, they may be trending toward an eventual gain, and vice versa. If we follow the trends ongoing for the urban core tracts, where might the picture look like in say, 2020?
Tract Trends for Those Tracts Growing in Population in 2010 Trends are listed from what, in my opinion are the most positive to the most negative.
Growing in both 2000 and 2010, but Growth Accelerating Over Time and % of Total Tracts Cincinnati: 0- 0% Cleveland: 7- 4.6% Columbus: 5- 11.3%
Shrinking in 2000 but Growing in 2010 and % of Total Tracts Cincinnati: 10- 9.5% Cleveland: 20- 13.1% Columbus: 10- 18.9%
Growing in both 2000 and 2010, but Growth Slowing Over Time and % of Total Tracts Cincinnati: 1- 1.0% Cleveland: 1- 0.7% Columbus: 1- 1.9%
Shrinking in both 2000 and 2010, but Loss Slowing Over Time and % of Total Cincinnati: 28- 26.7% Cleveland: 21- 13.7% Columbus: 15- 28.3%
These tracts are those most likely to switch to positive growth come 2020. This is arguably one of the more positive trends and may deserve to be bumped a bit higher on the list.
Growing in 2000 but Shrinking in 2010 and % of Total Cincinnati: 18- 17.1% Cleveland: 42- 27.5% Columbus: 5- 9.4%
Shrinking in both 2000 and 2010, but Loss Accelerating and % of Total Cincinnati: 48- 45.7% Cleveland: 93- 60.8% Columbus: 17- 32.1%
These are the worst of the worst tracts, likely representing the most declined parts of the urban core. It’s pretty surprising to see that almost 2/3rds of Cleveland’s tracts are in this condition.
The tract trends paint a very interesting picture about each city’s urban core future. If we expanded these trends to the next census in 2020, this is what you might see.
All this information, however, deals with the entire urban core. What about just the Central Business Districts, or the downtown areas for each city? In , I will examine those numbers and trends for the very heart of these cities.