An overcast day in 2011.
I received a massive positive response for the first version of this series, which was just a simple mashup of before and after photos of different parts of Columbus urban neighborhoods over the course of a decade. Because of that response, I have decided to do this How Columbus has changed in 10 years part 2 series. This time, besides adding more photos from core neighborhoods, I will expand the series out to other parts of the city and some suburbs, though still remaining within the 270 Outerbelt. In some ways, these before and after photos are even more drastic than the first set.
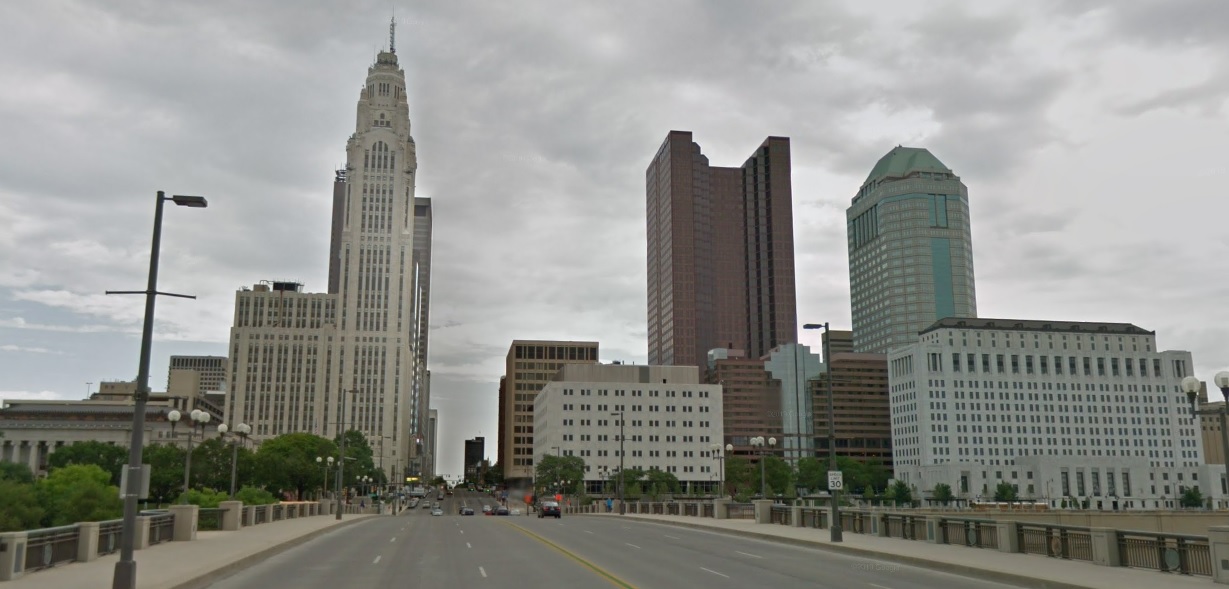
Downtown
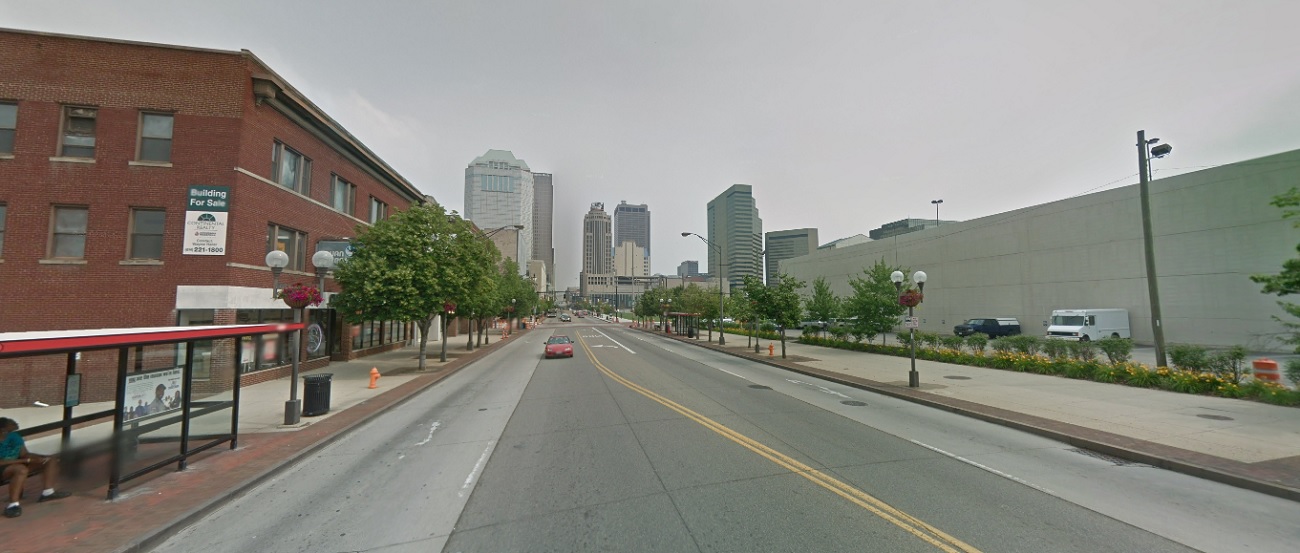
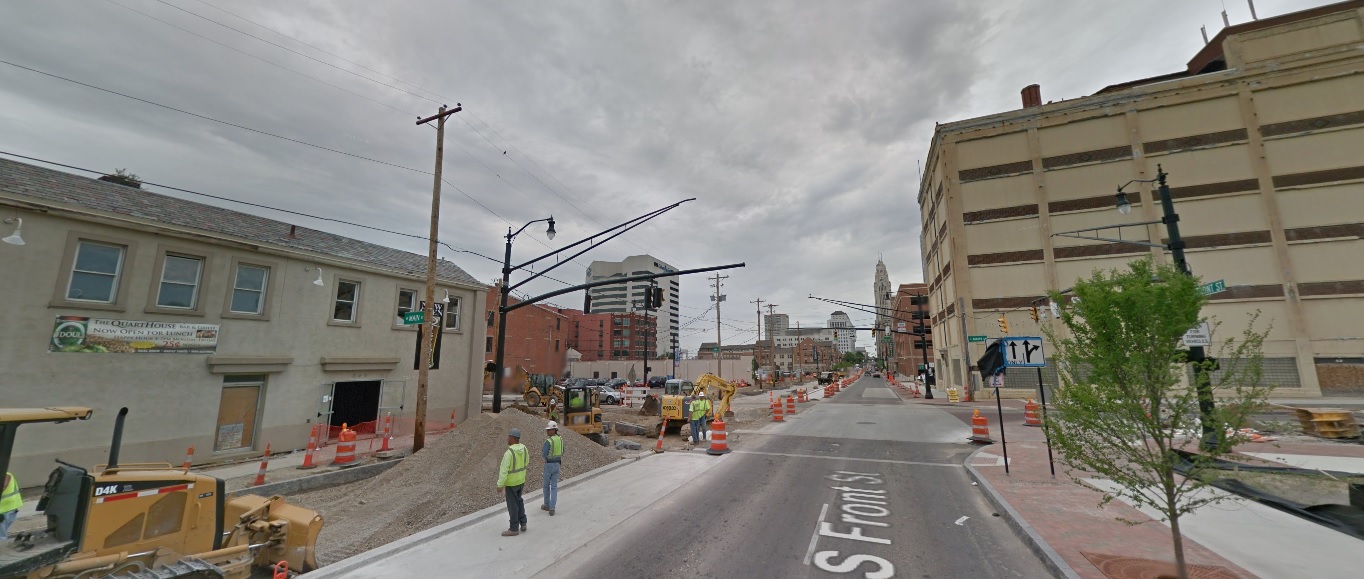
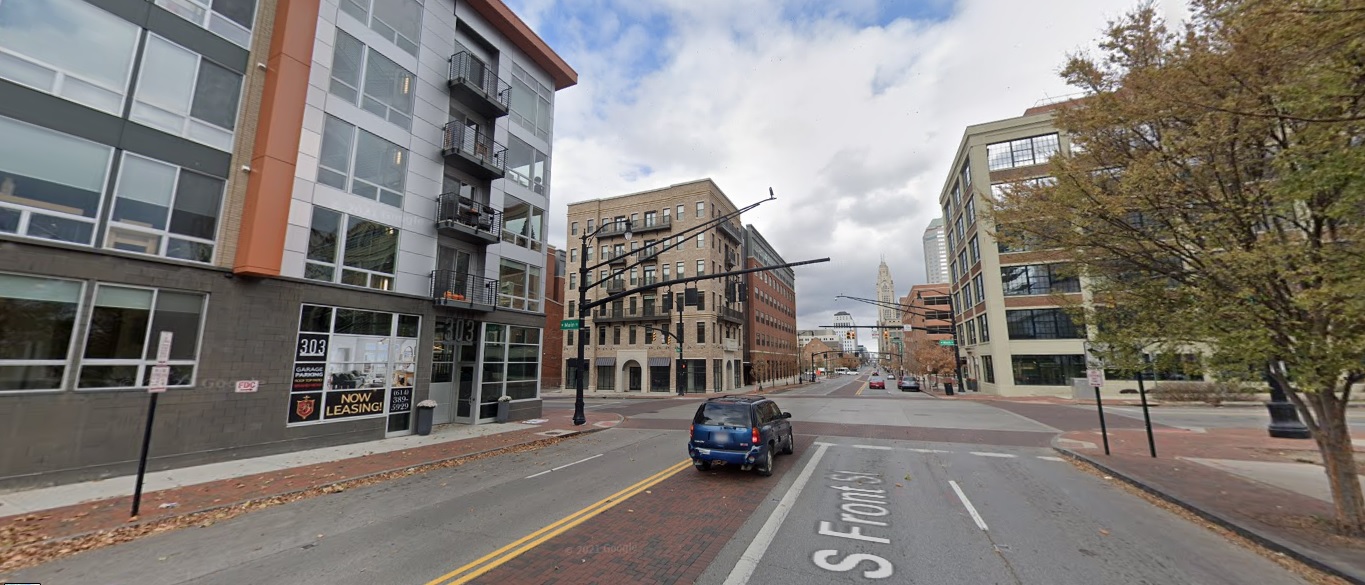
Front Street, looking north from Main Street.
Before: 2011
After: 2021
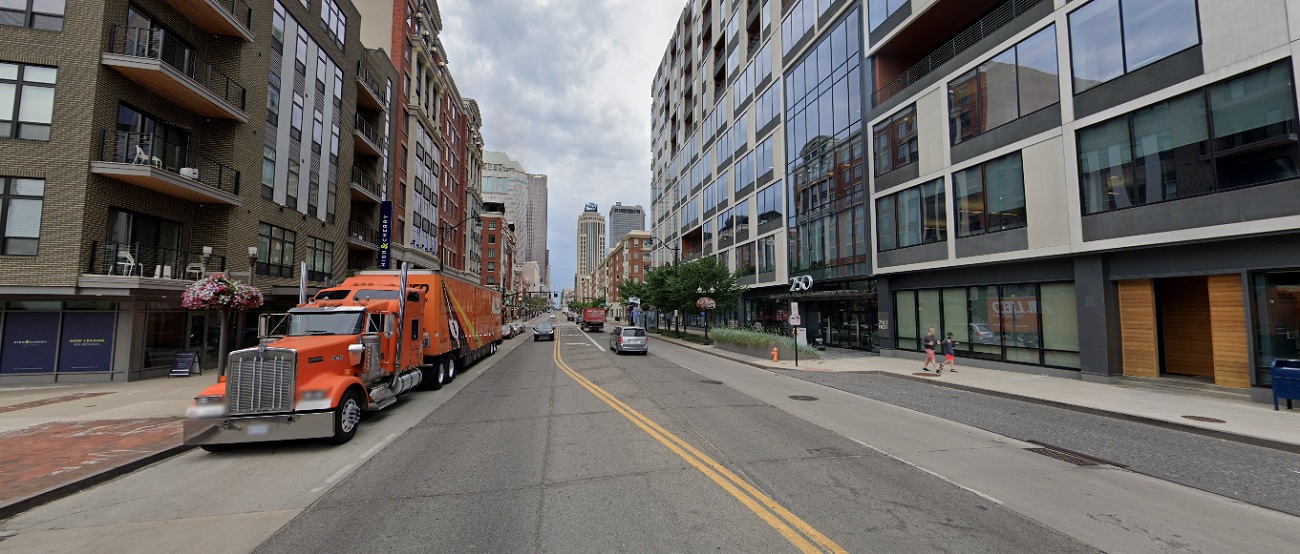
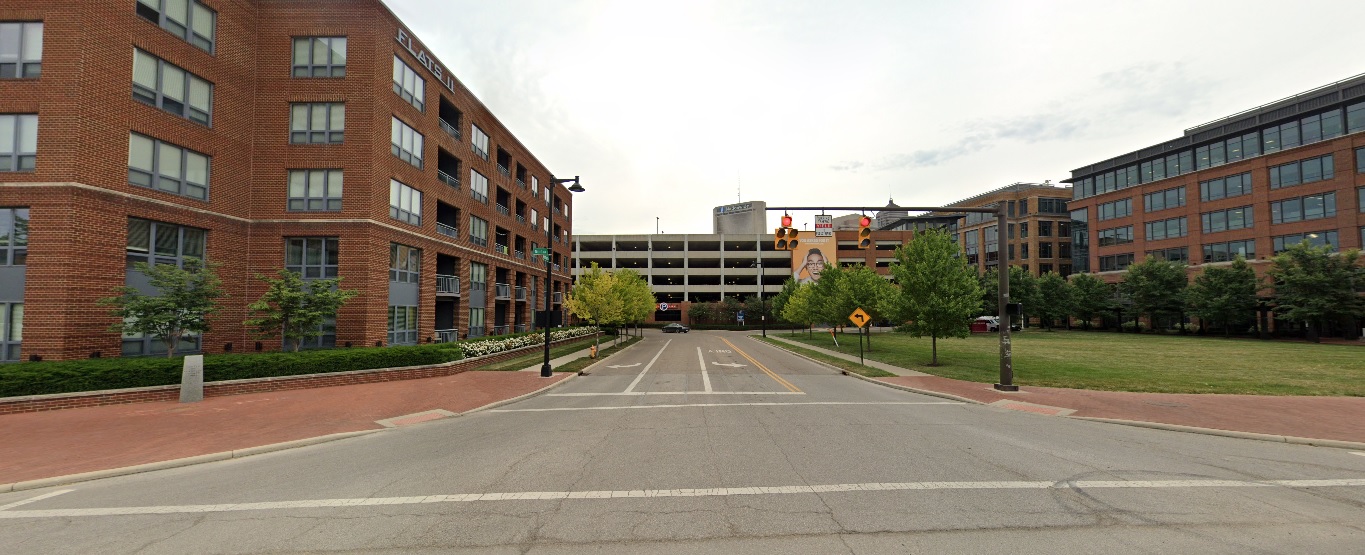
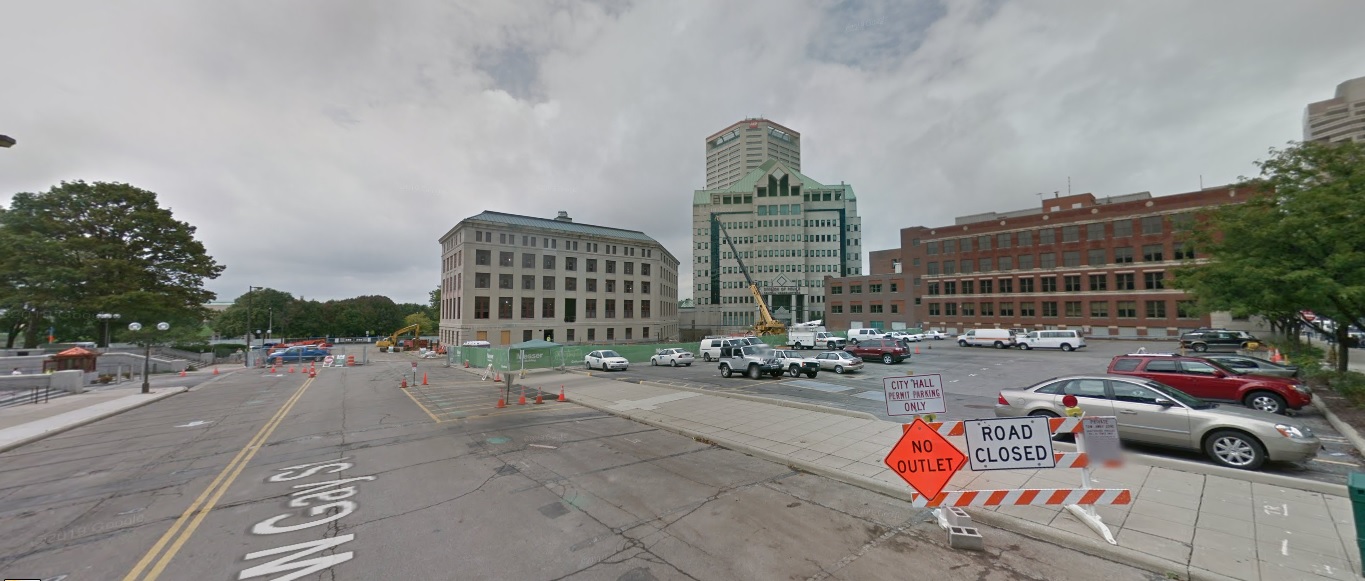
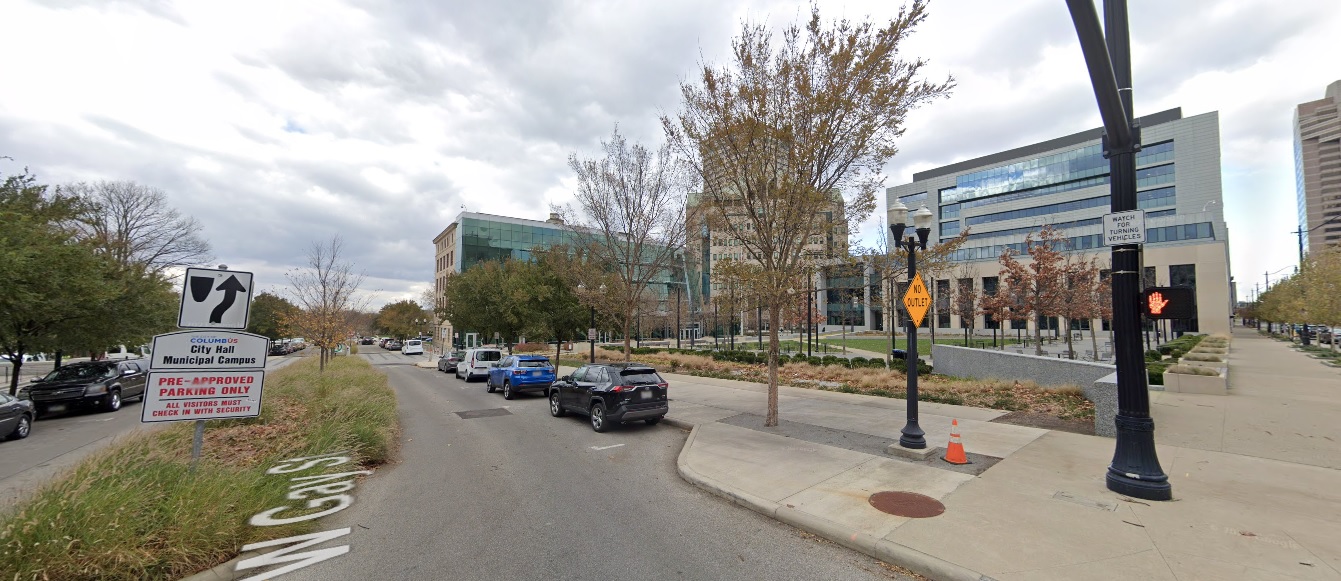
Gay Street, looking west from Front Street.
Before: 2011
After: 2020
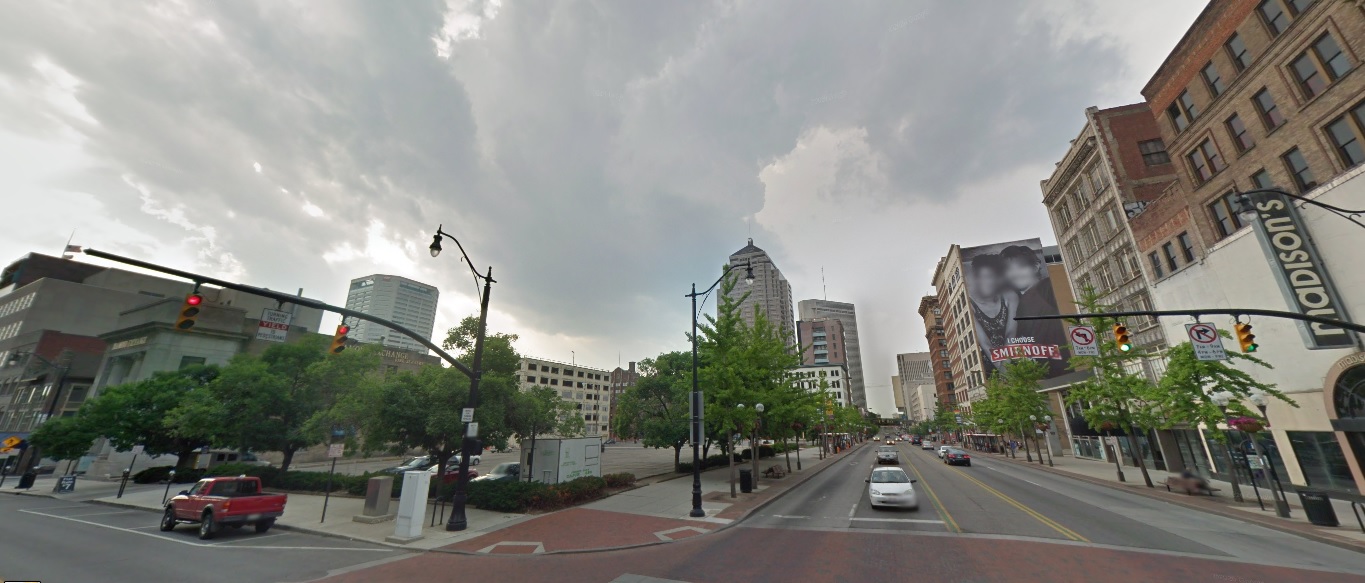
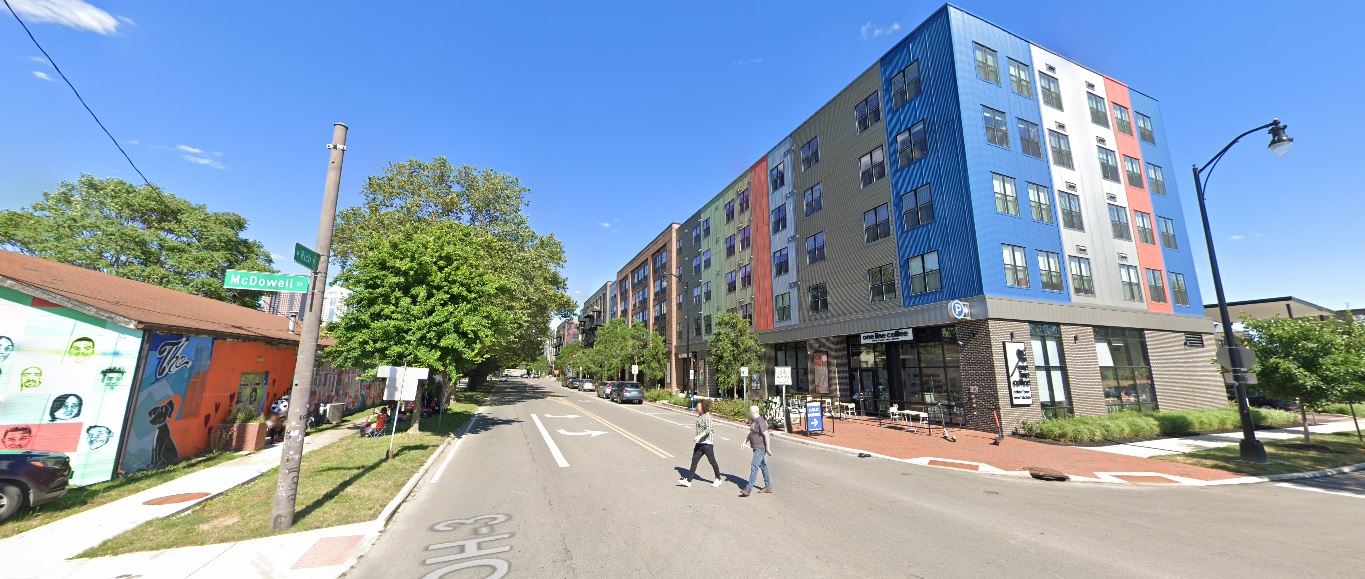
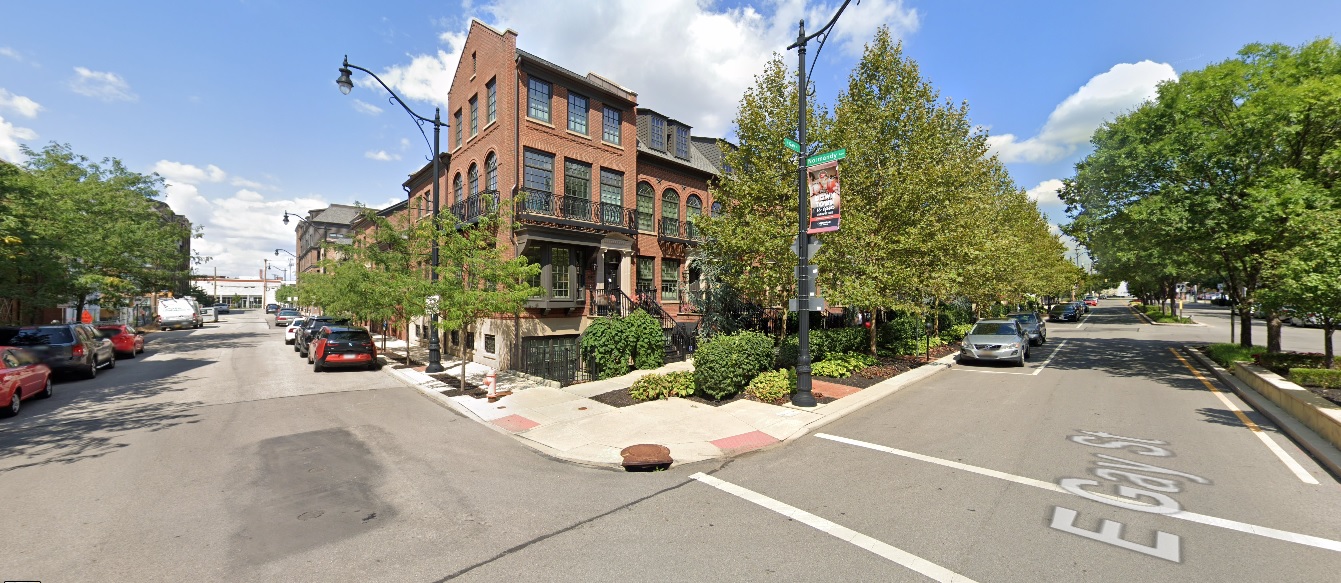
Gay Street, looking northeast from Normandy Avenue.
Before: 2011

After: 2021
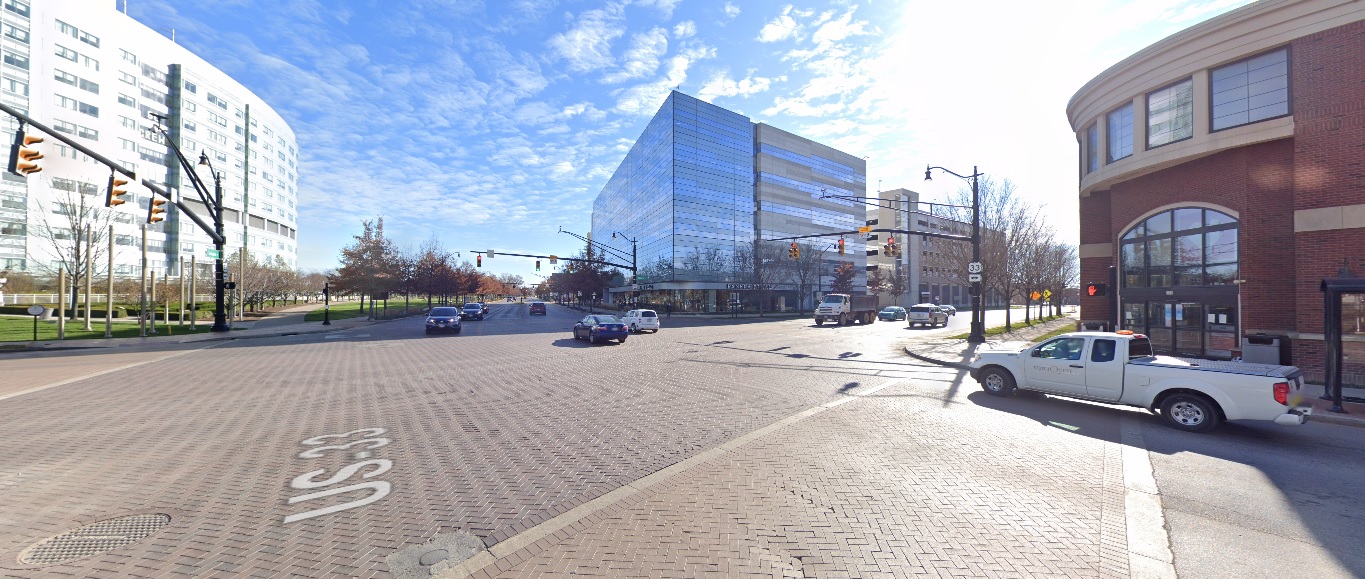
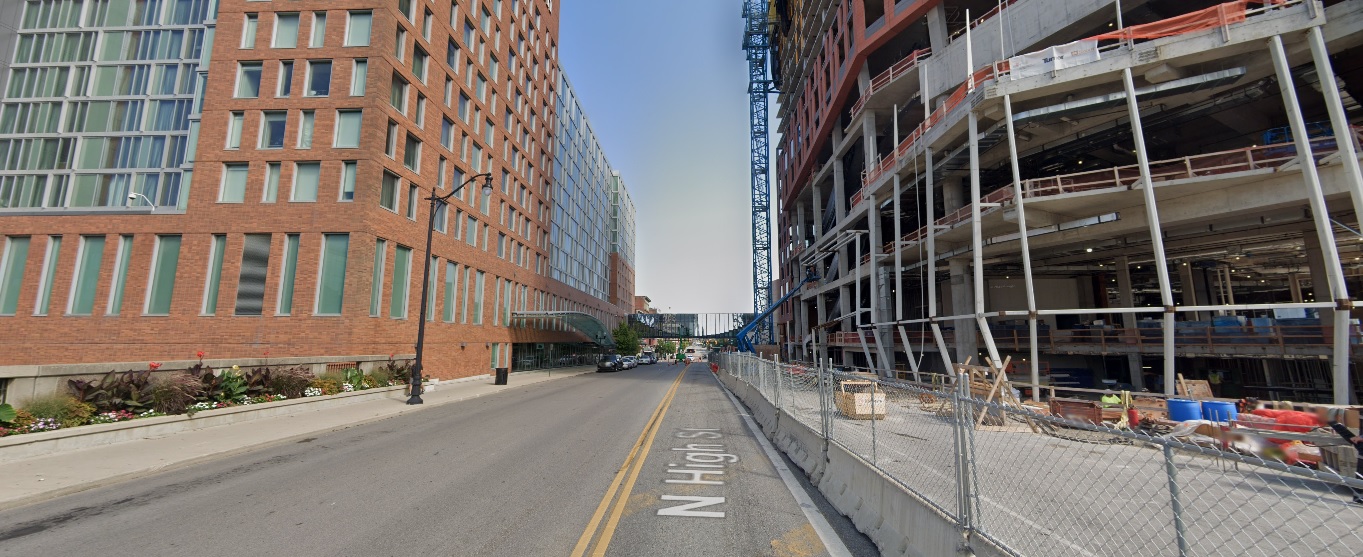
High Street, looking north at the Convention Center.
Before: 2011
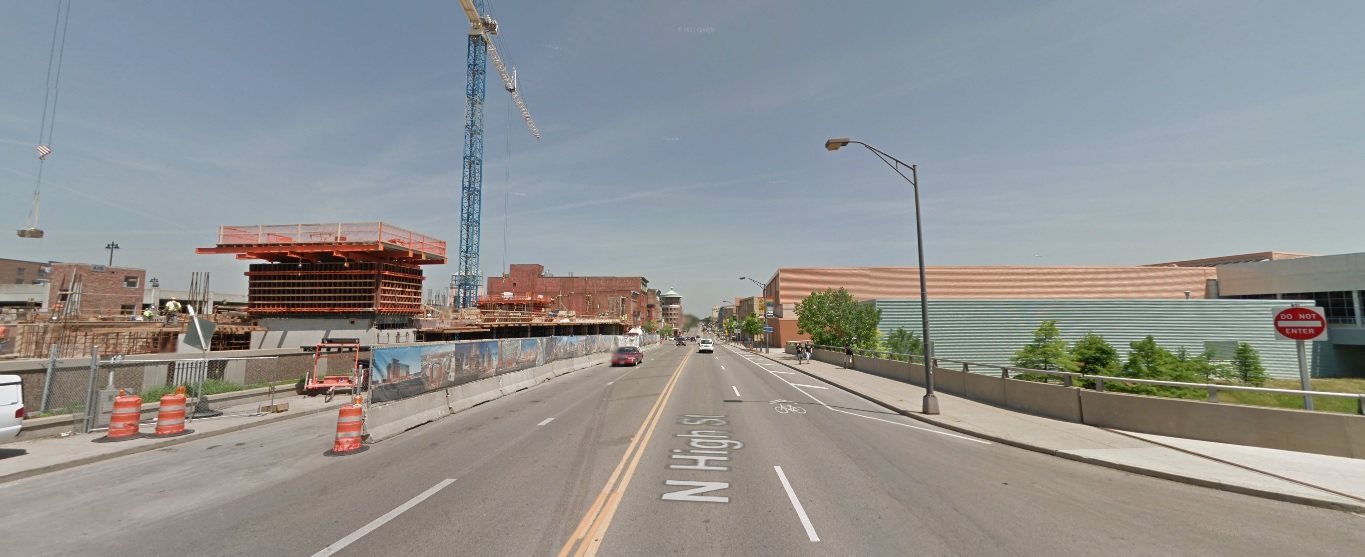
After: 2021
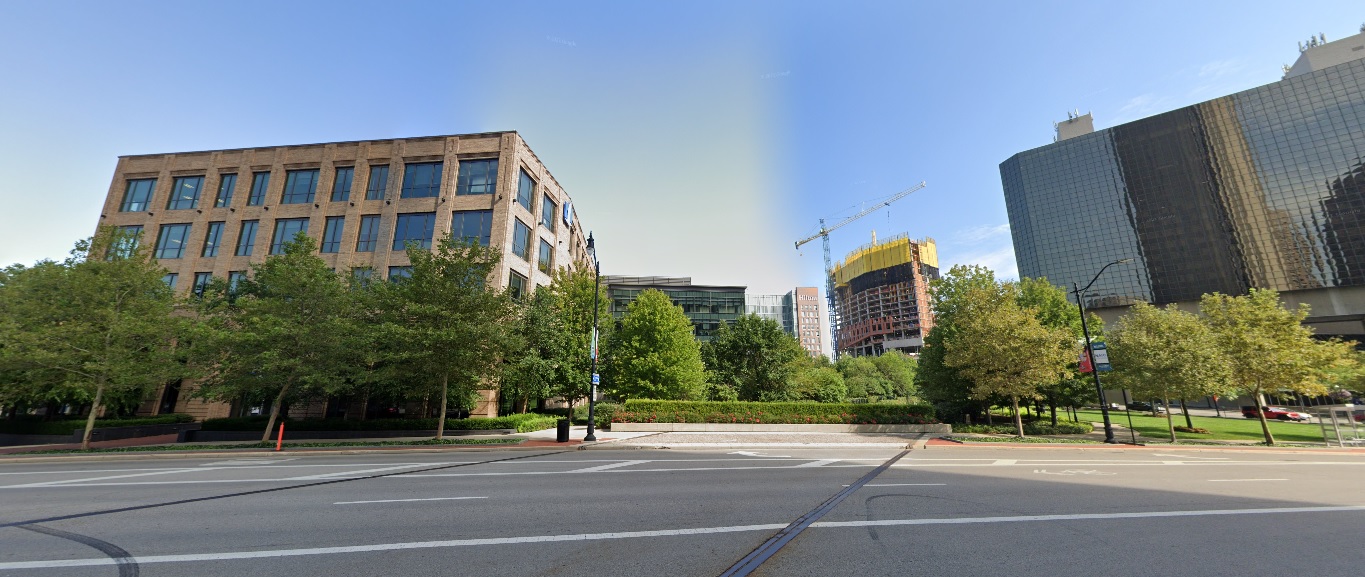
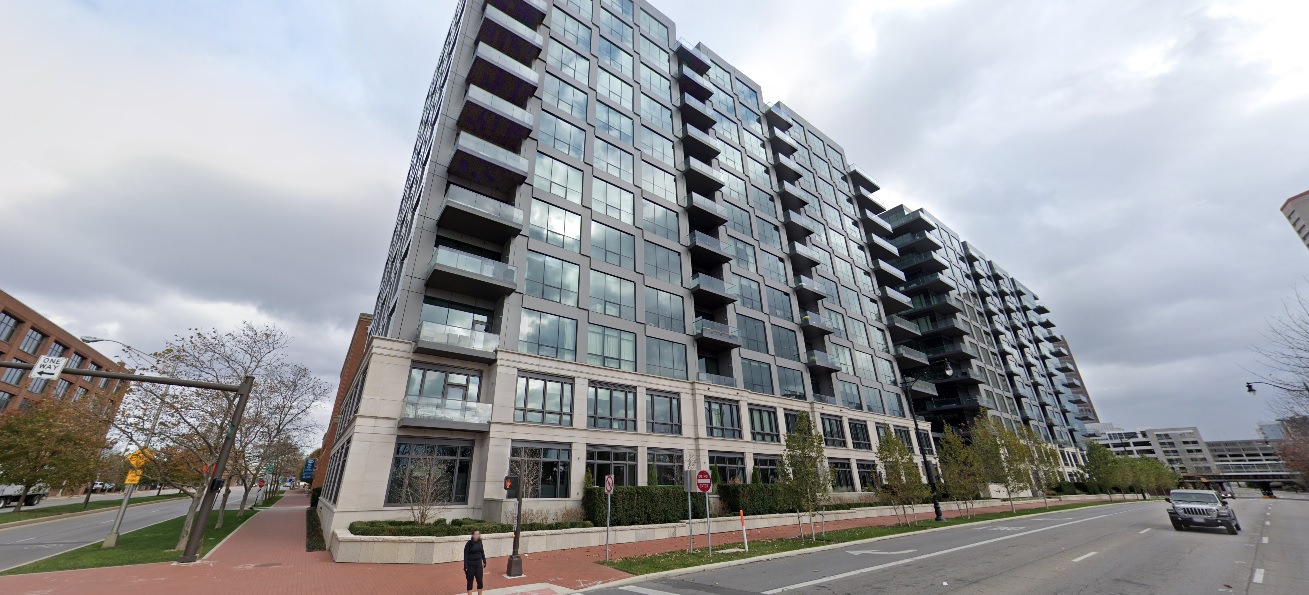
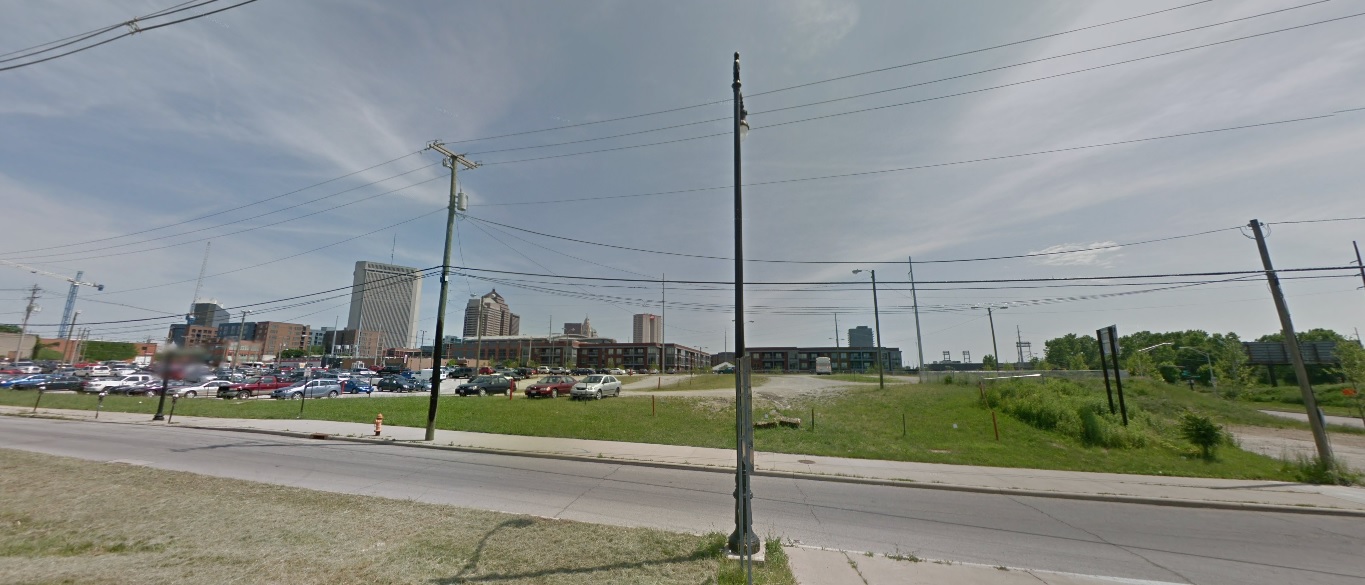
Nationwide Boulevard, looking north just east of Front Street.
Before: 2011
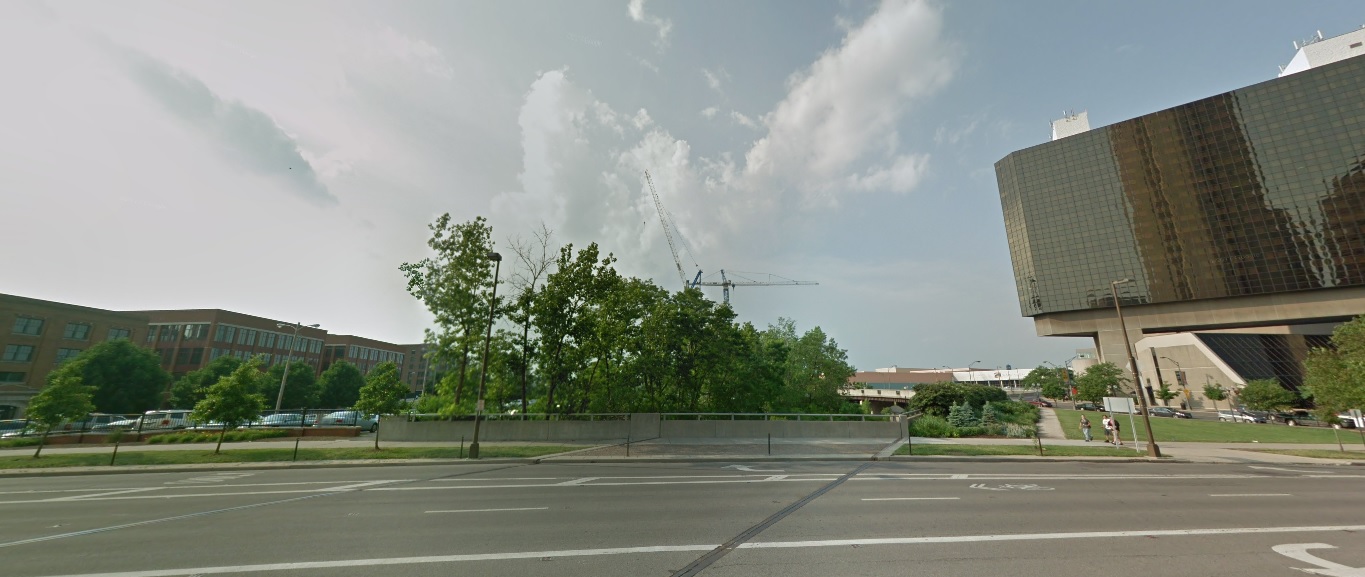
After: 2021
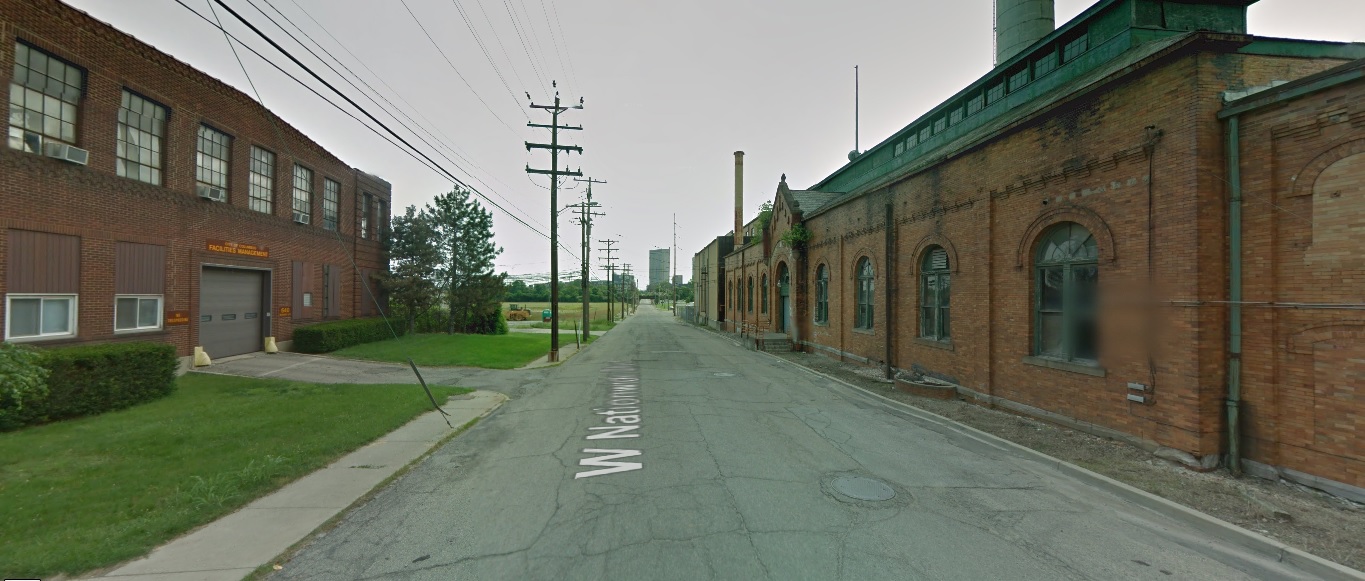
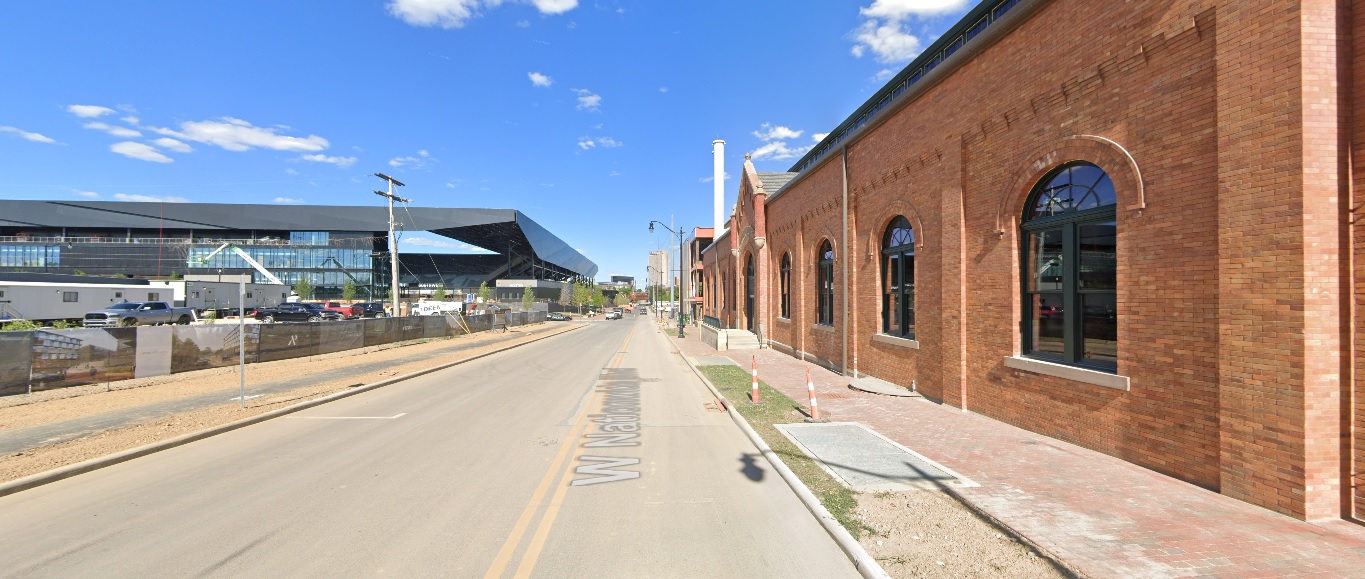
Nationwide Boulevard, looking east from the Olentangy River.
Before: 2011
After: 2021
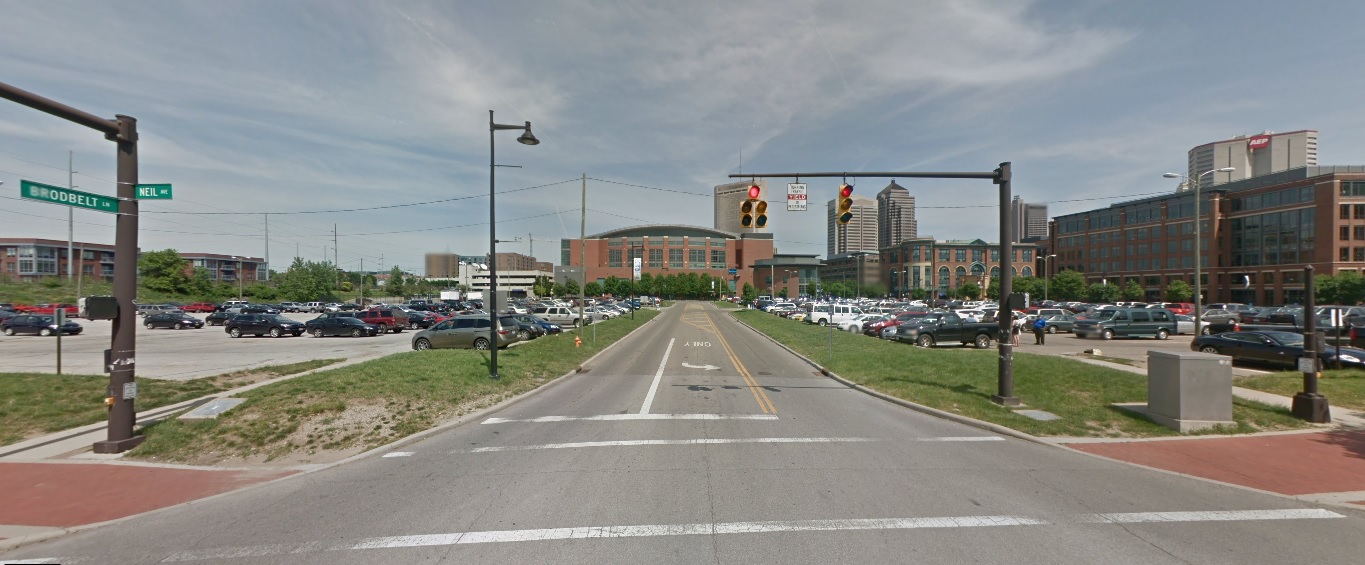
Spring Street, looking northeast from Neil Avenue.
Before: 2011
After: 2020
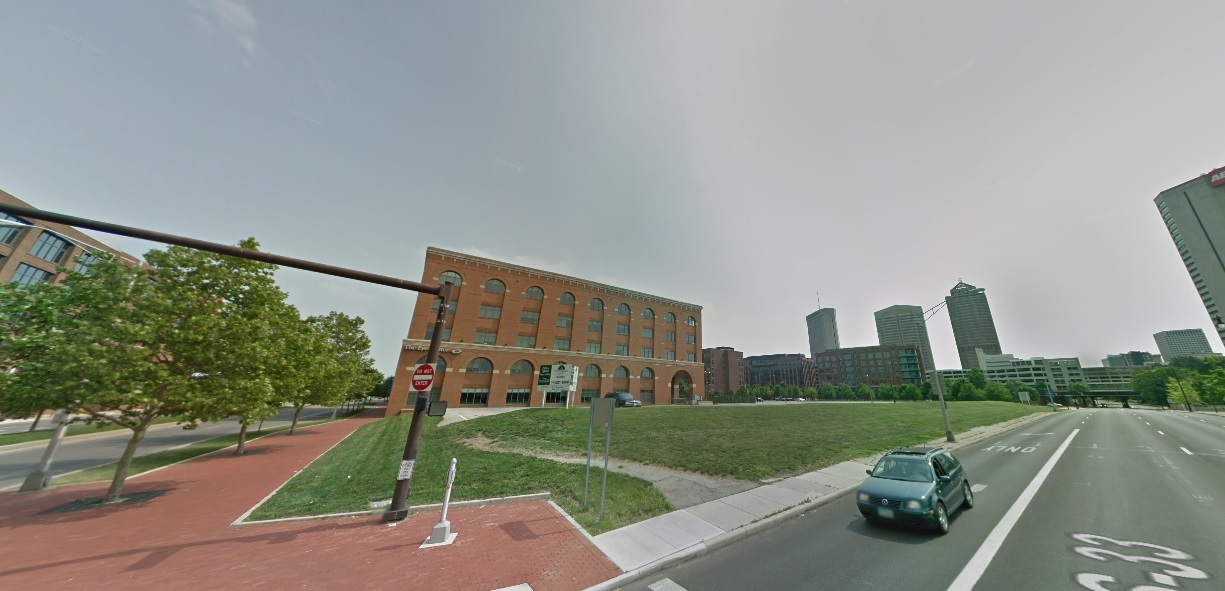
Spruce Street, looking south from 670.
Before: 2011
After: 2021
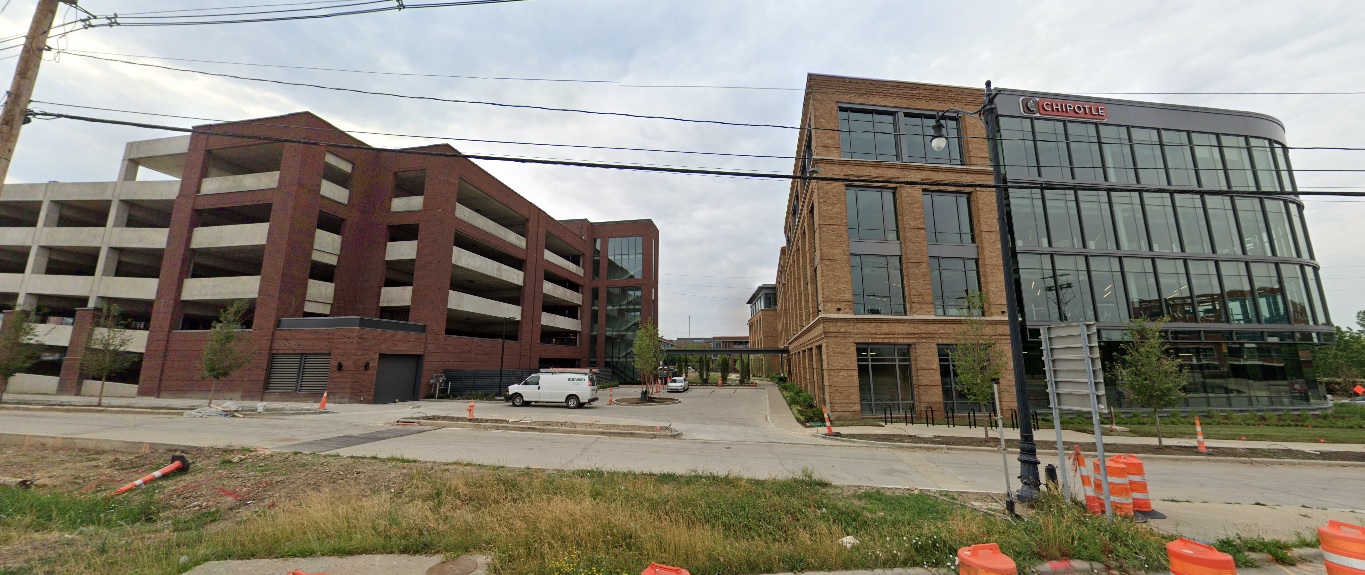
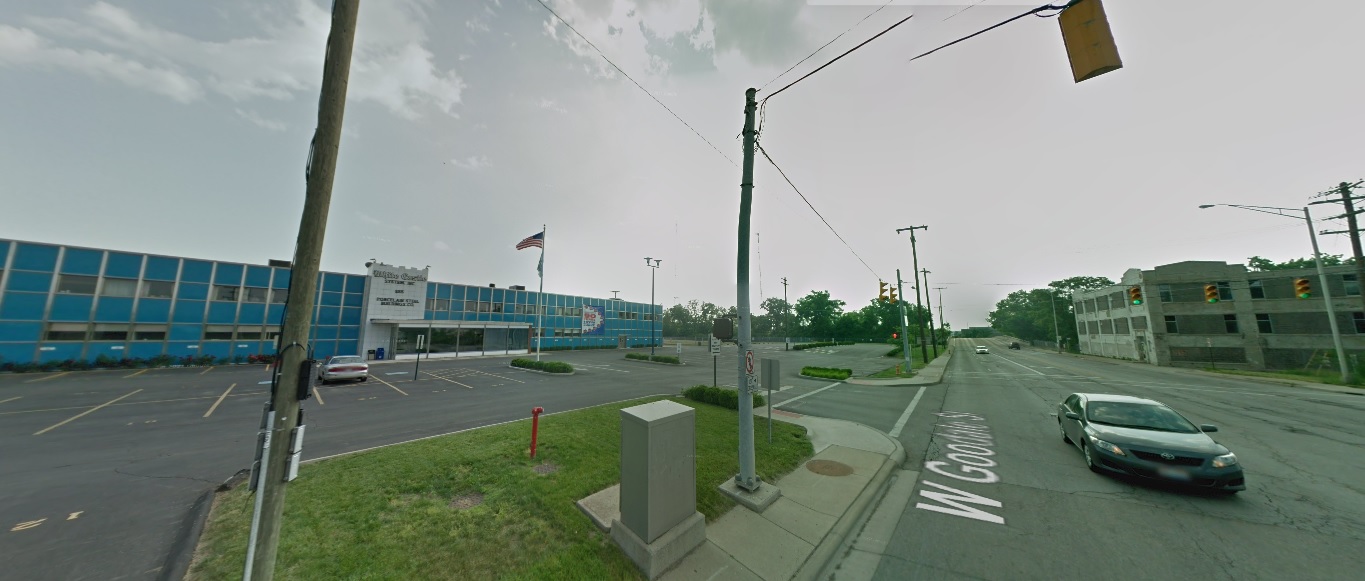
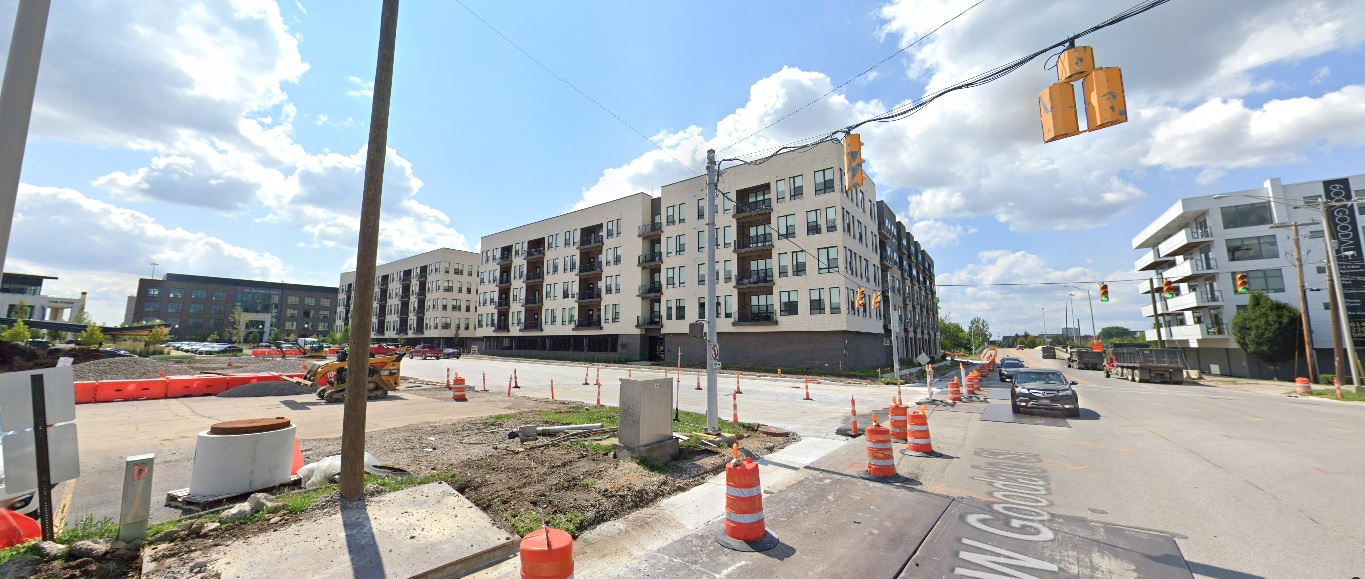
Goodale Street, looking west from the 315 Exit.
Before: 2011
After: 2021
Short North
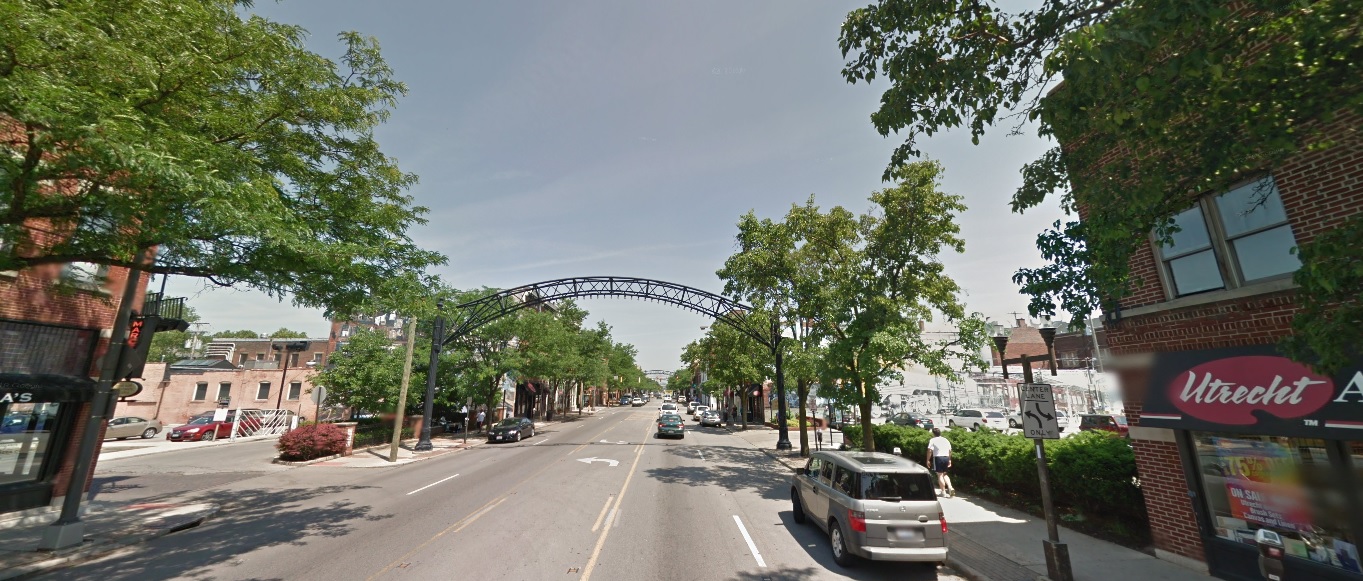
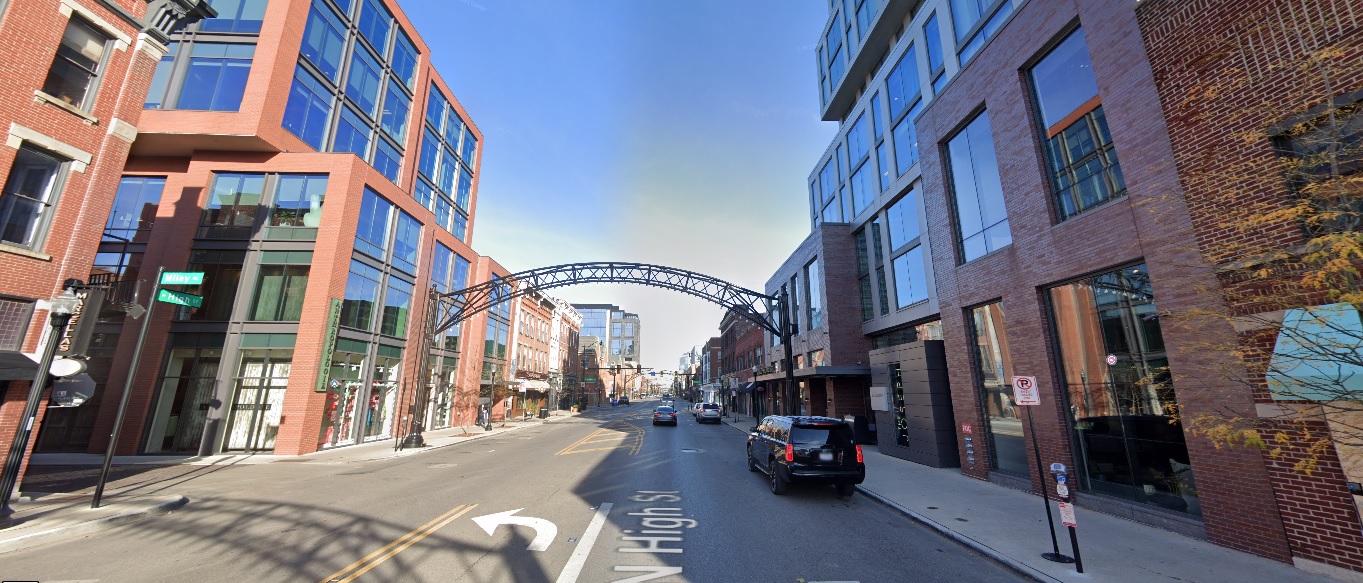
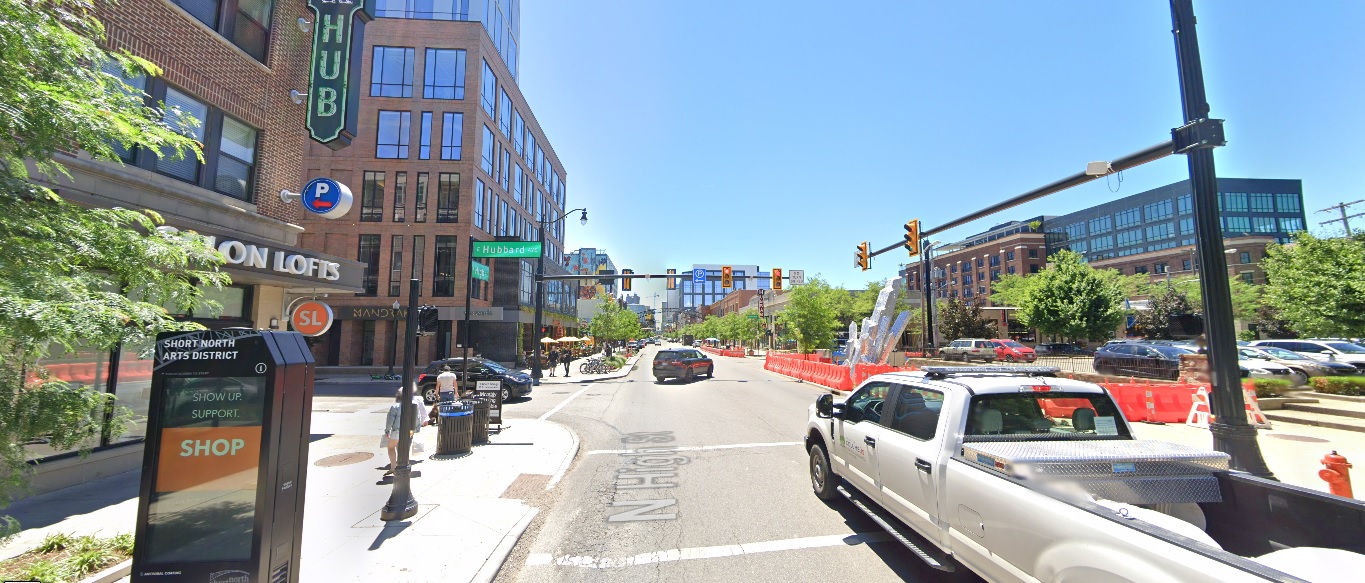
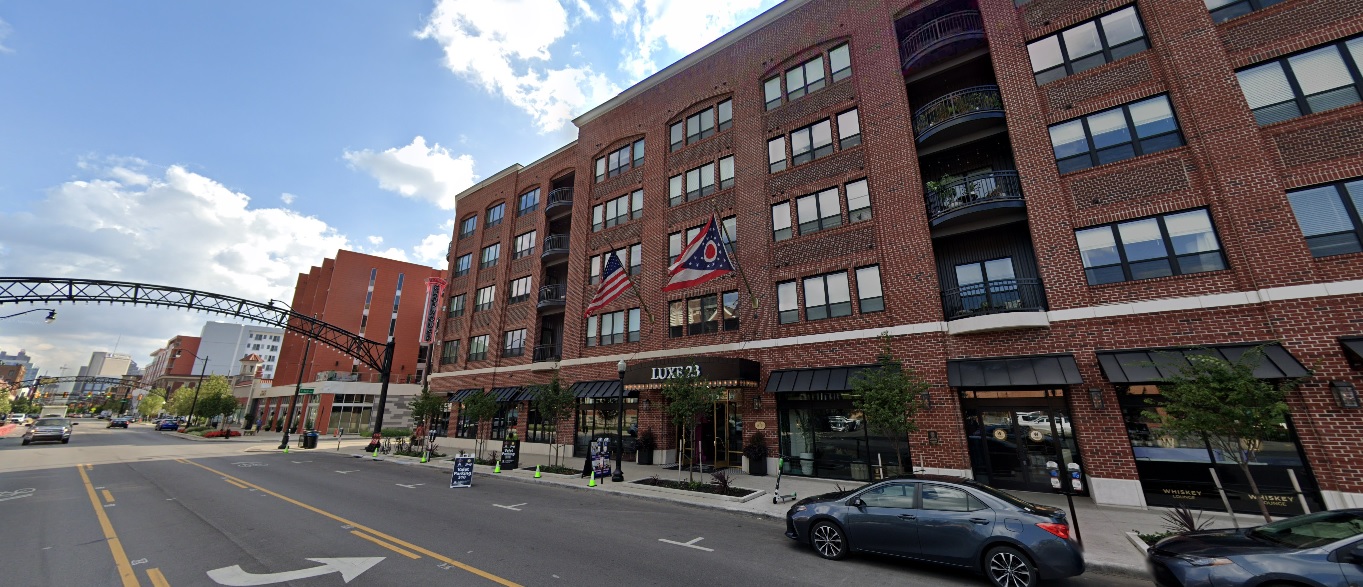
High Street, looking south just north of 3rd Avenue.
Before: 2009
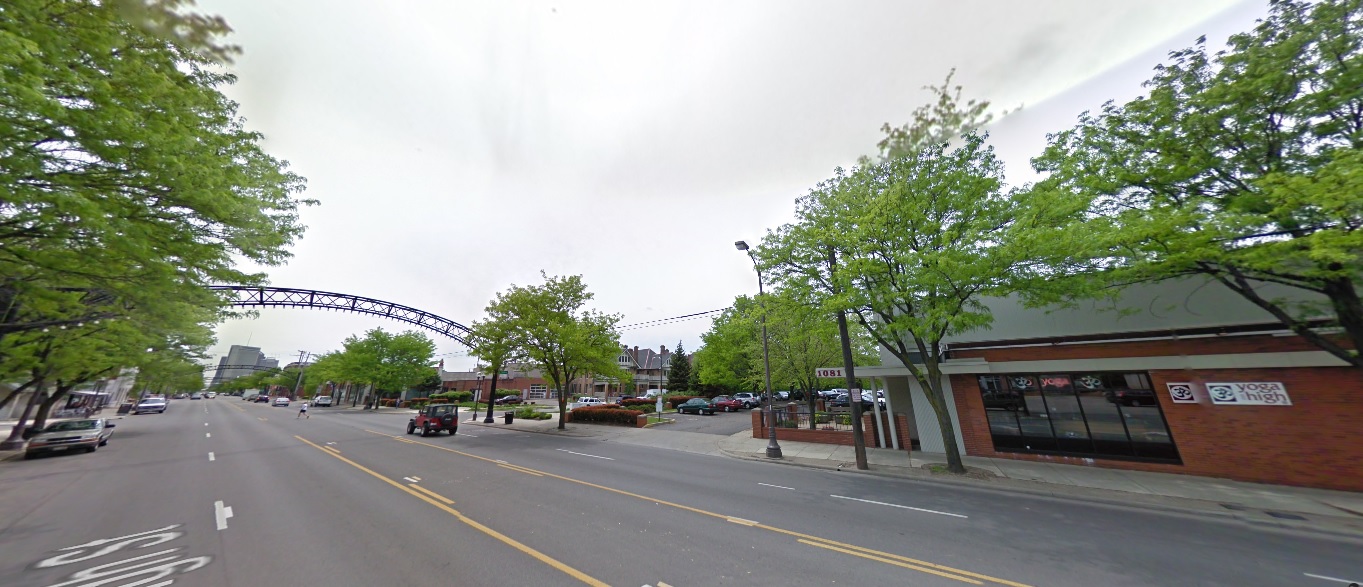
After: 2021
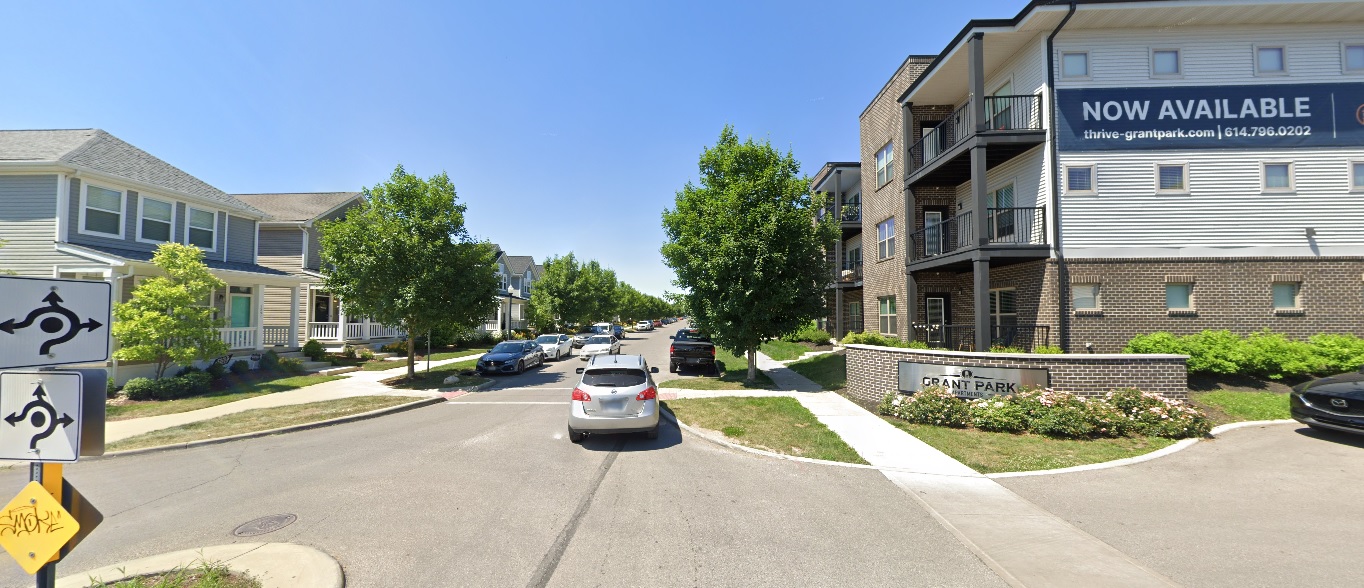
Weinland Park
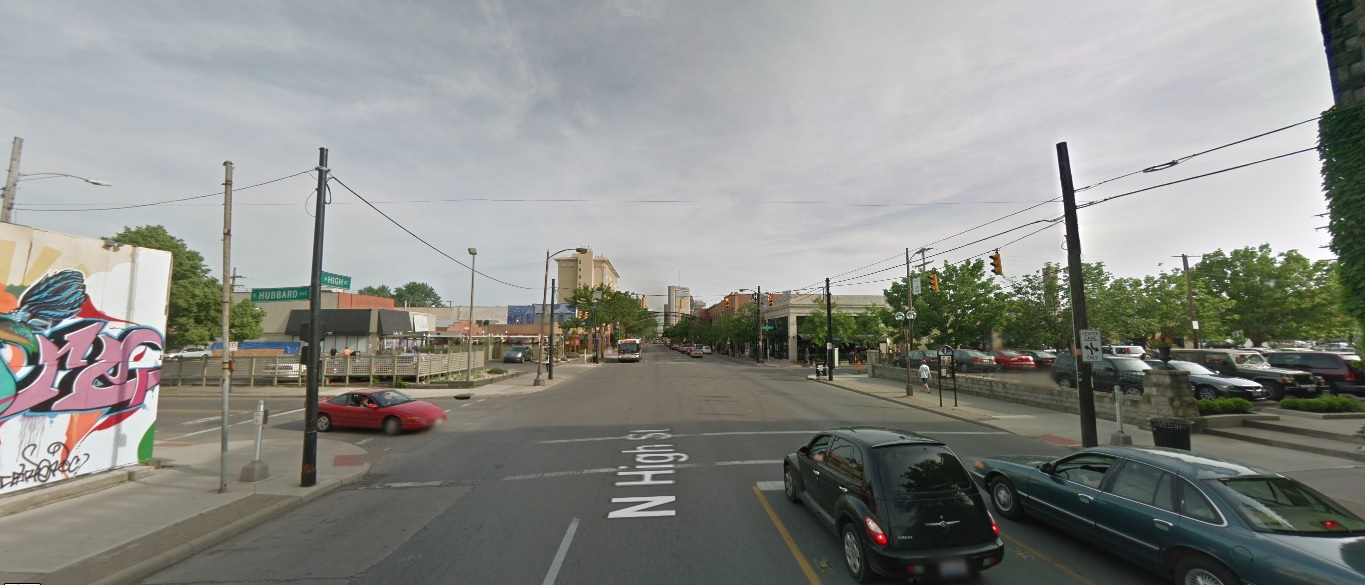
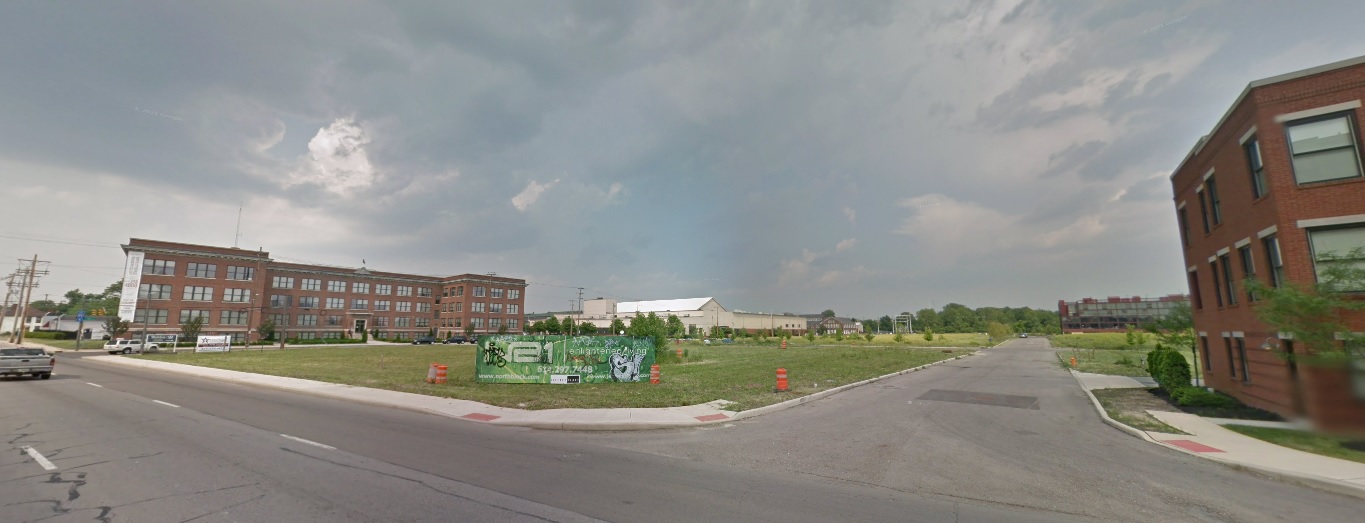
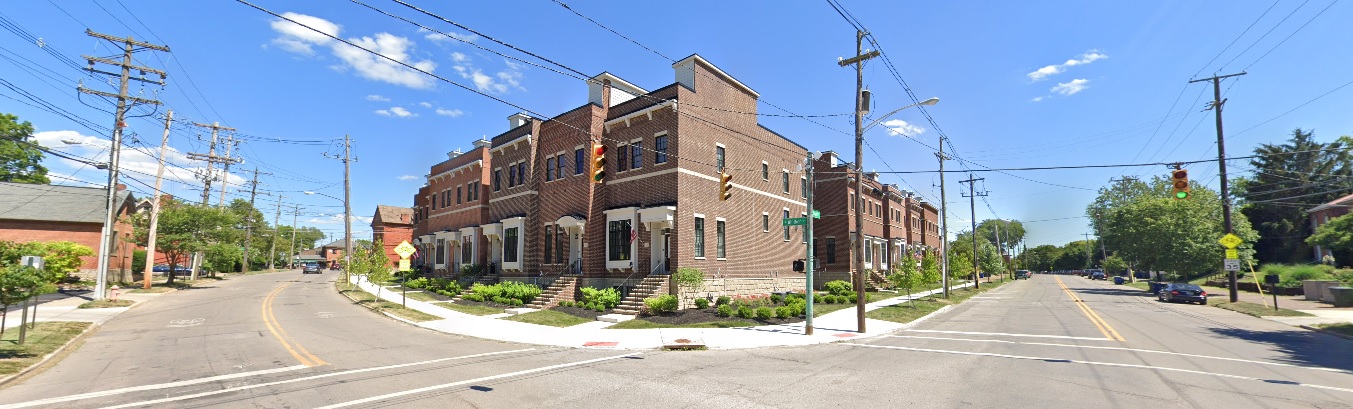
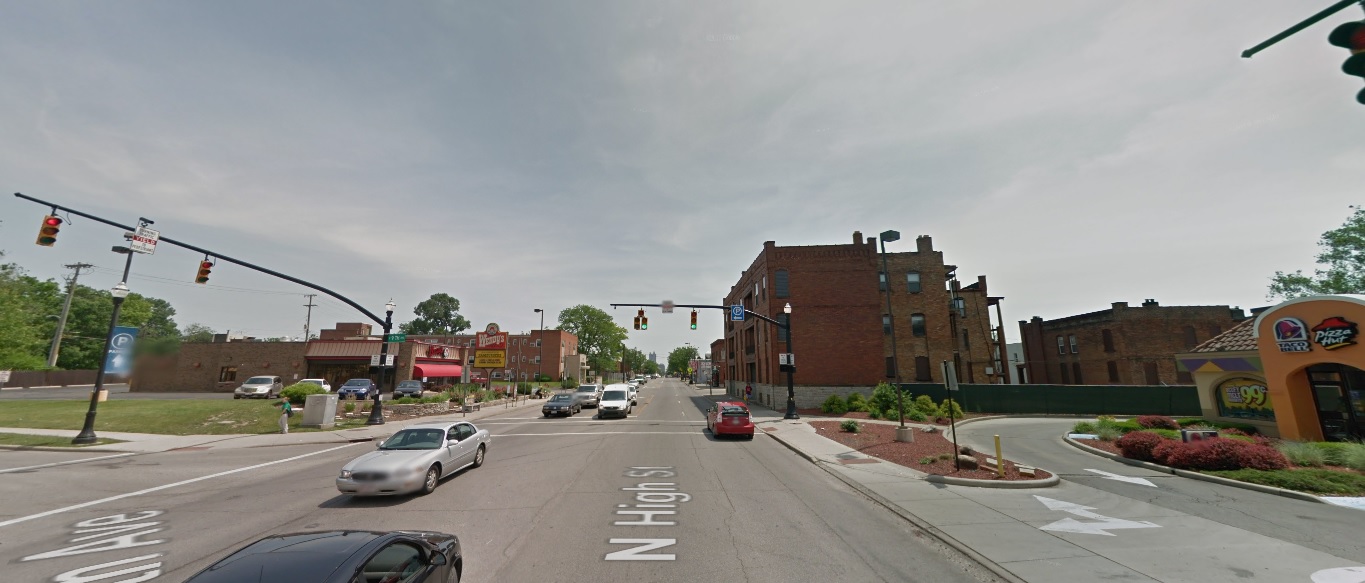
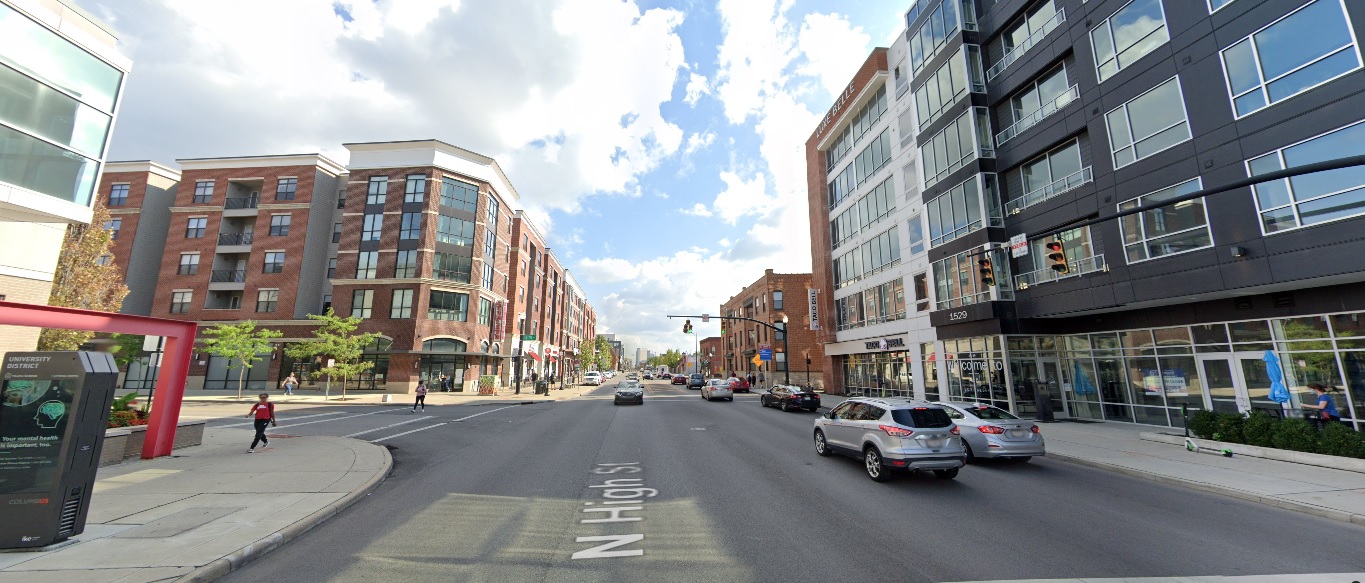
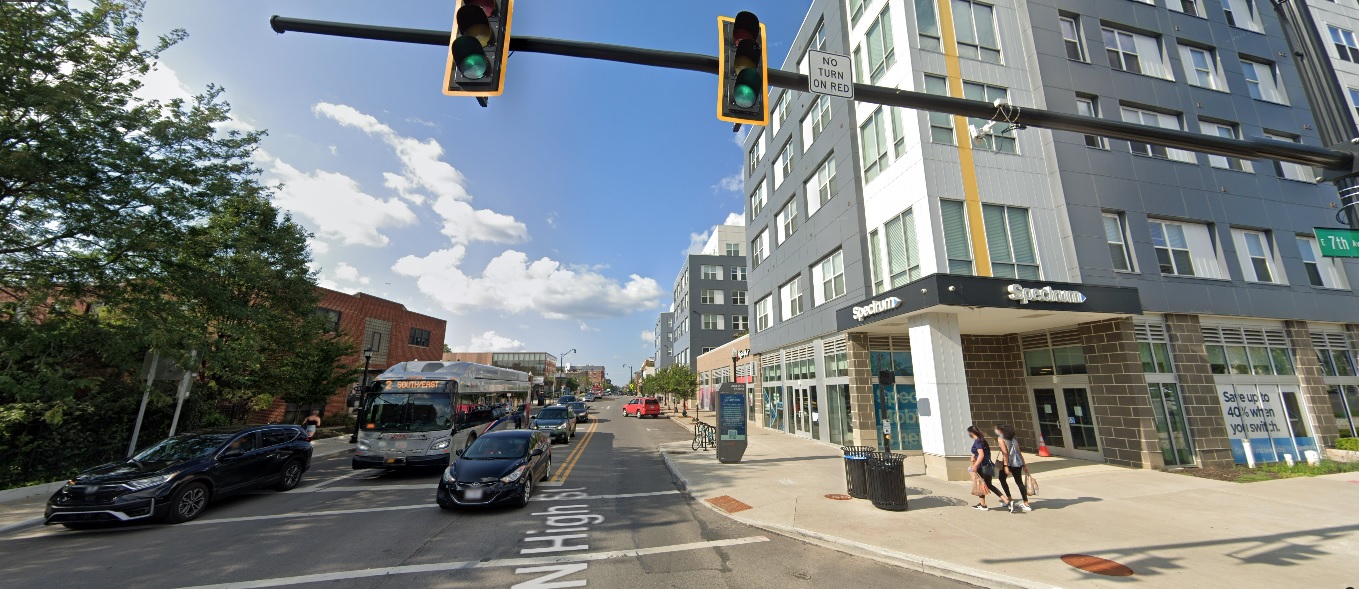
High Street, looking north at 7th Avenue.
Before: 2011
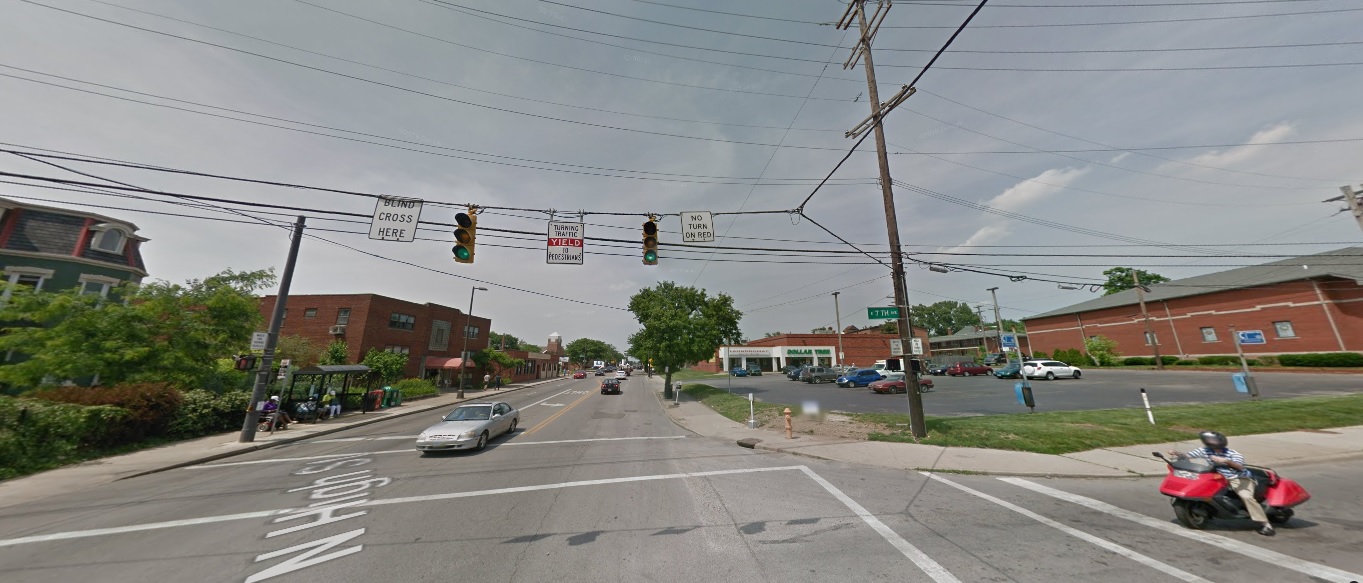
After: 2021
Italian Village
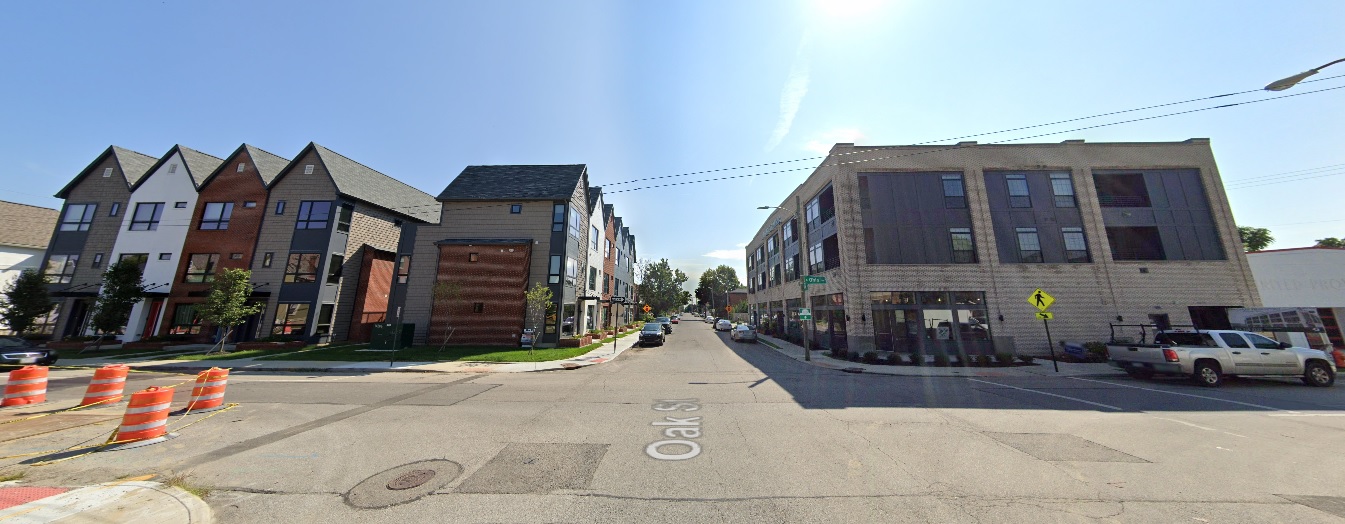
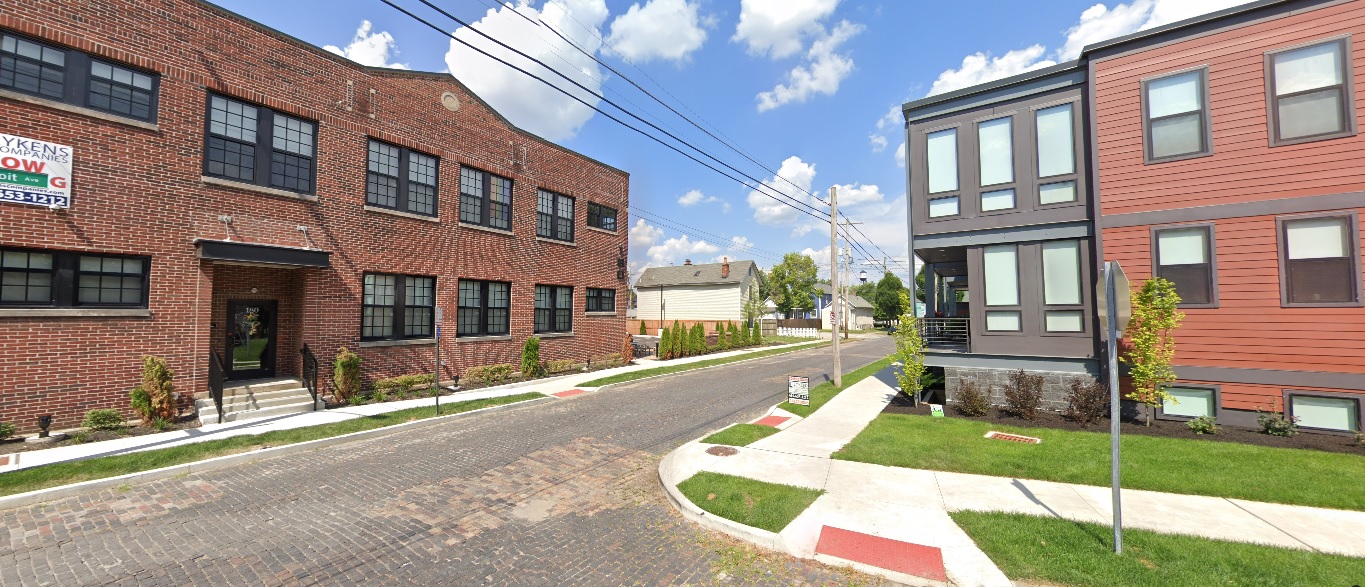
Detroit Avenue, looking east at Hamlet.
Before: 2009
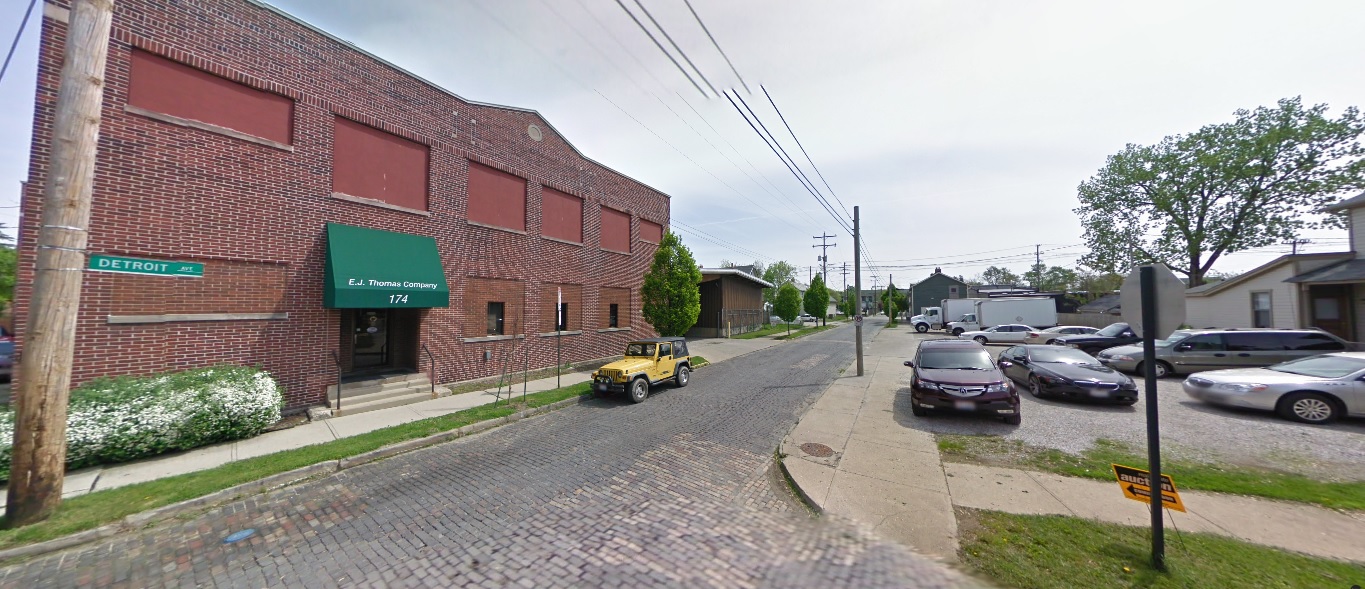
After: 2019
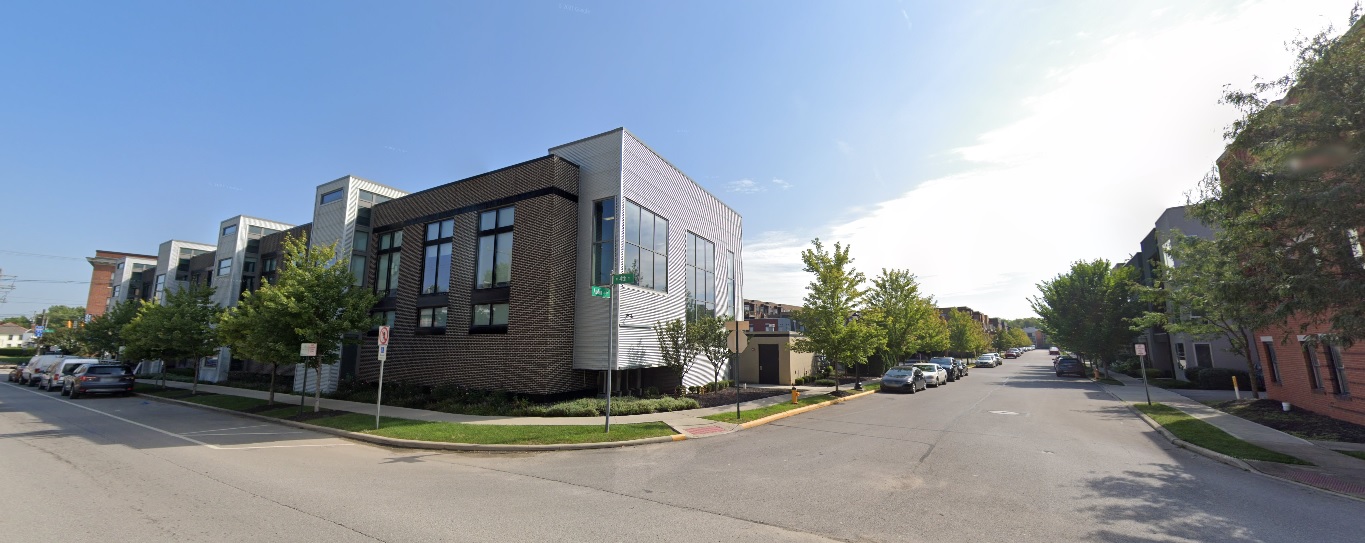
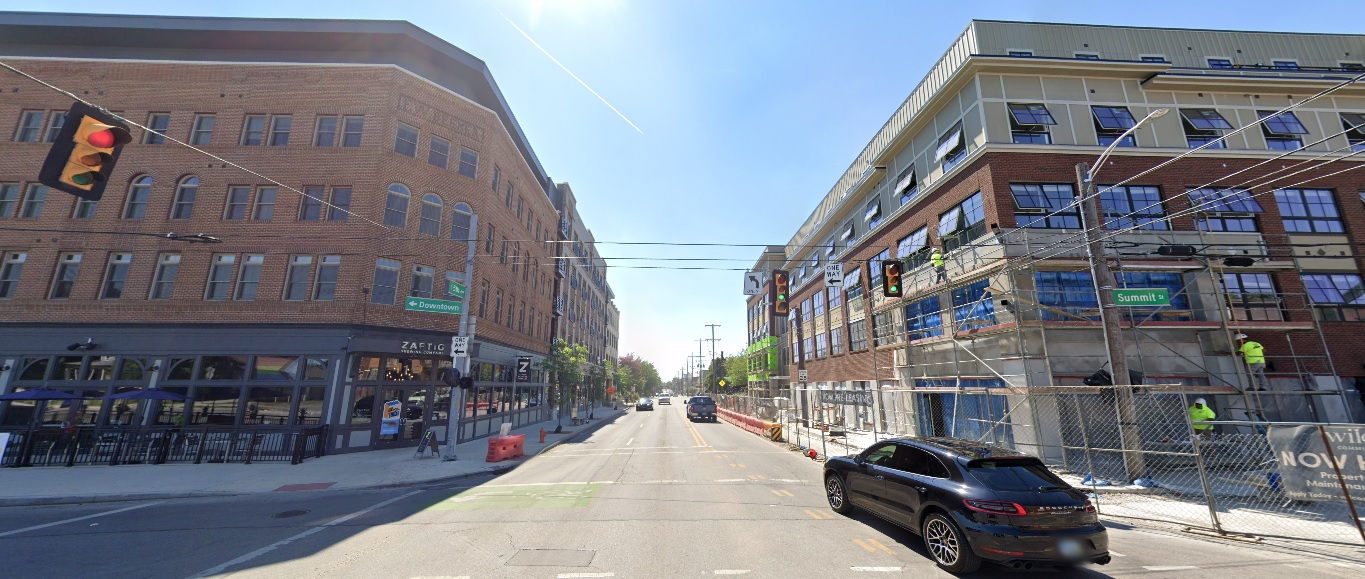
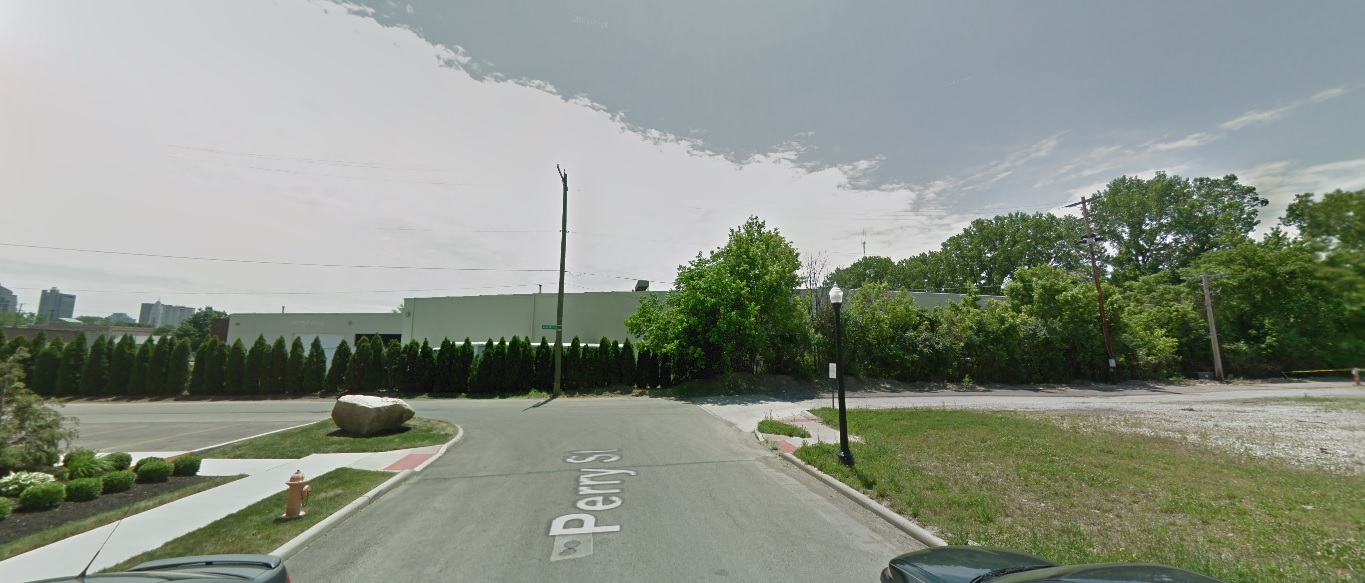
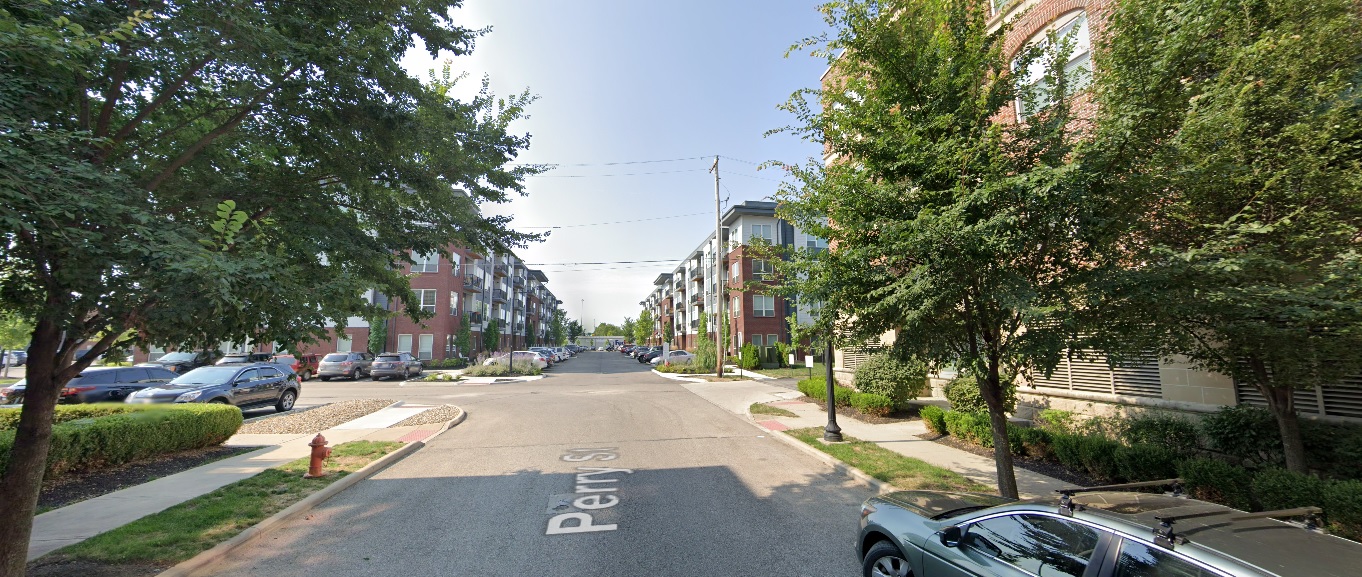
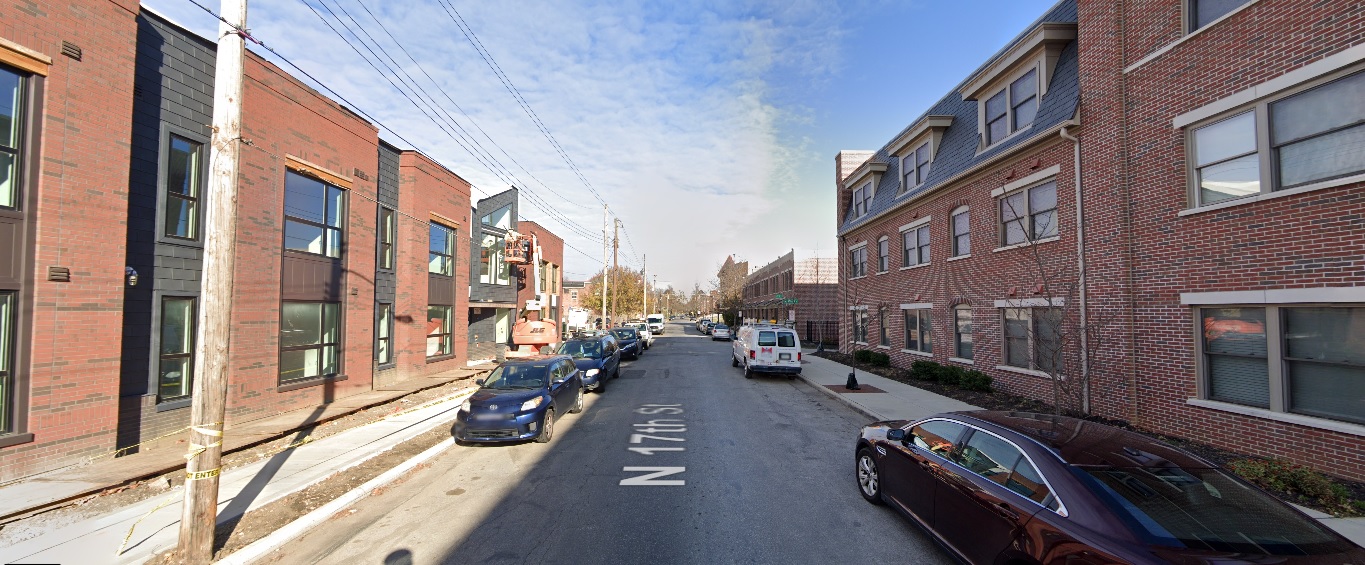
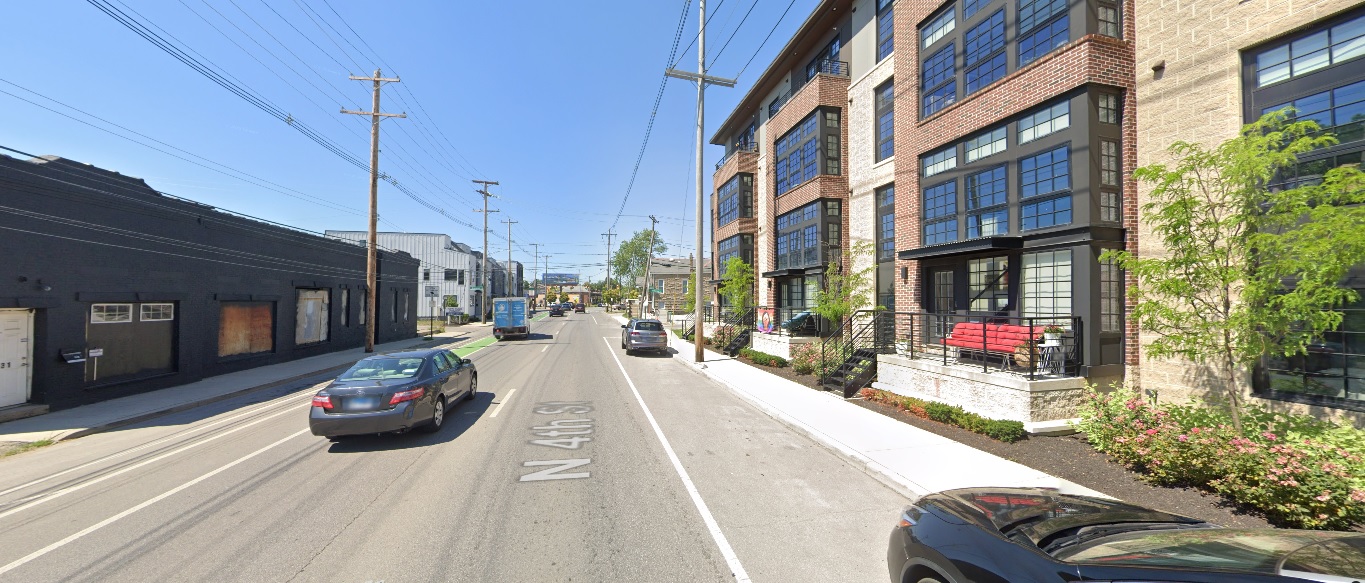
4th Street, looking north from 4th Avenue.
Before: 2011
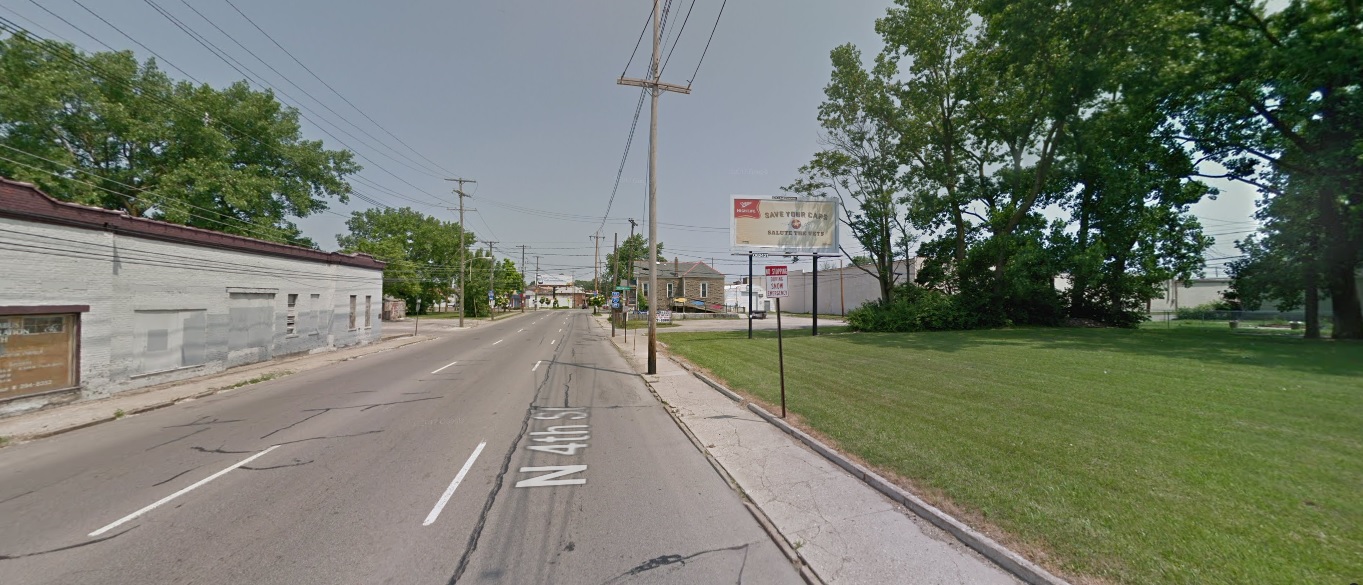
After: 2021
OSU Campus
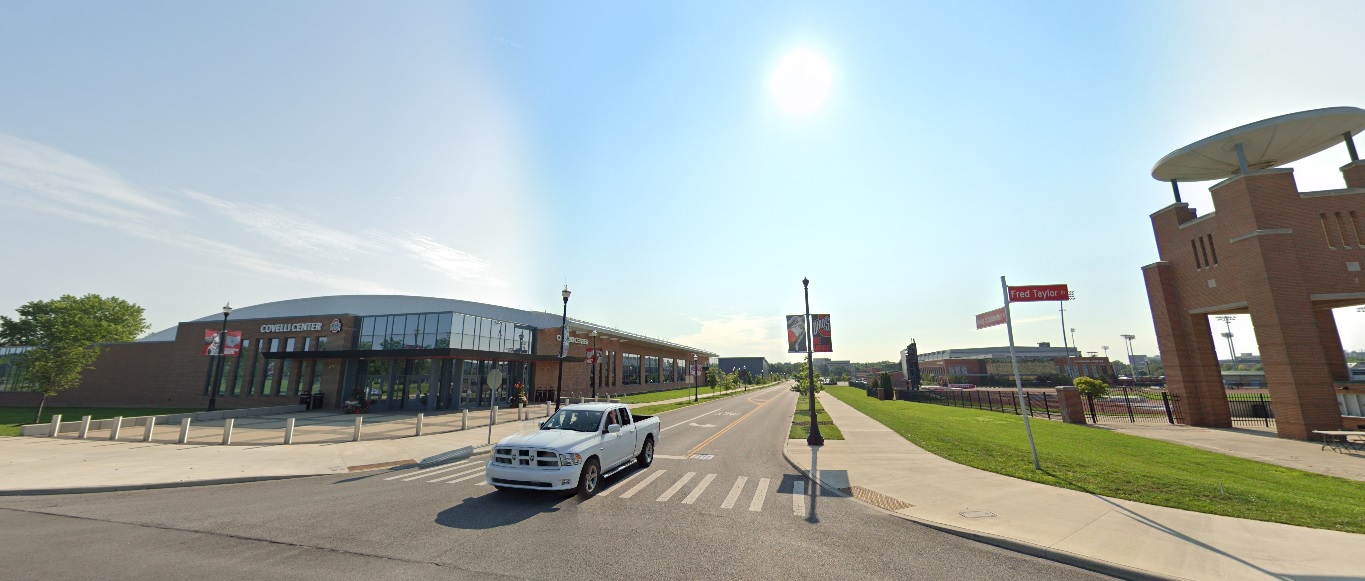
Fred Taylor Drive, looking east at Defiance Drive.
Before: 2011
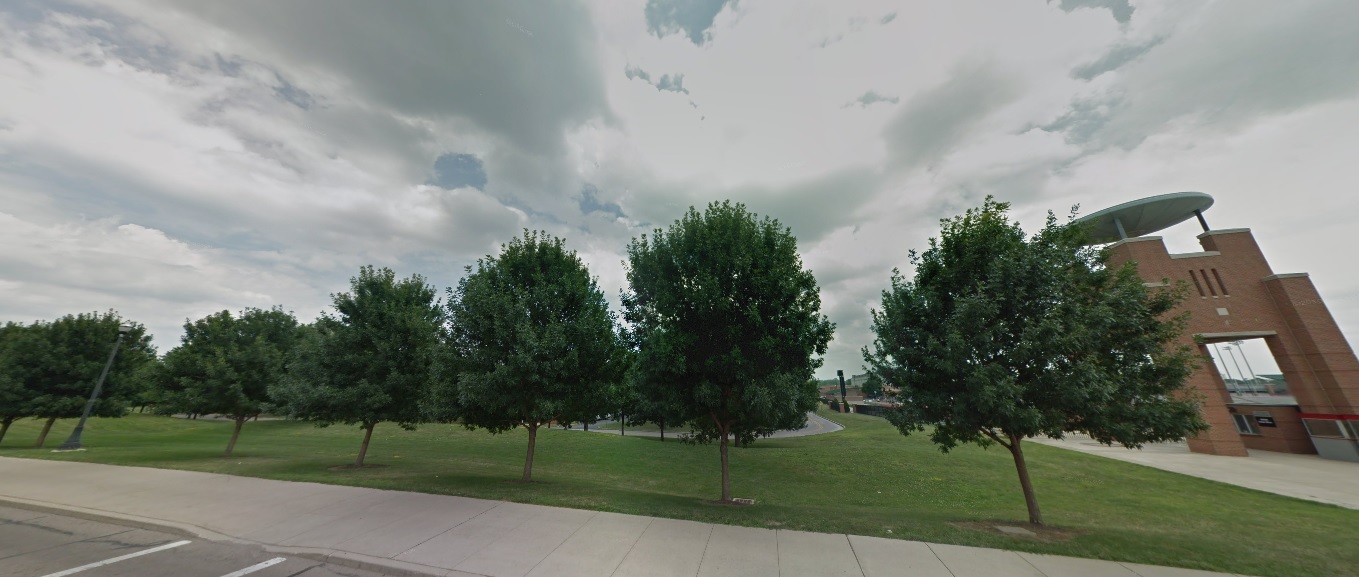
After: 2021
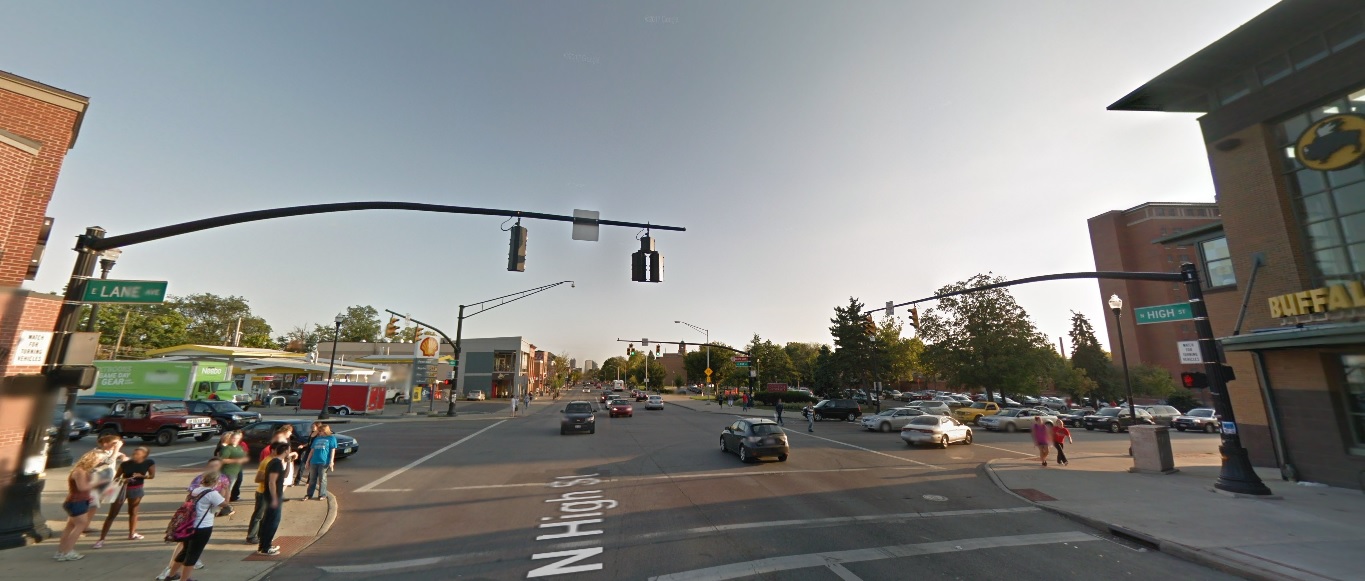
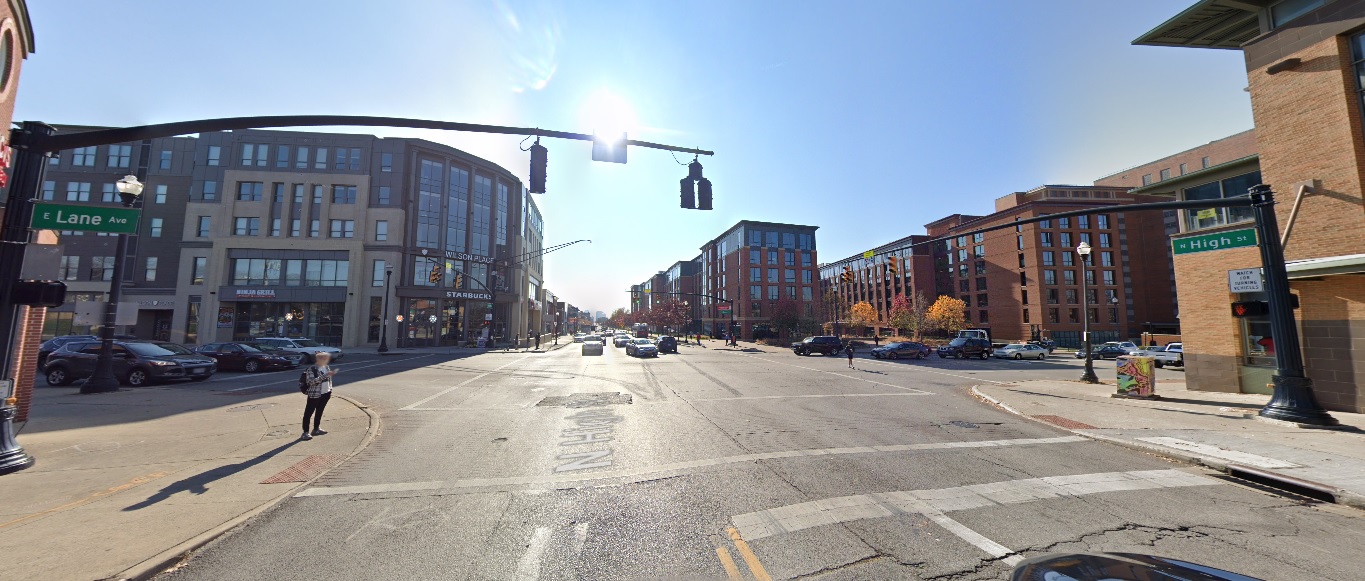
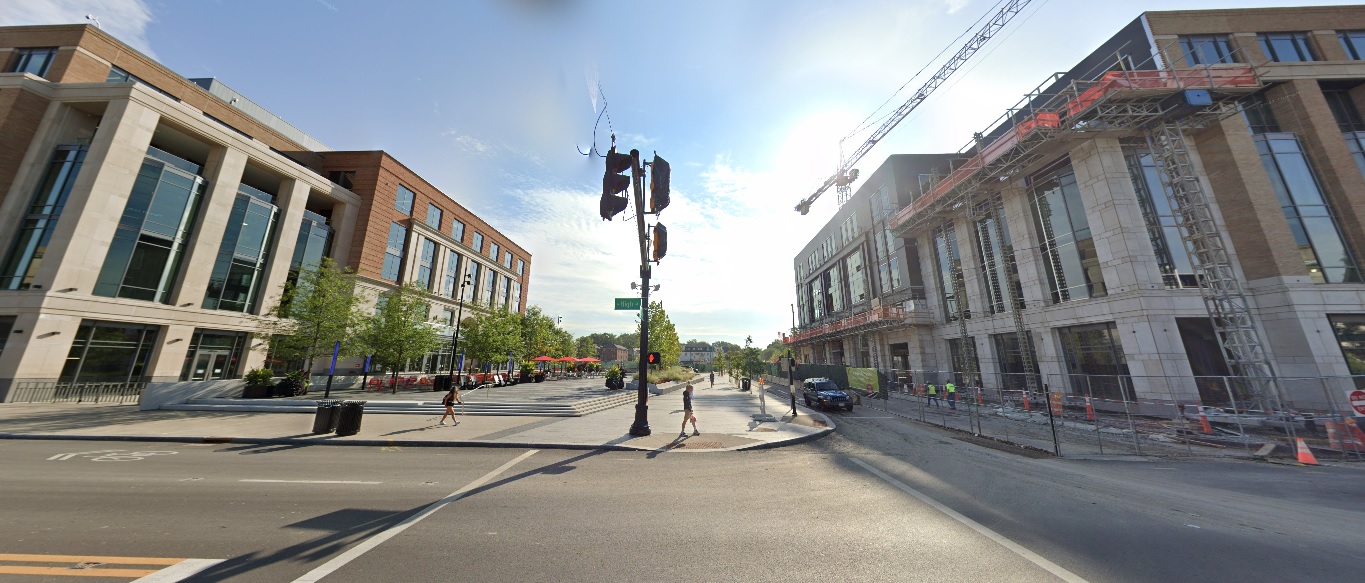
High Street, looking east at 15th Avenue.
Before: 2011
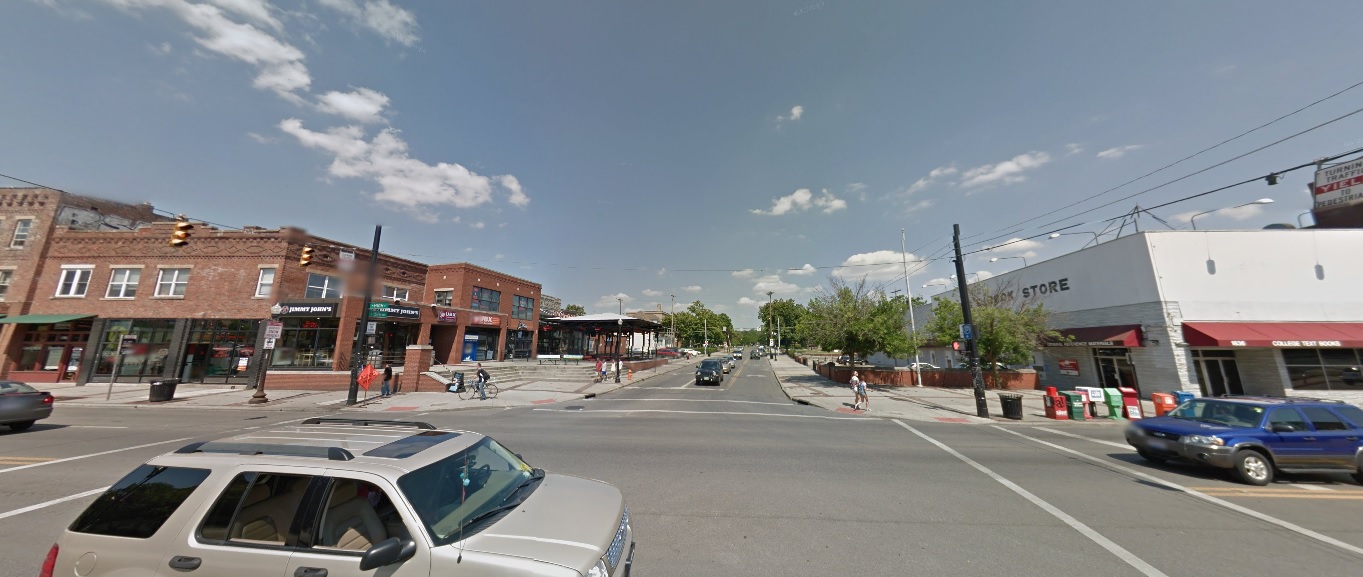
After: 2021
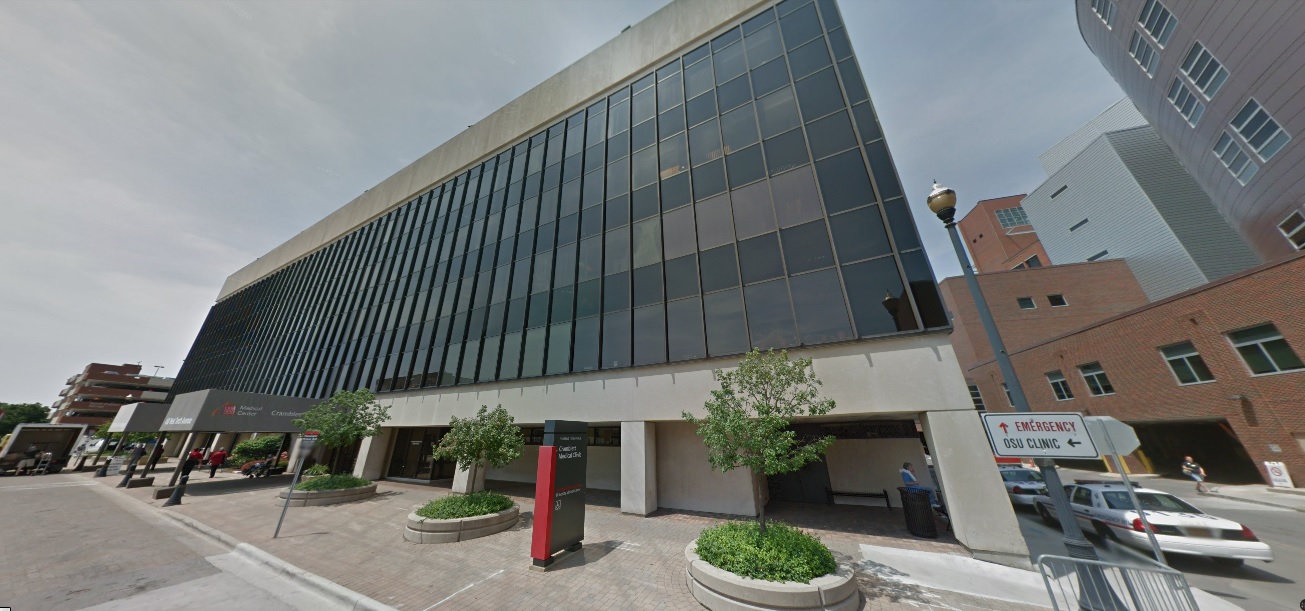
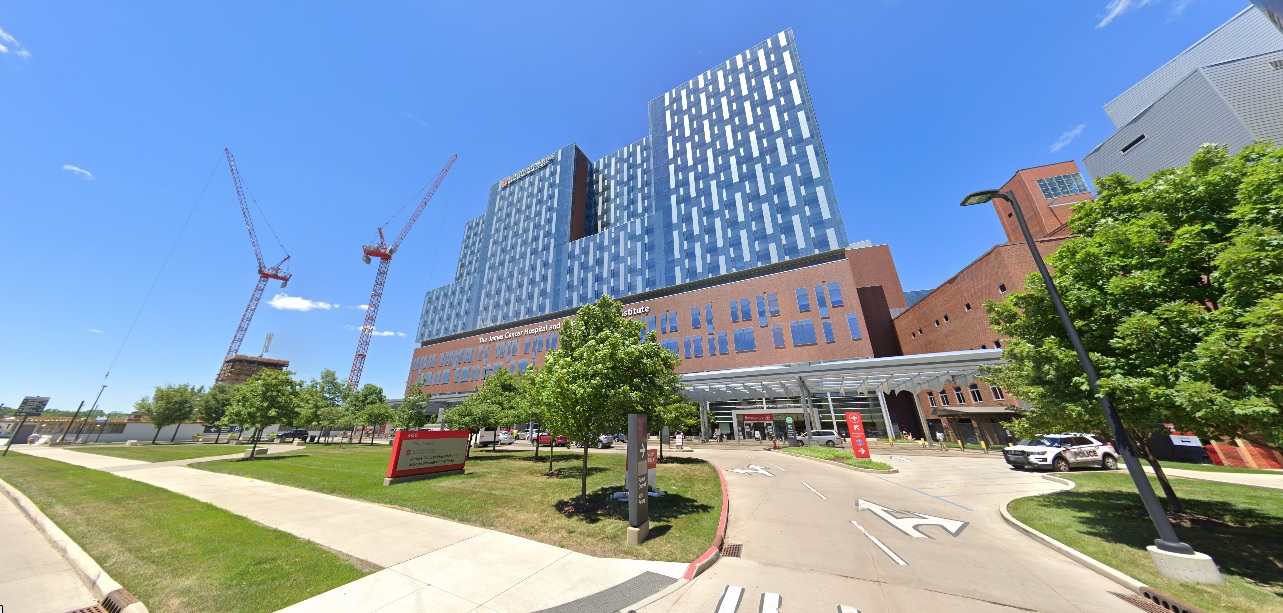
Medical Center Drive, looking north at Old Cannon Drive.
Before: 2009
After: 2021
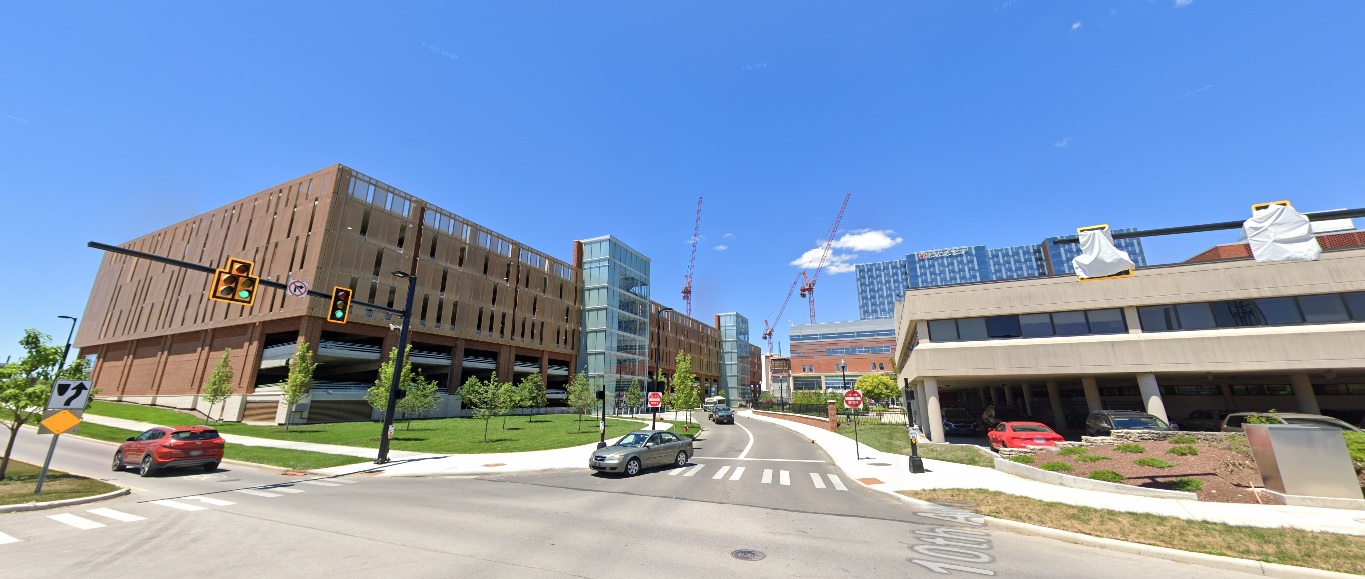
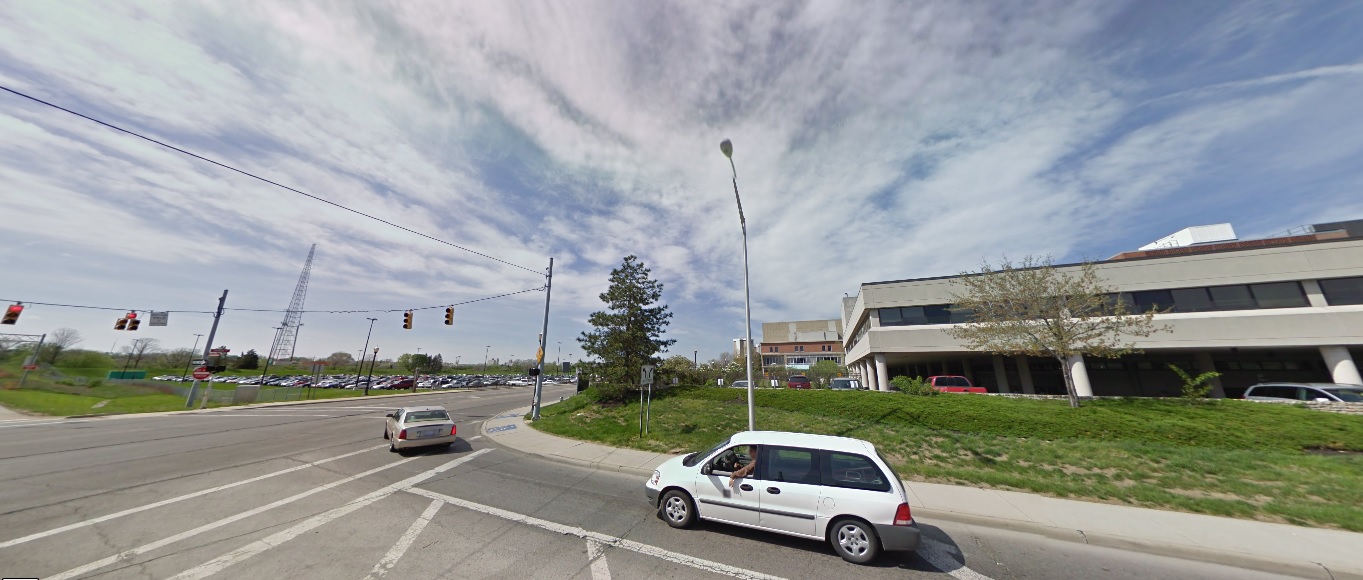
Olentangy River Road, looking west at J Edward Weaver Memorial Drive.
Before: 2011
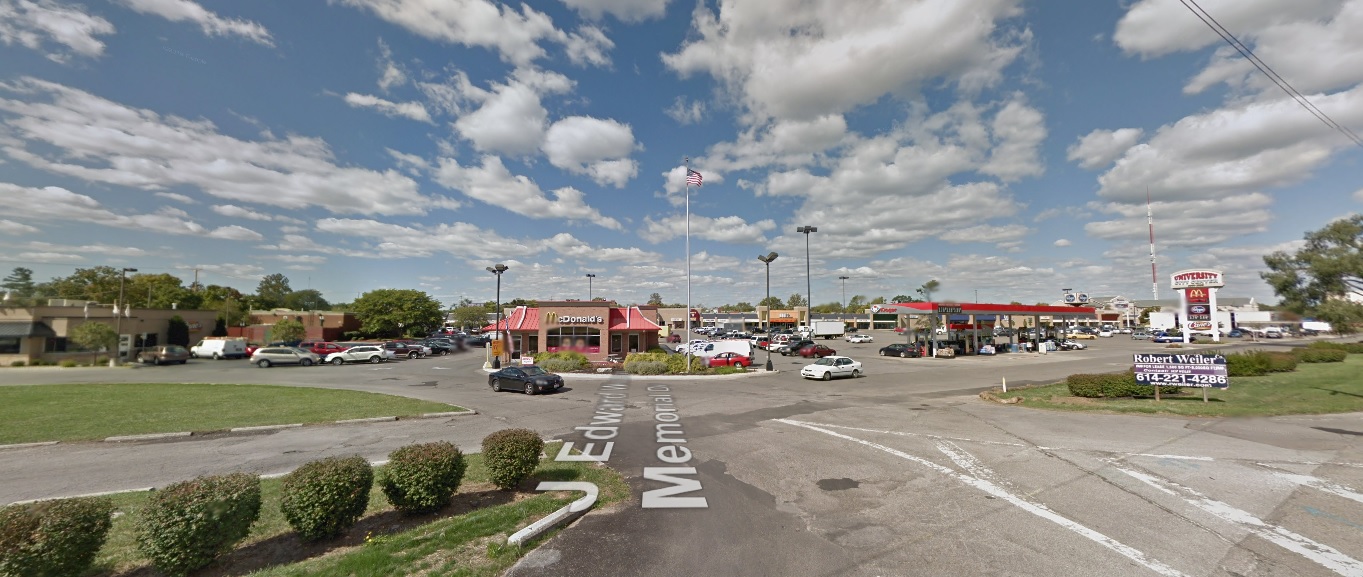
After: 2021
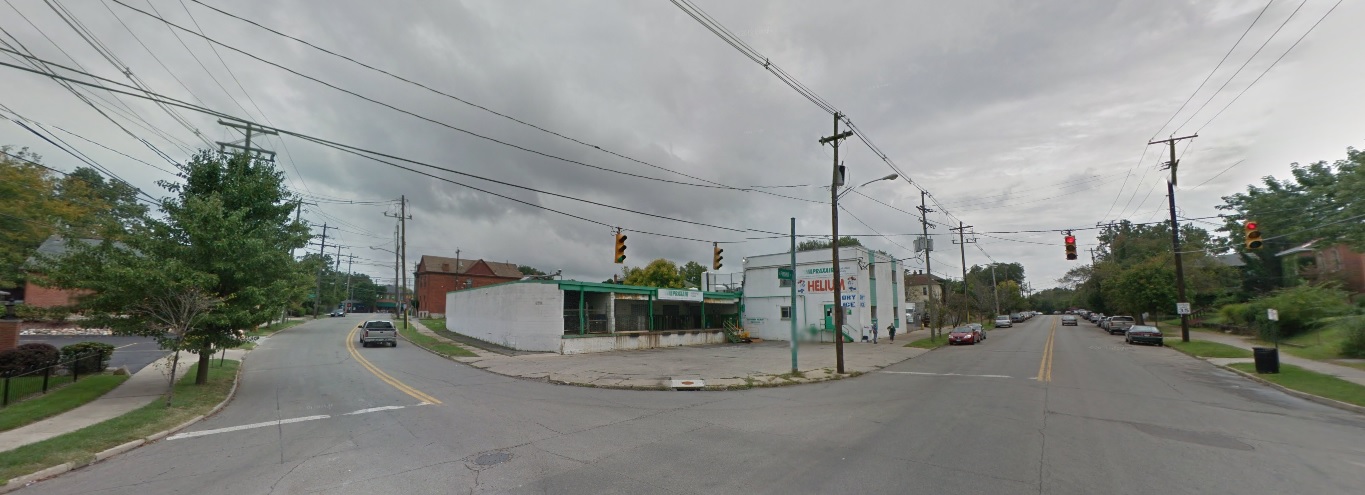
Milo-Grogan
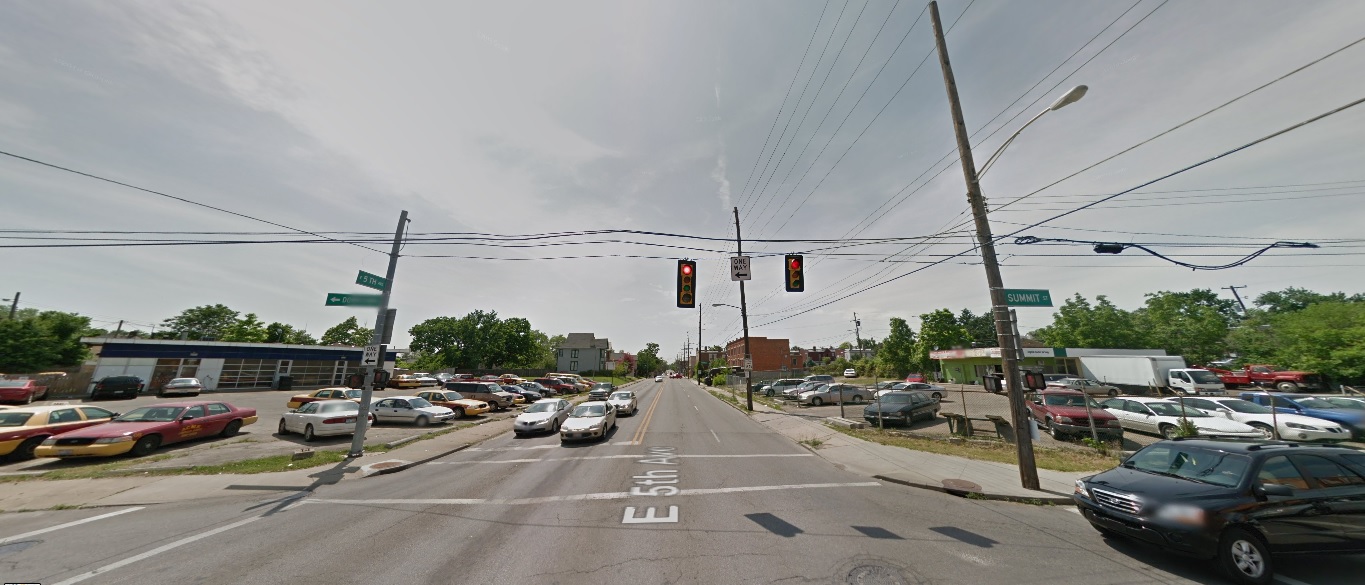
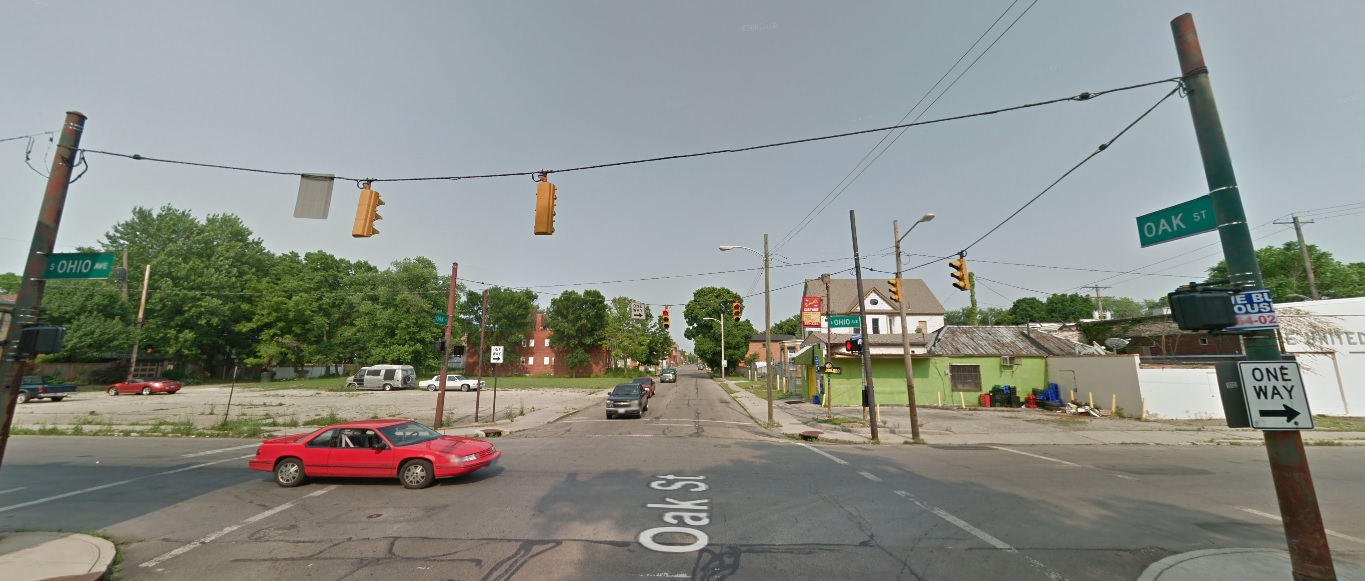
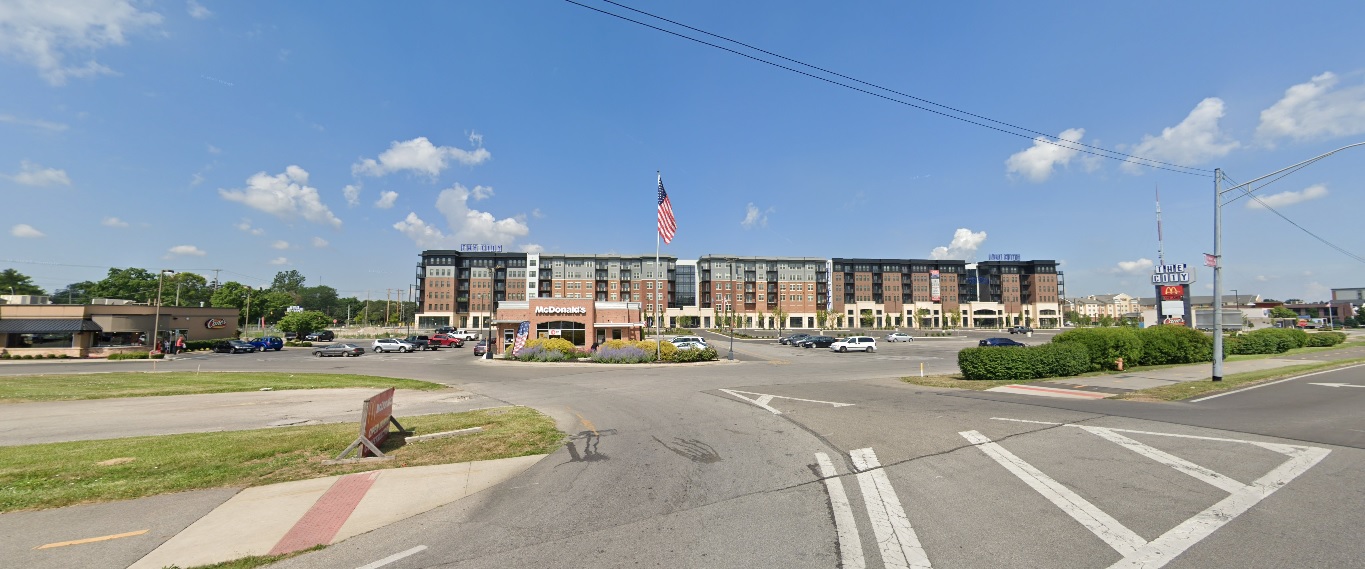
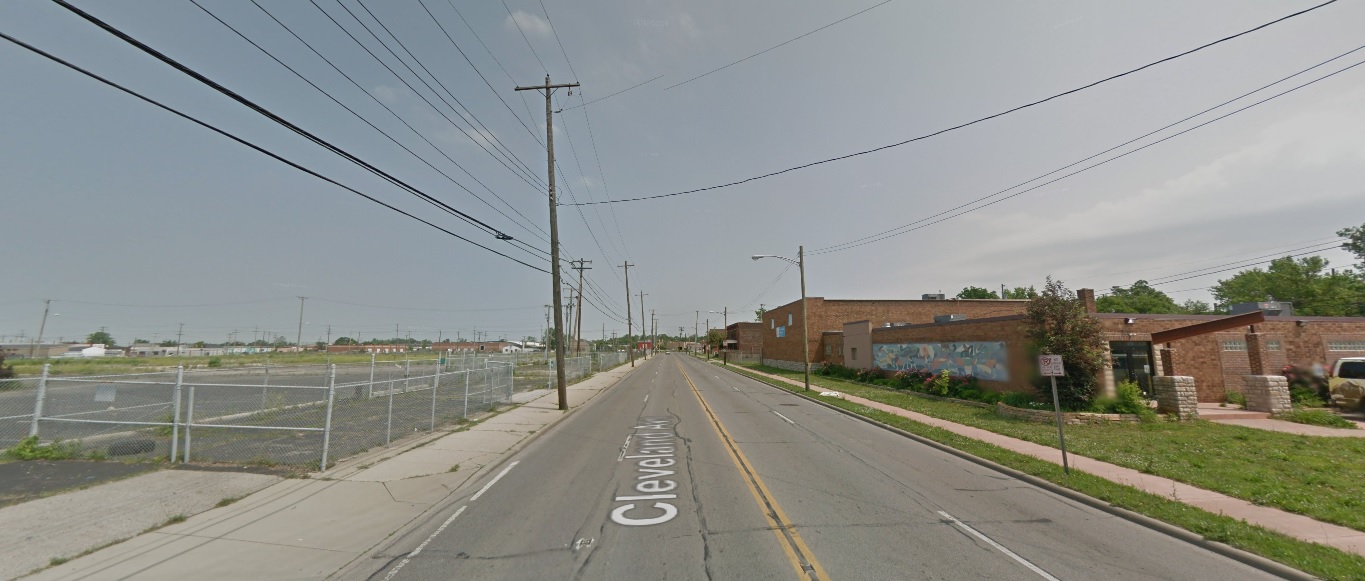
Cleveland Avenue, looking north towards 5th Avenue.
Before: 2011
After: 2021
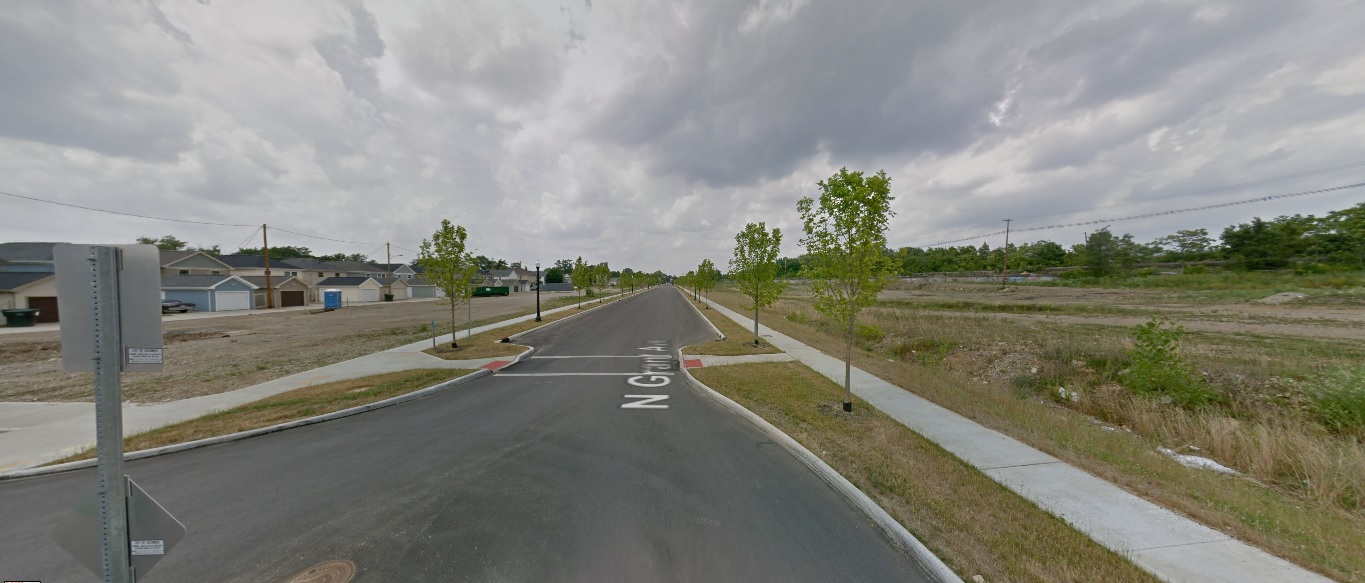
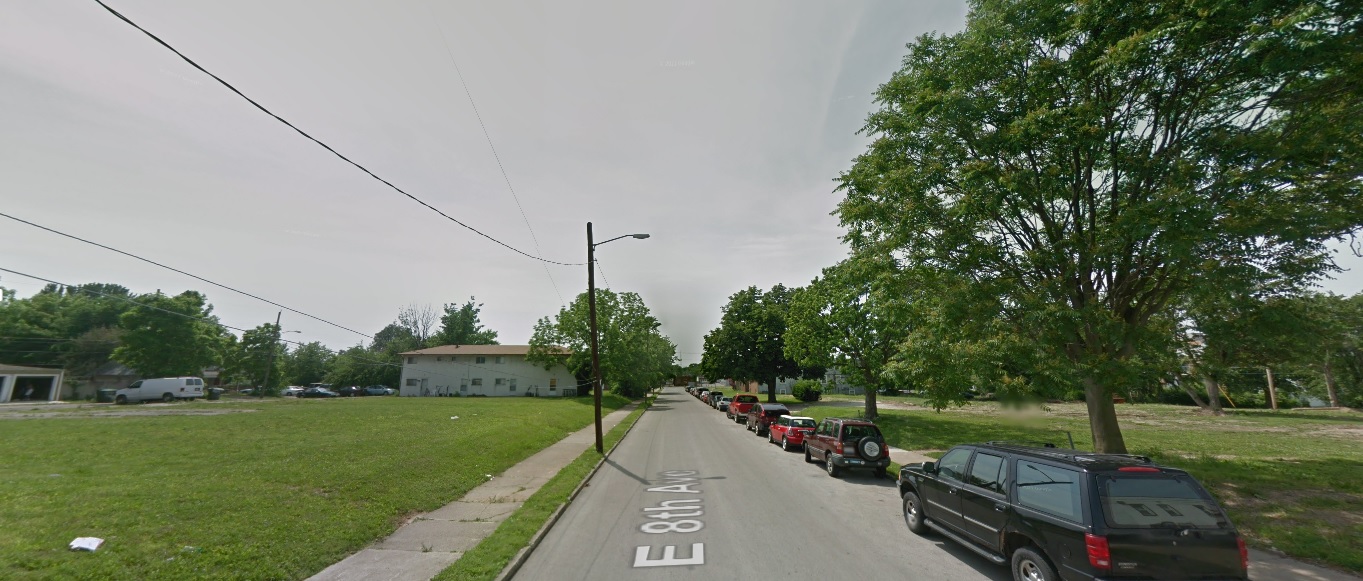
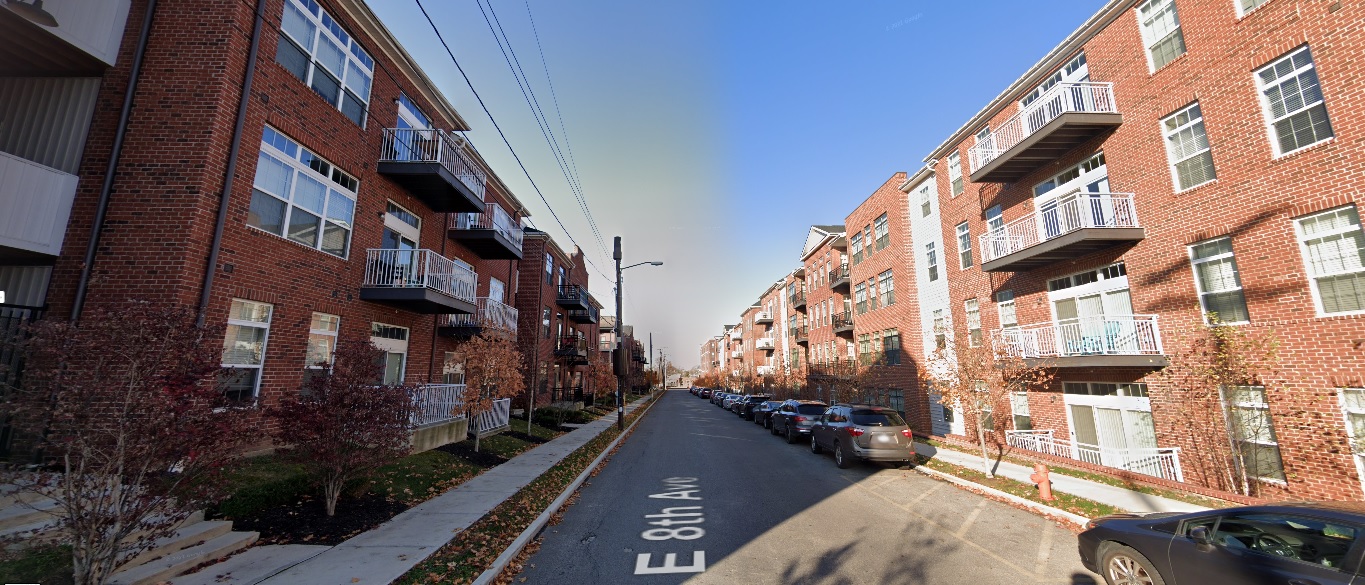
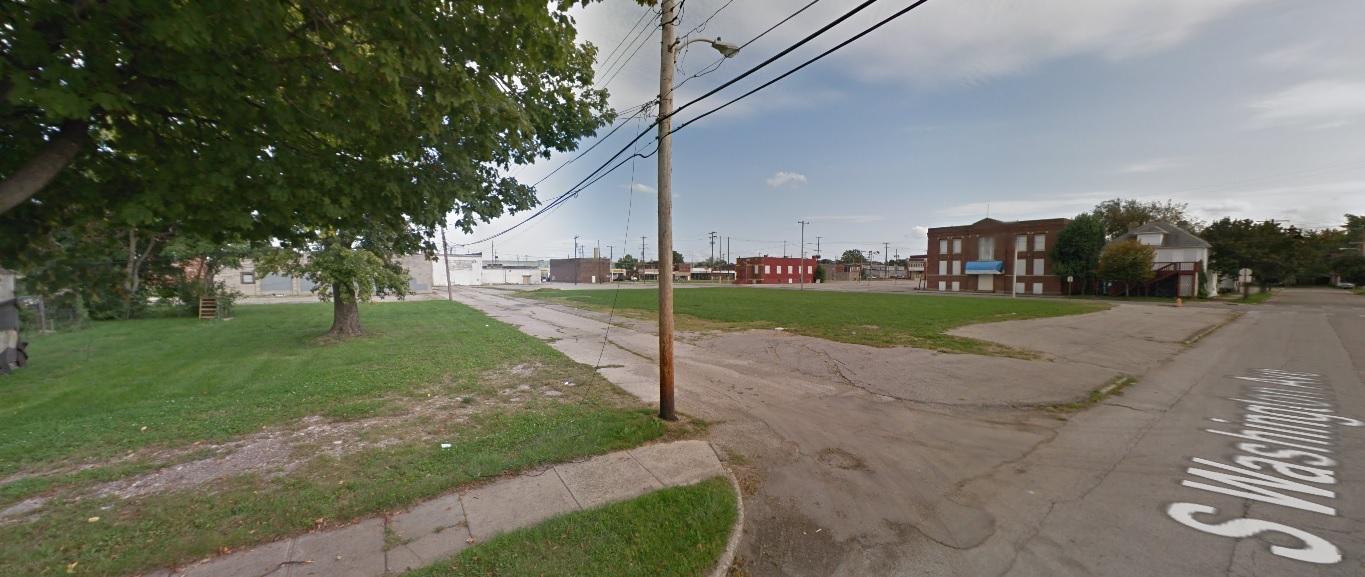
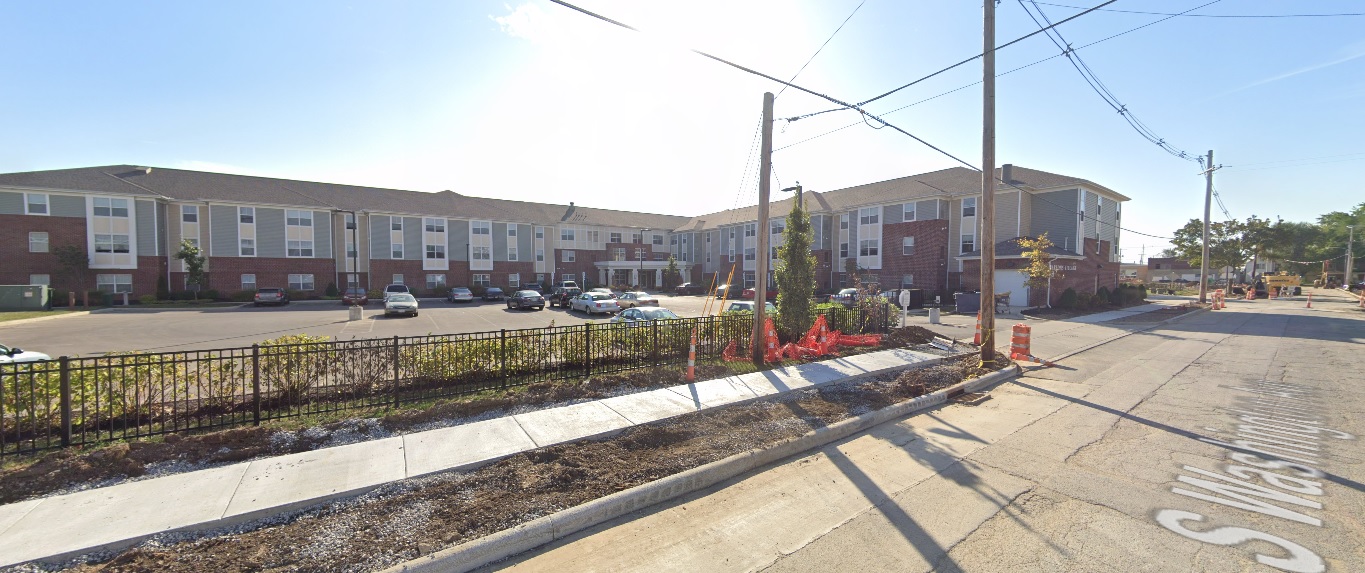
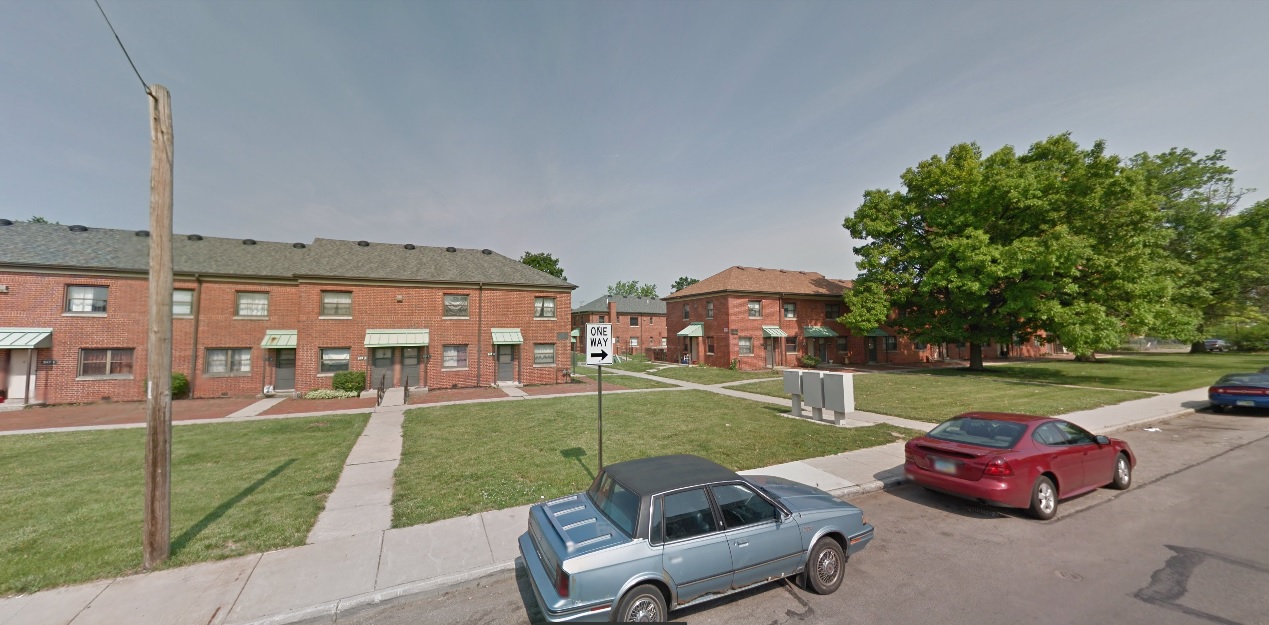
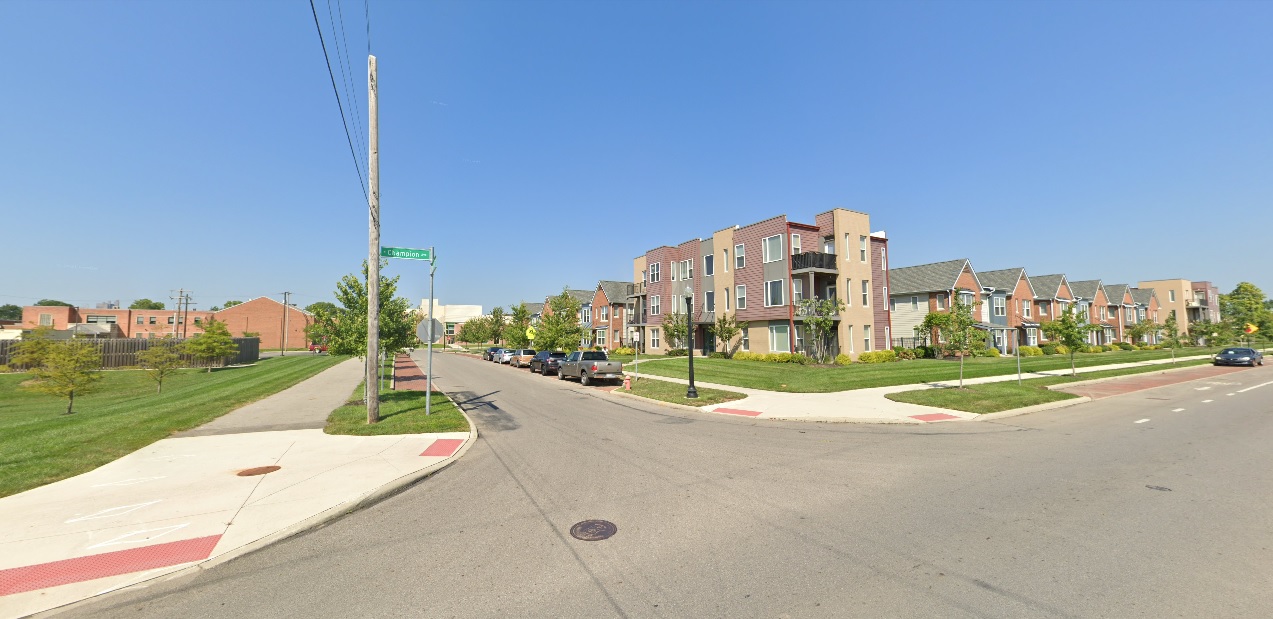
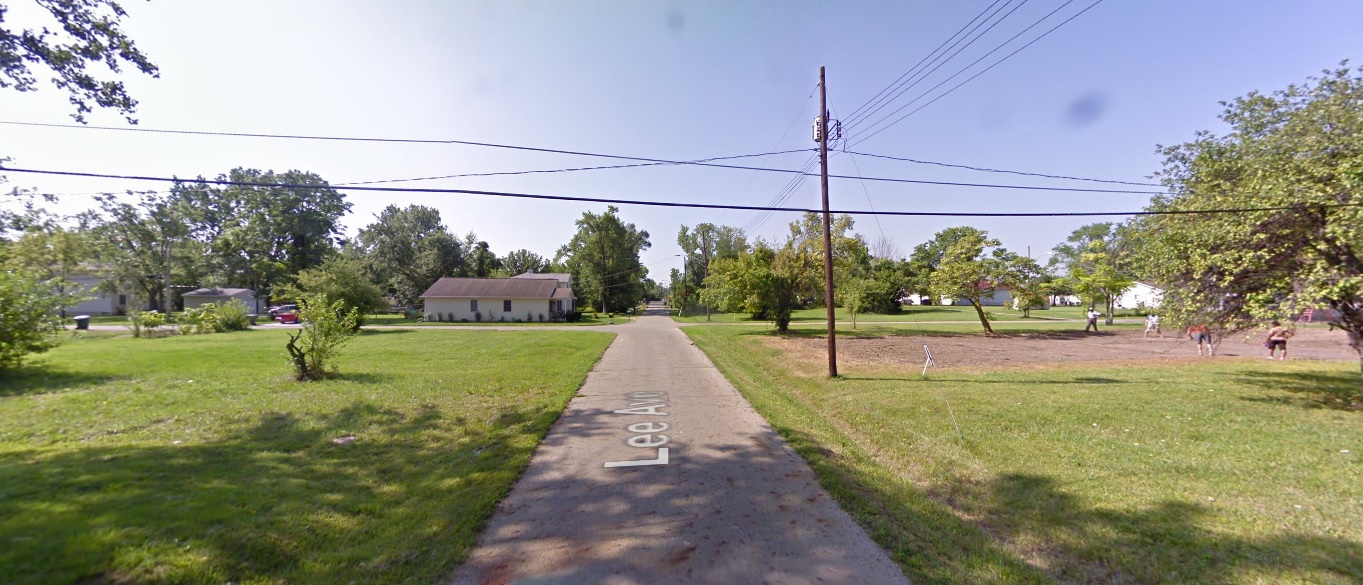
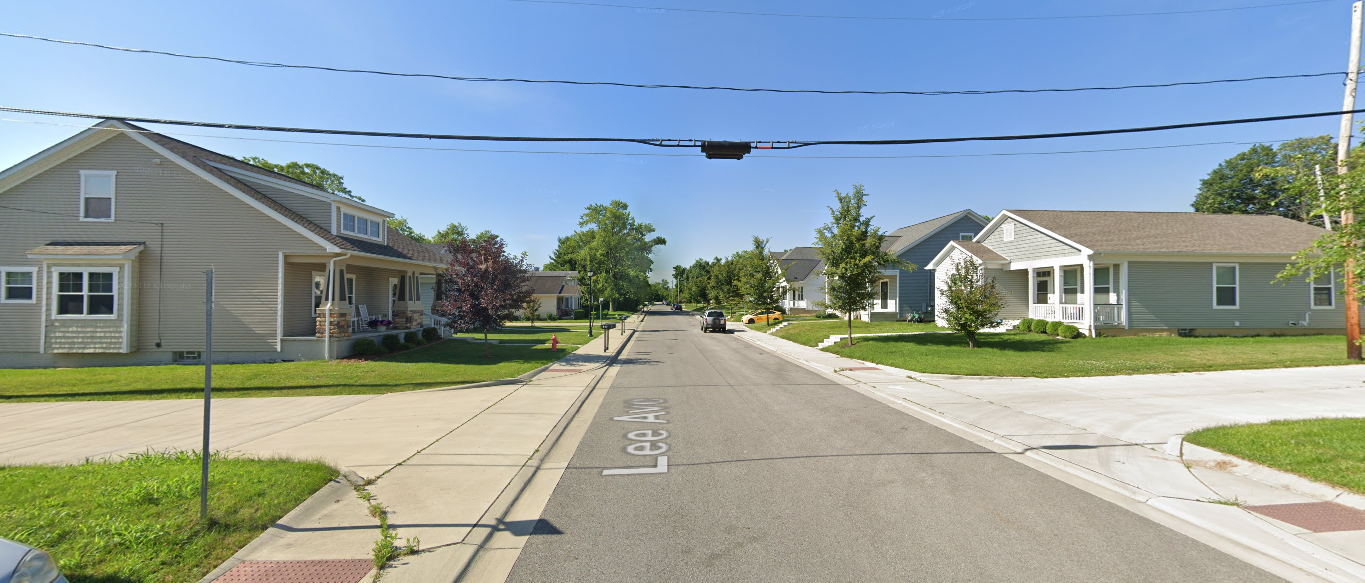
American Addition
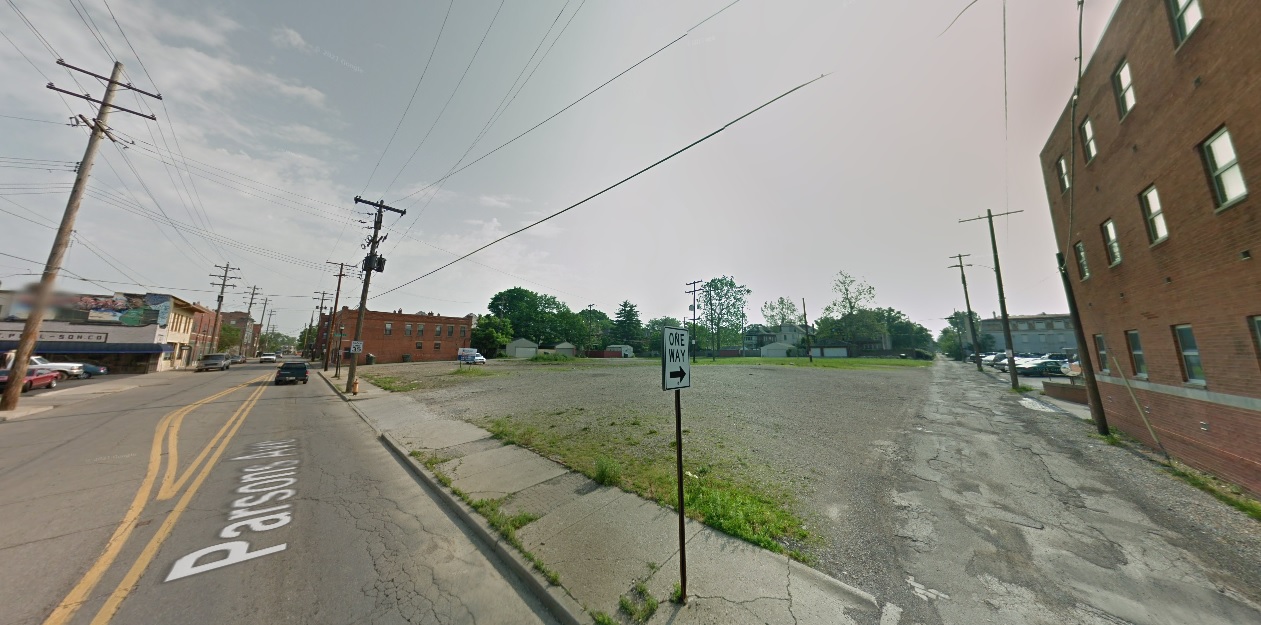
Lee Avenue, looking south from 12th Avenue.
Before: 2009
After: 2019
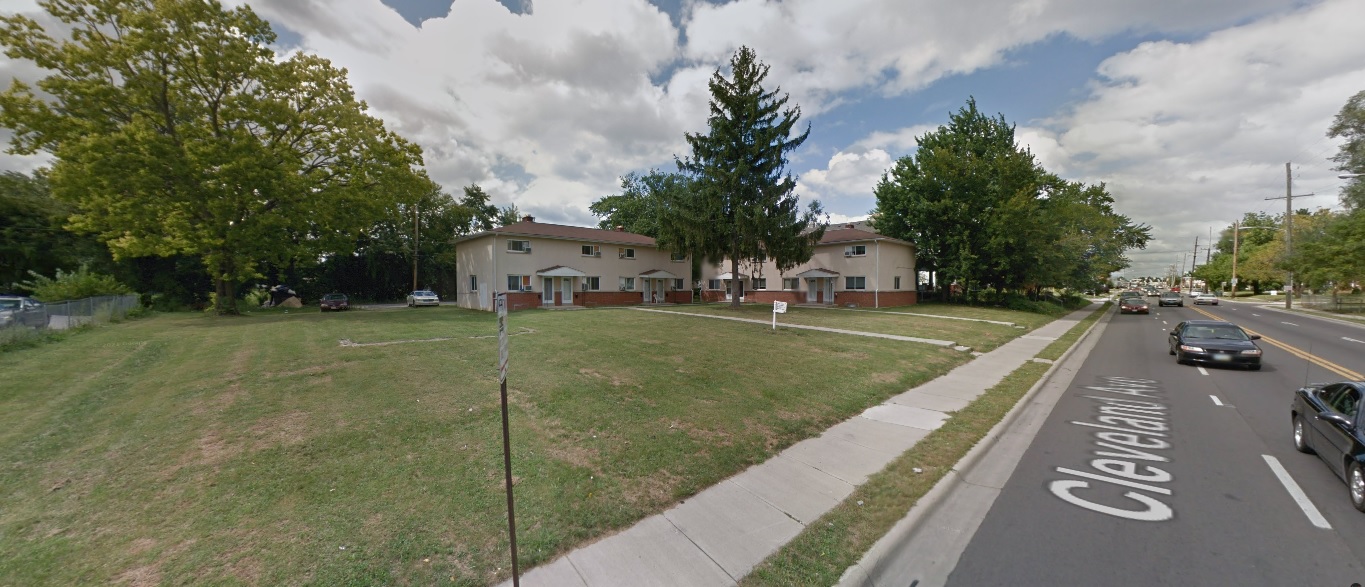
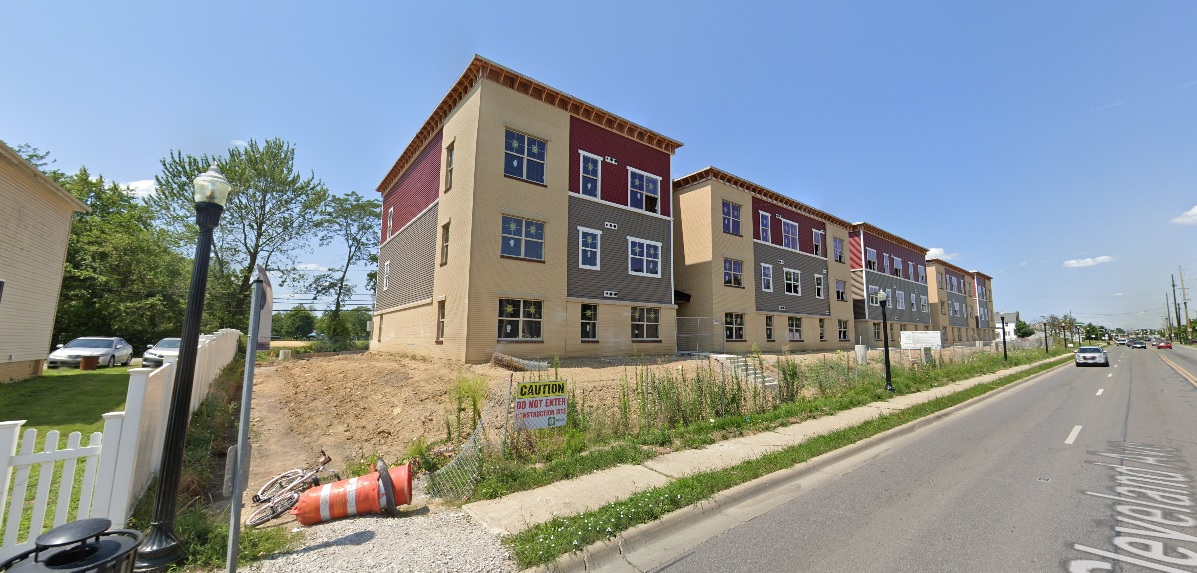
Linden
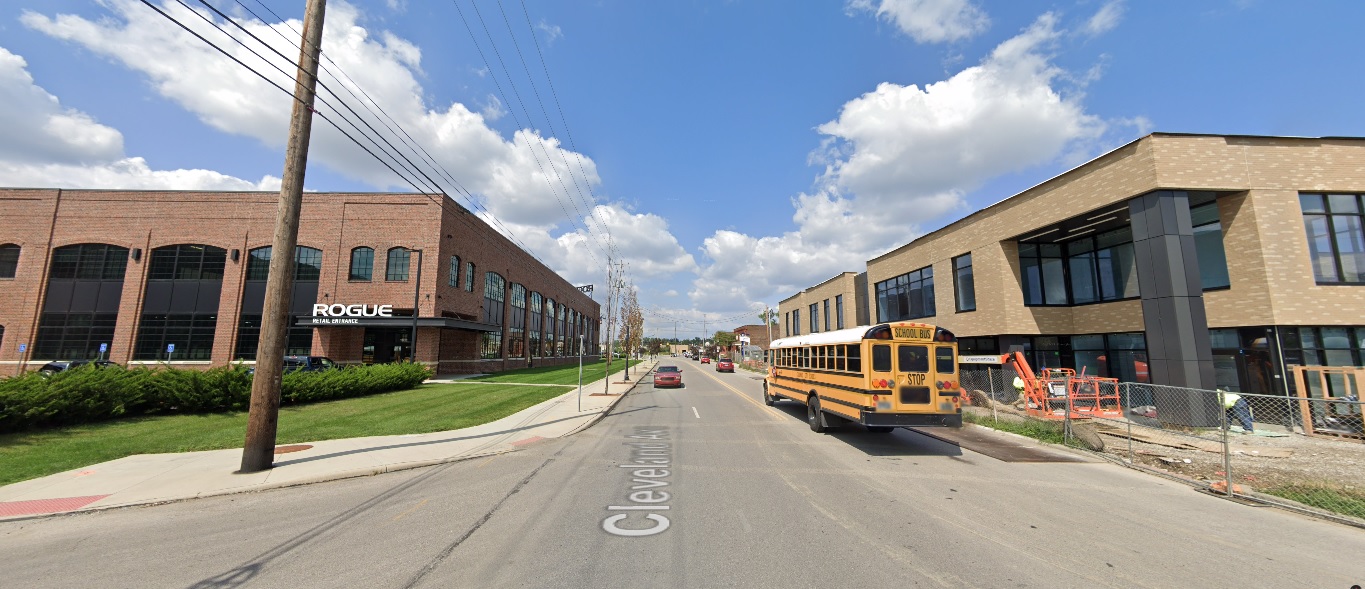
Cleveland Avenue, looking north at Agler Road.
Before: 2011
After: 2021
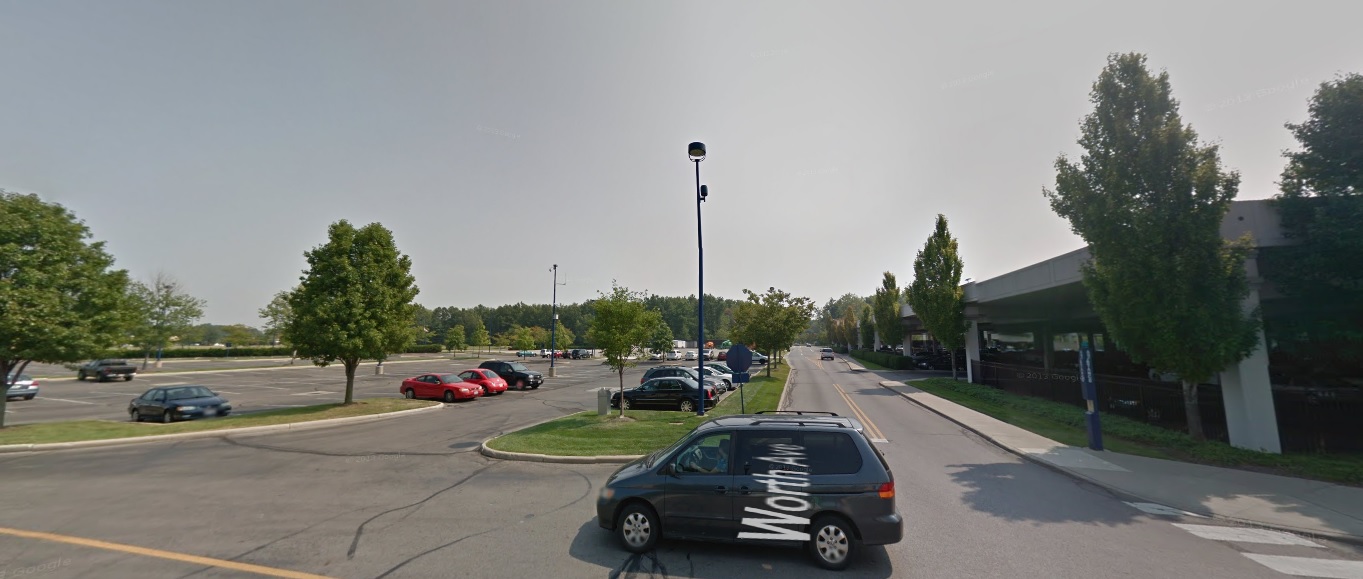
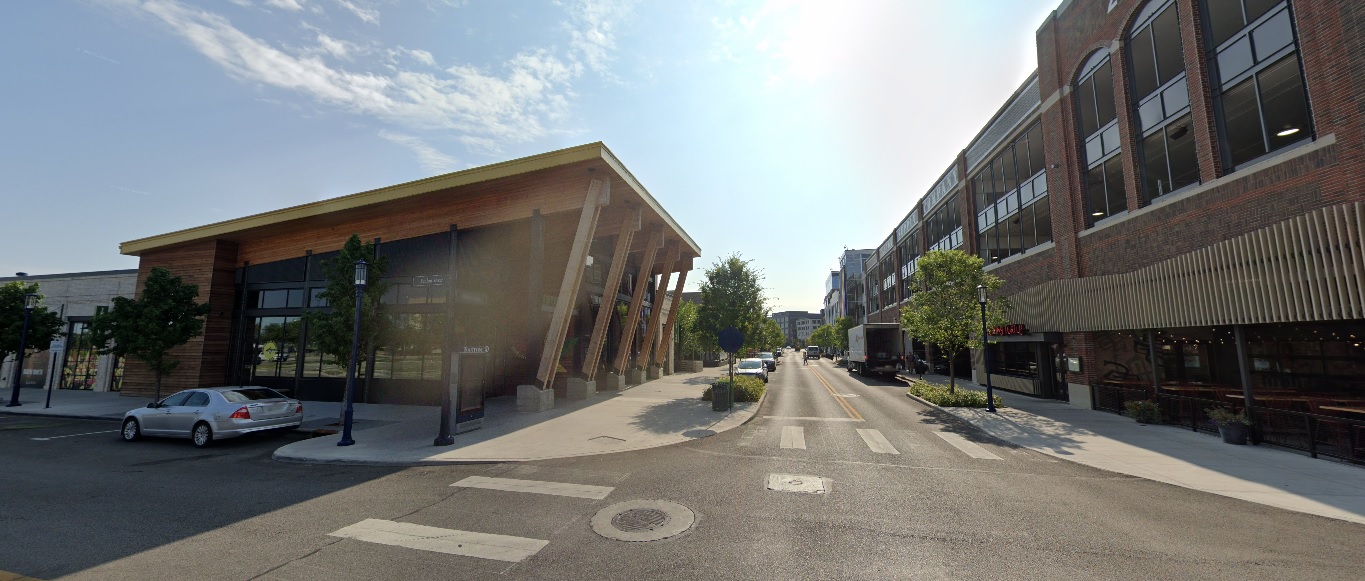
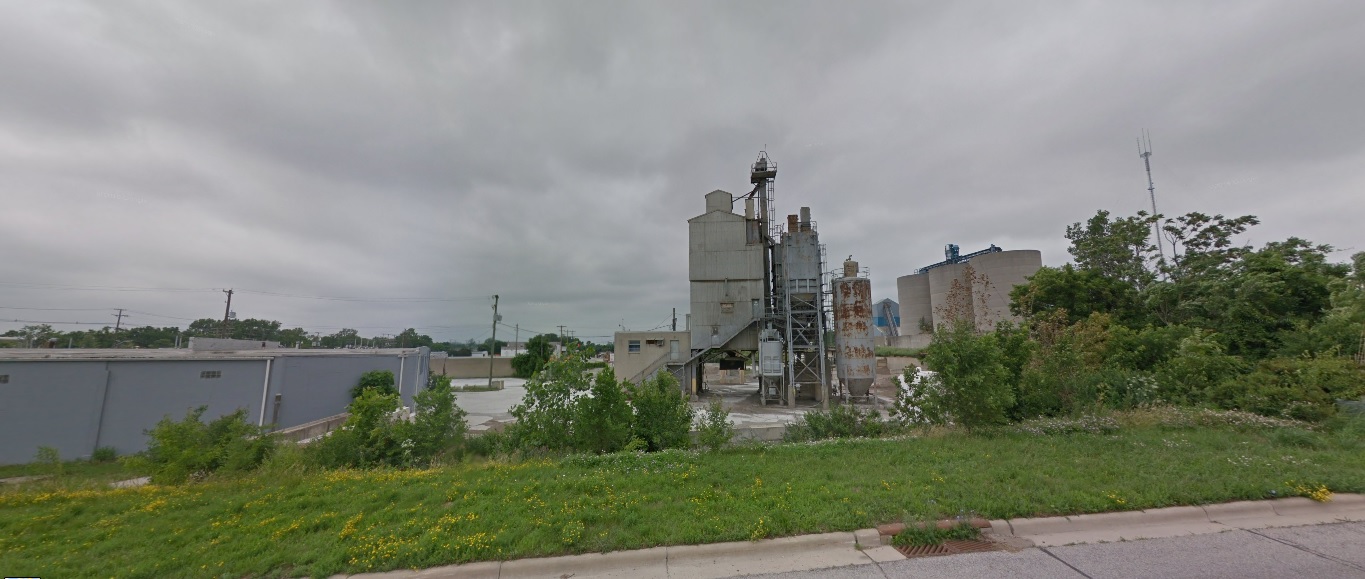
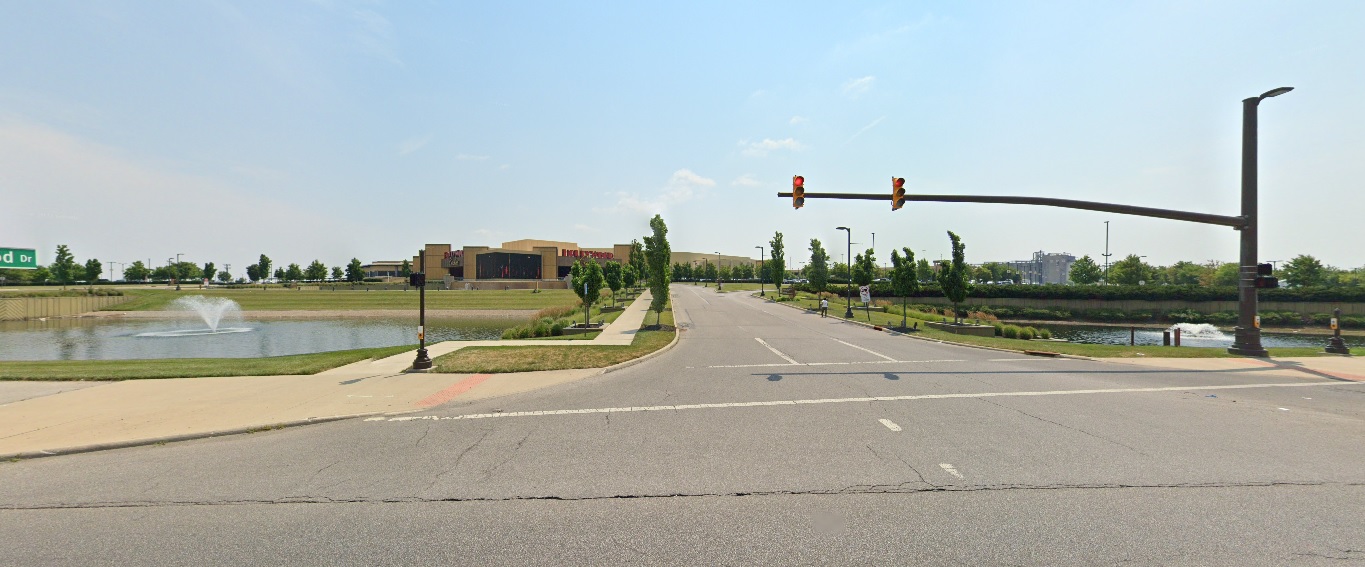
Easton
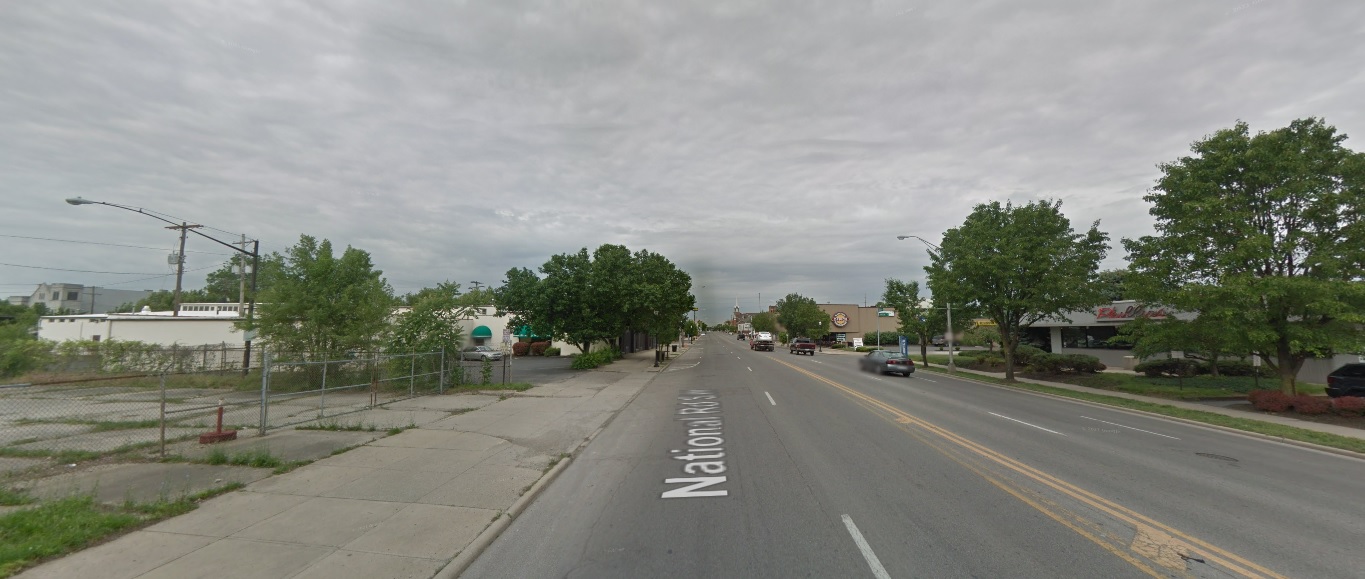
Worth Avenue, looking east from Fenlon Street.
Before: 2011
After: 2021
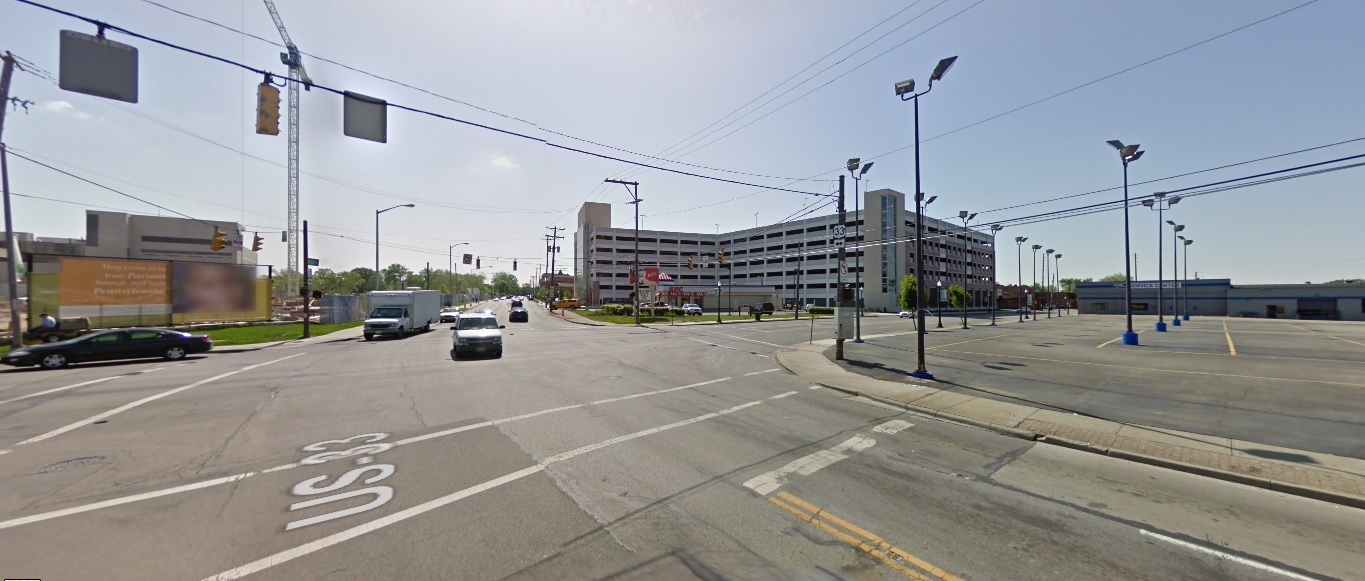
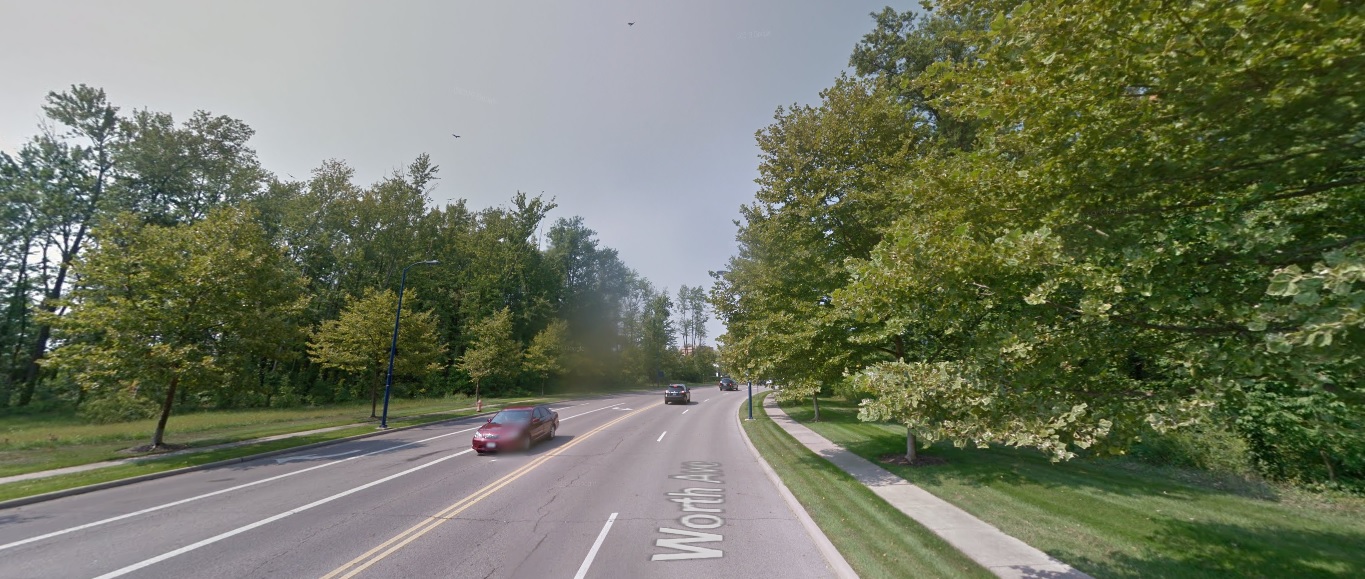
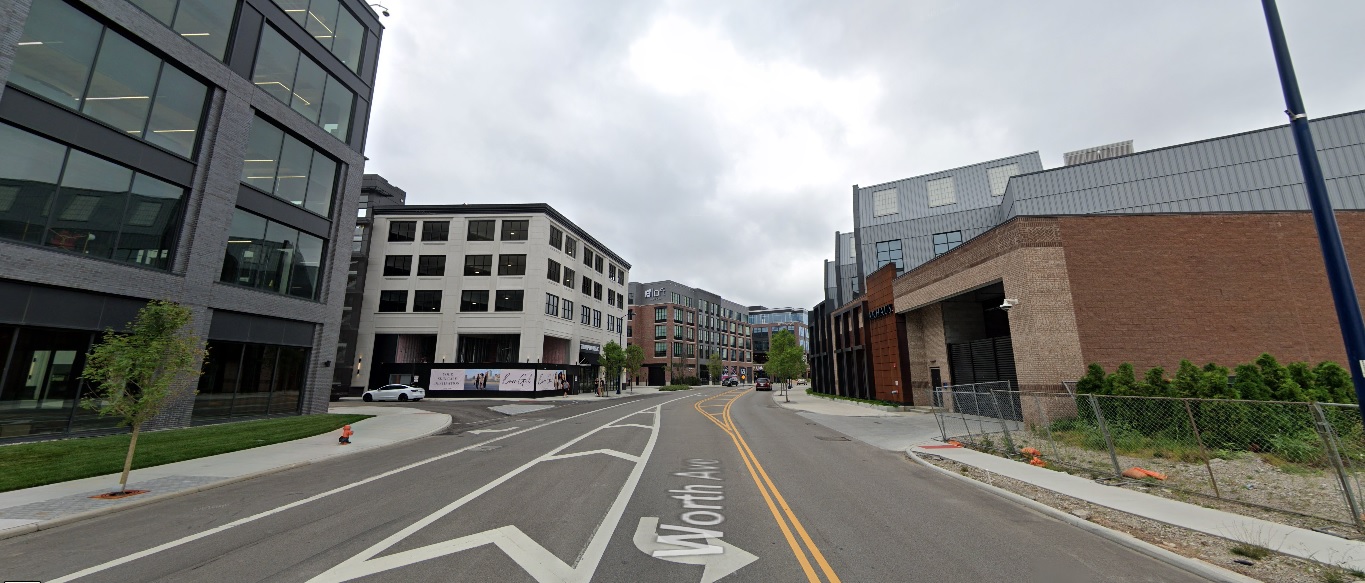
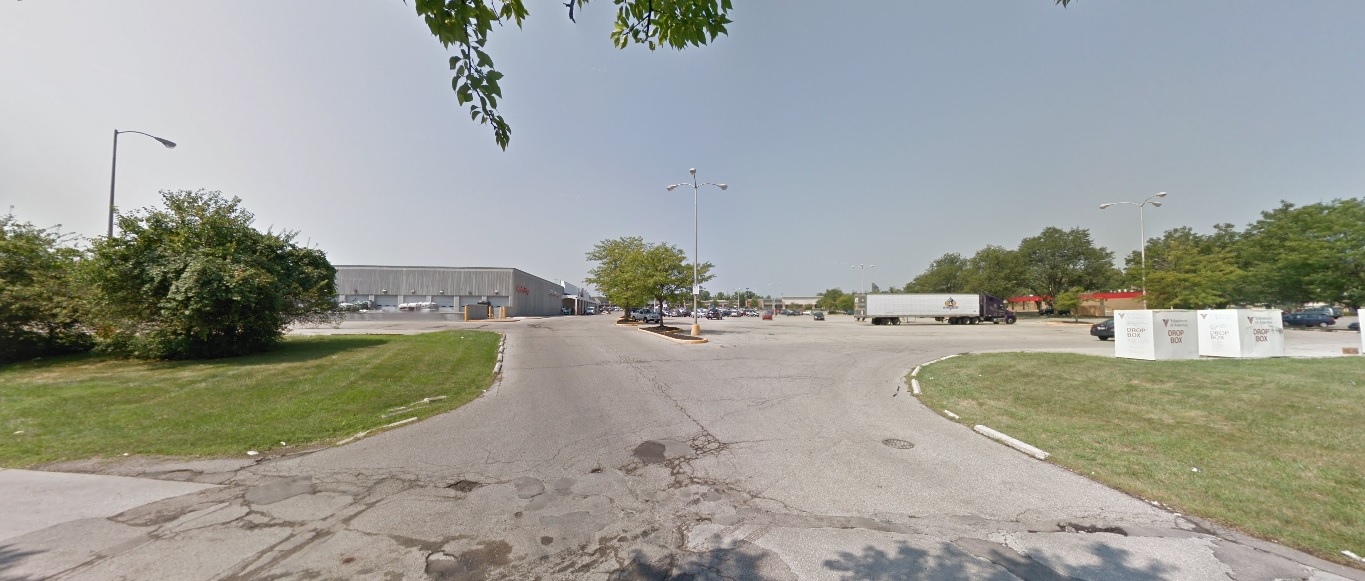
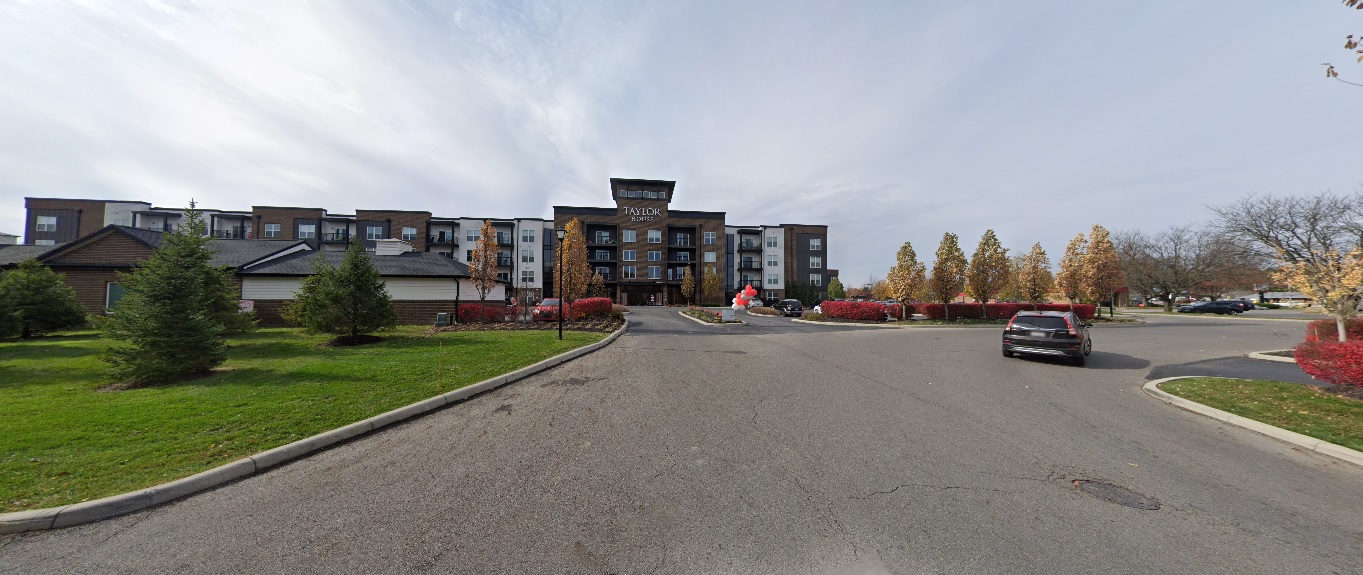
Worth Avenue, looking east from Stelzer Road.
Before: 2011
After: 2021
Franklinton
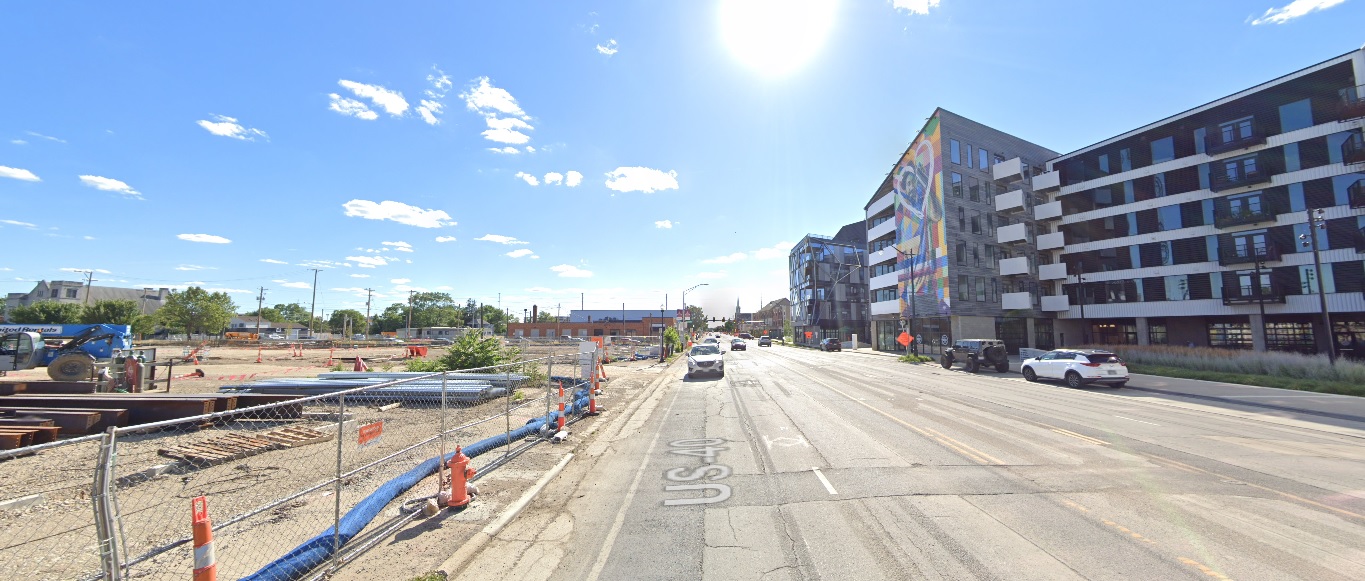
Souder Avenue, looking west just south of I-70.
Before: 2011
After: 2021
Fifth by Northwest
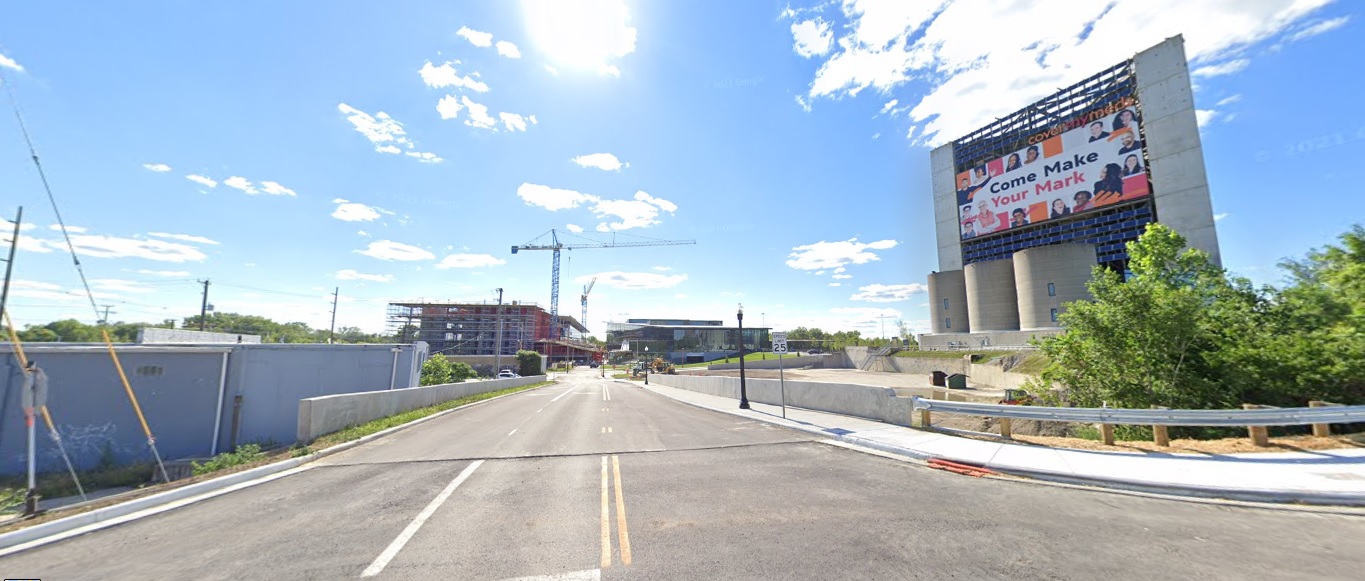
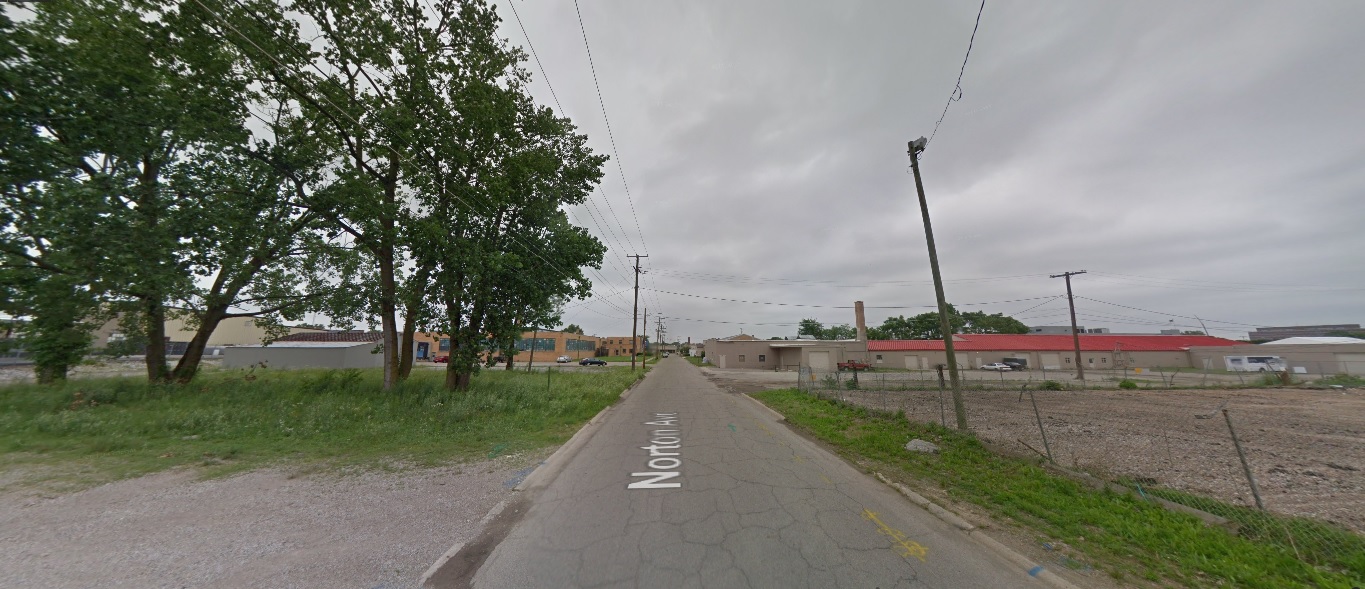
Norton Avenue, looking north halfway between 3rd and 5th.
Before: 2011
After: 2020
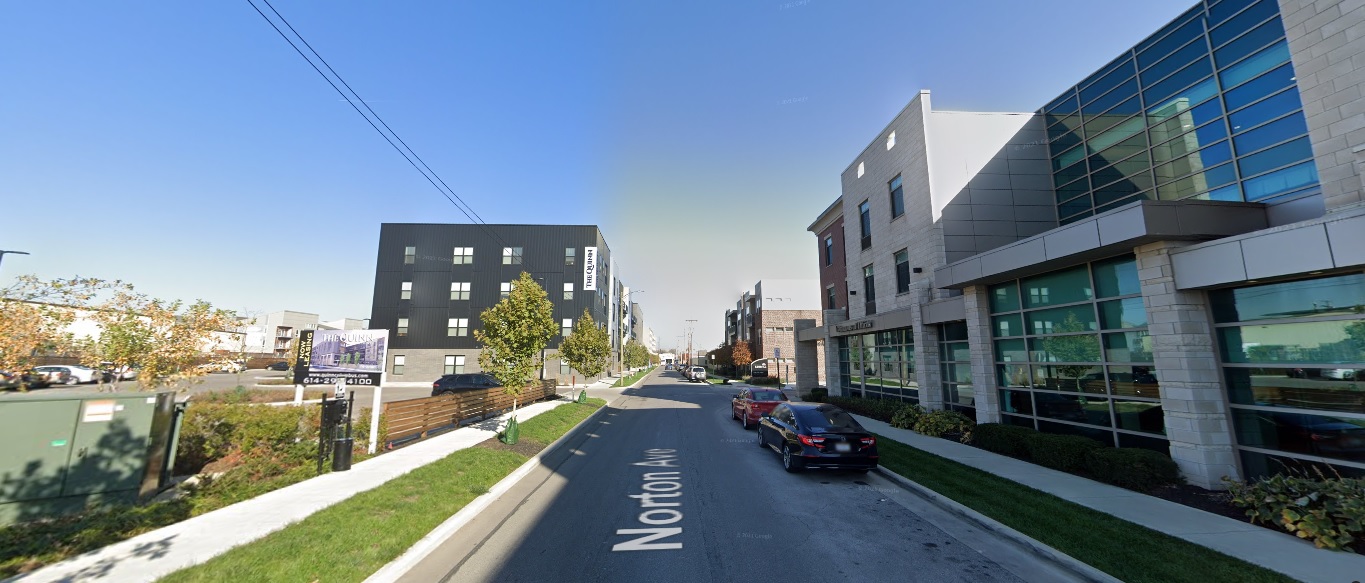
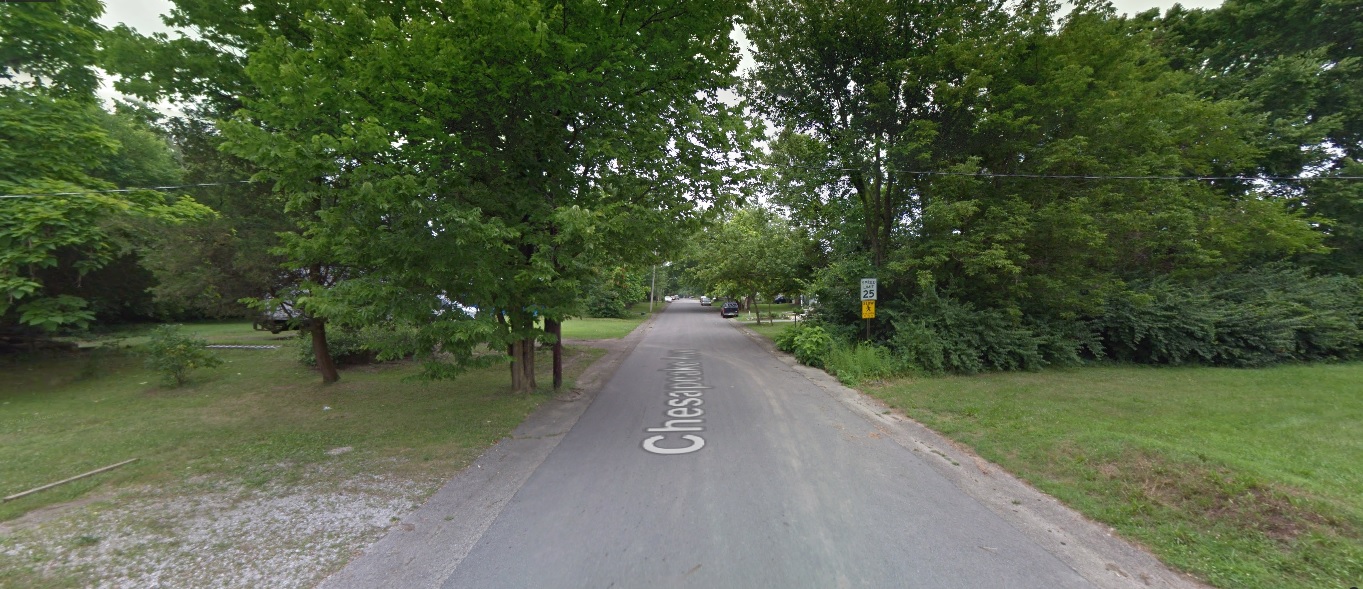
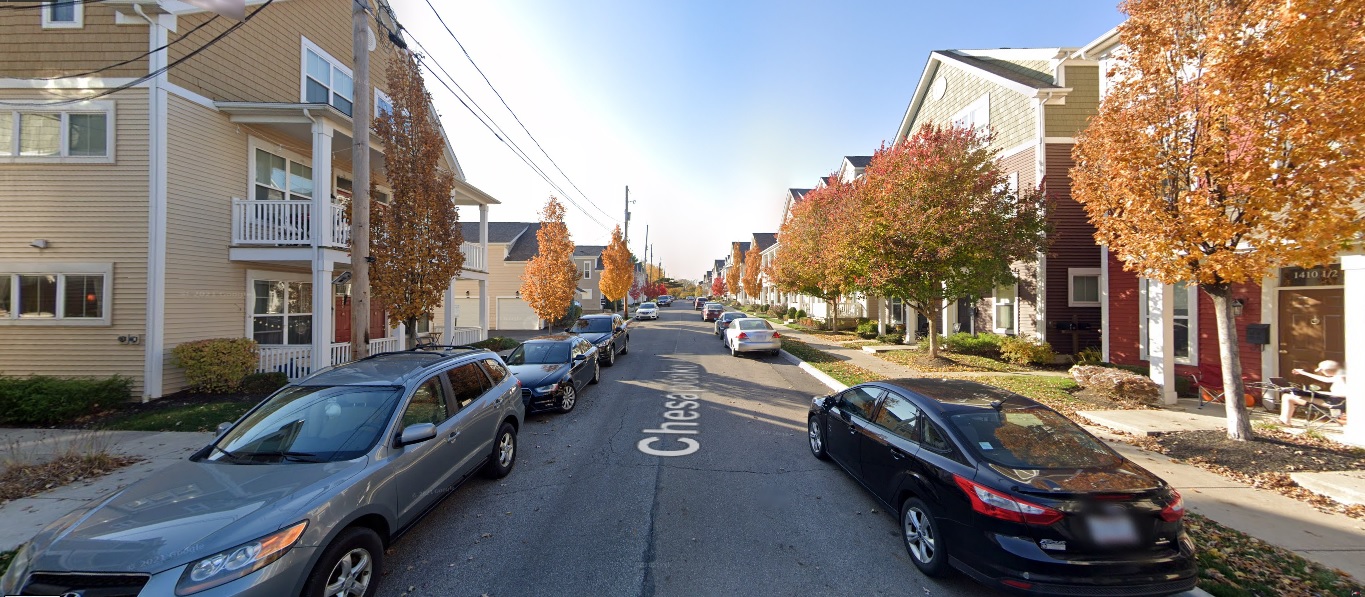
Chesapeake Avenue, looking west.
Before: 2011
After: 2020
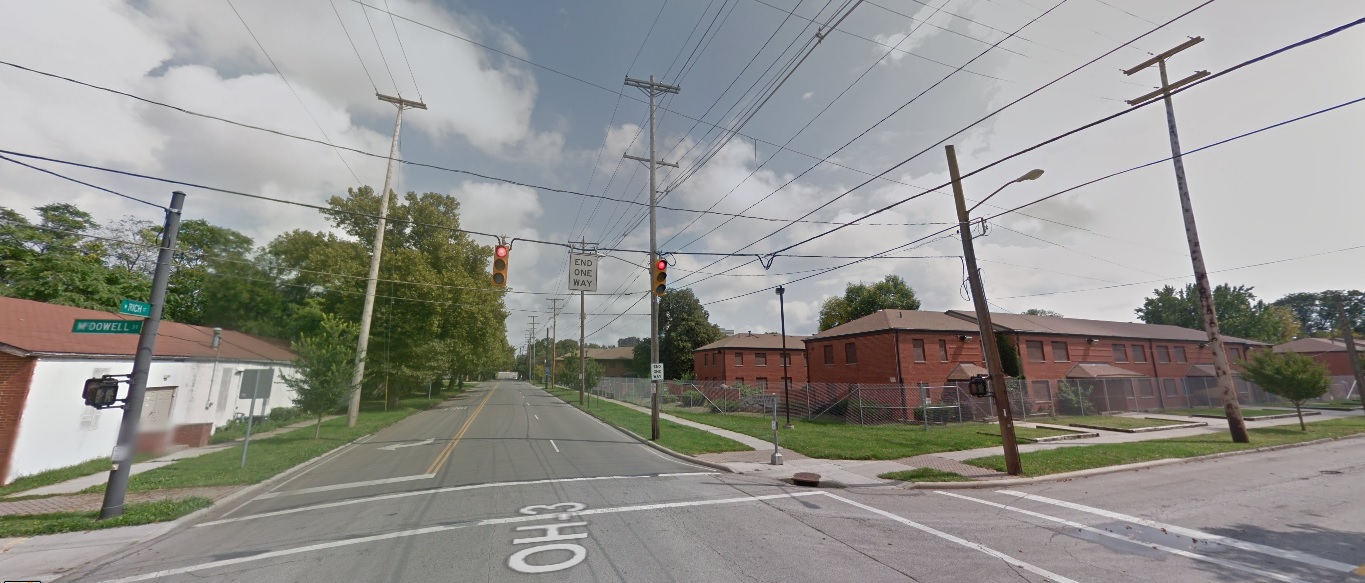
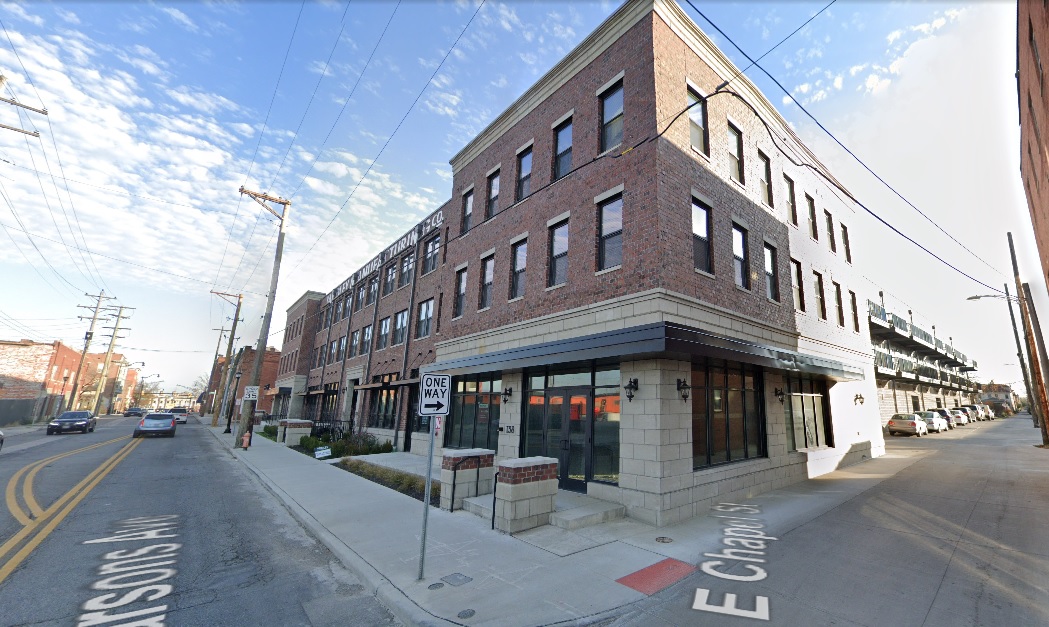
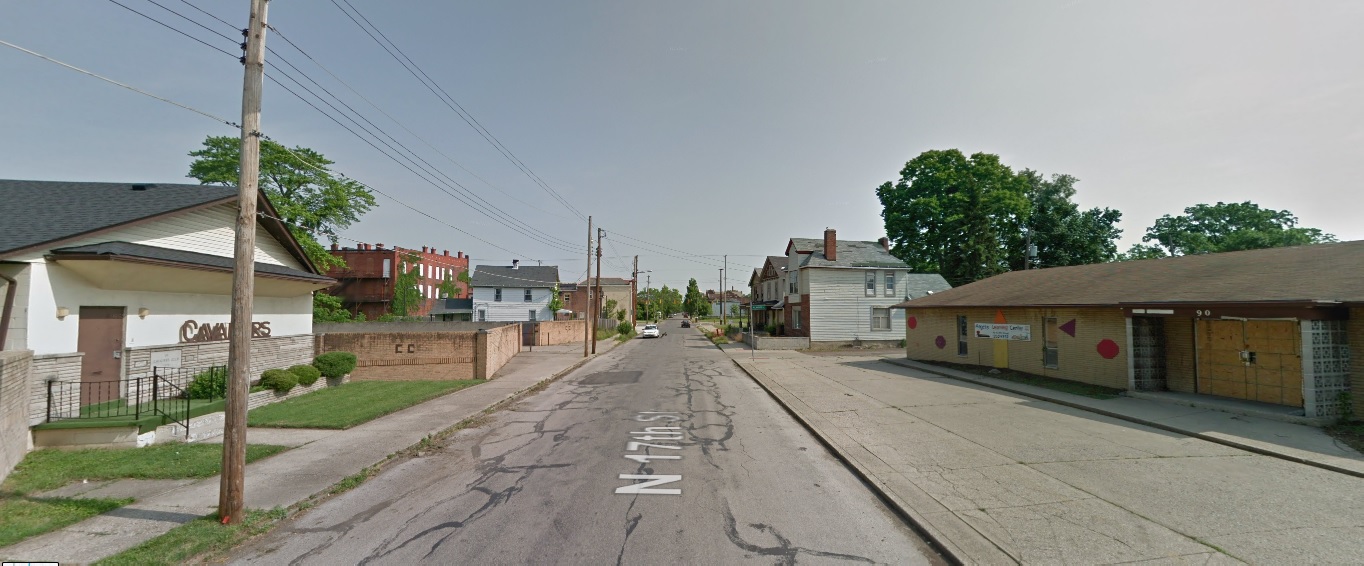
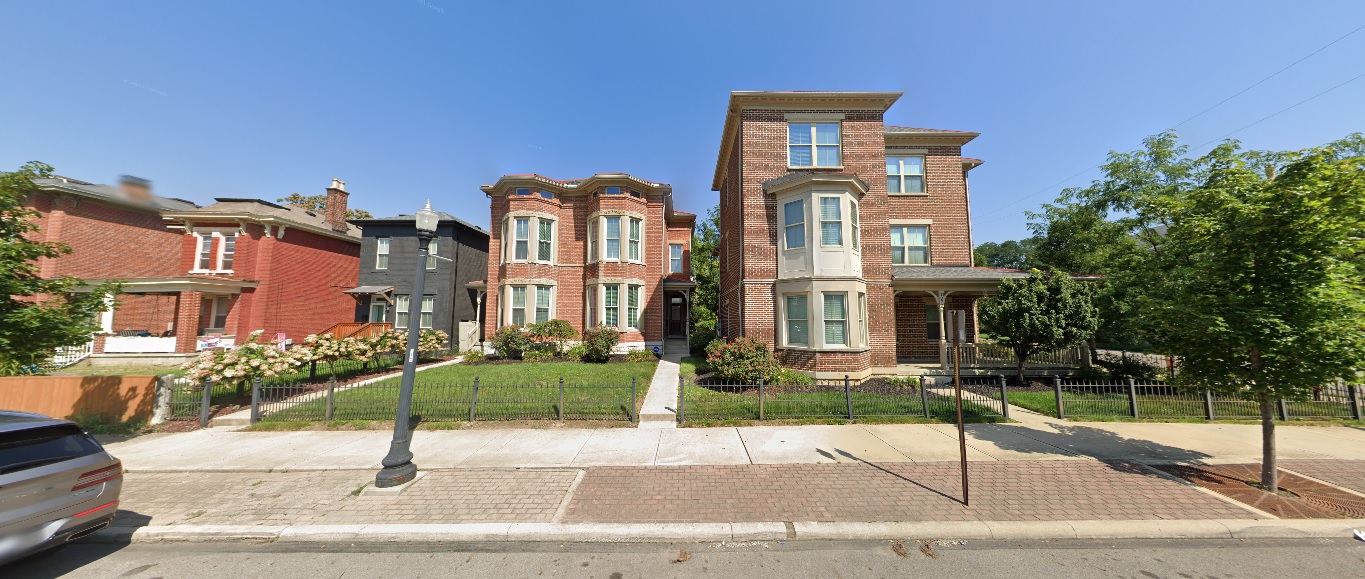
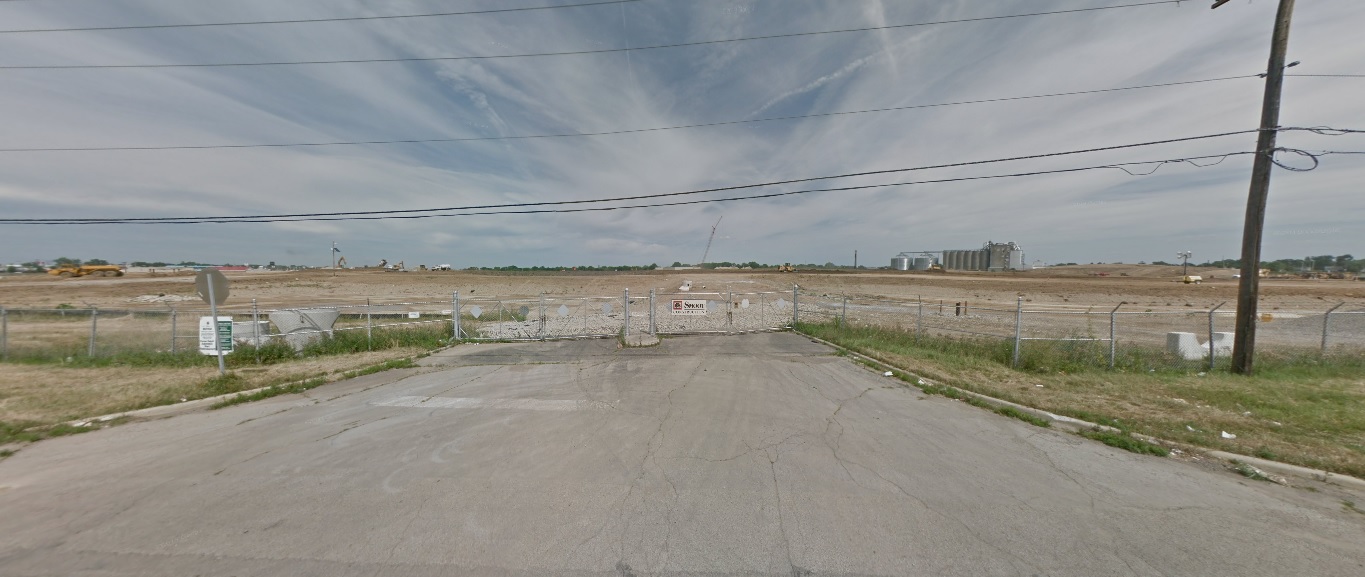
King-Lincoln
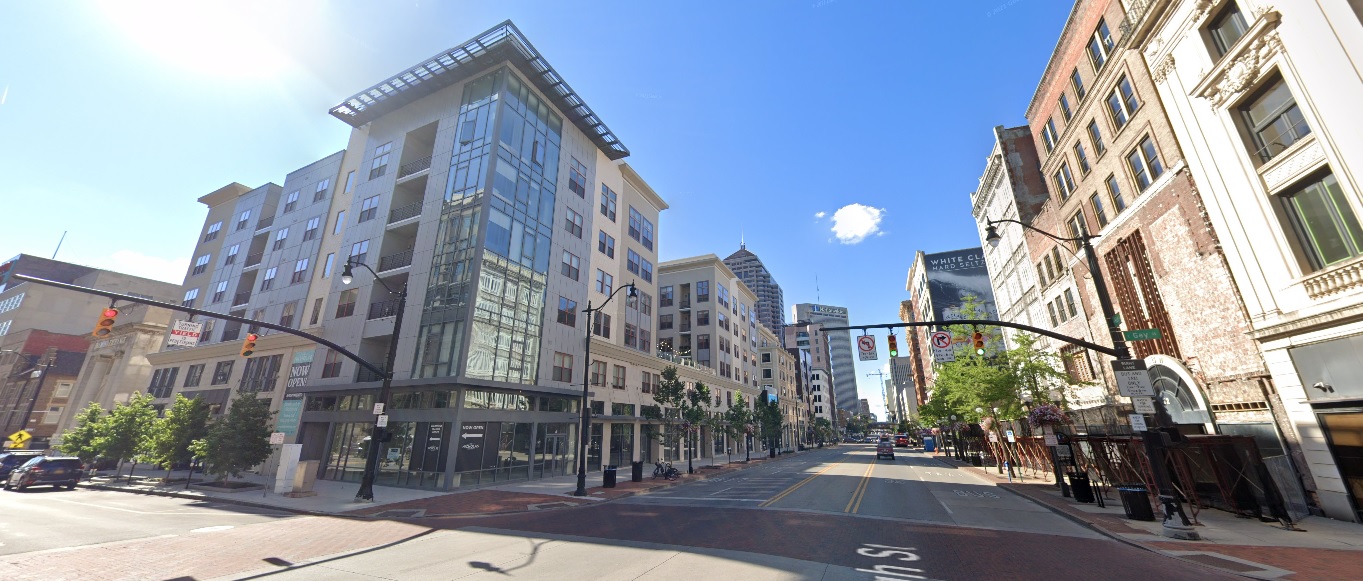
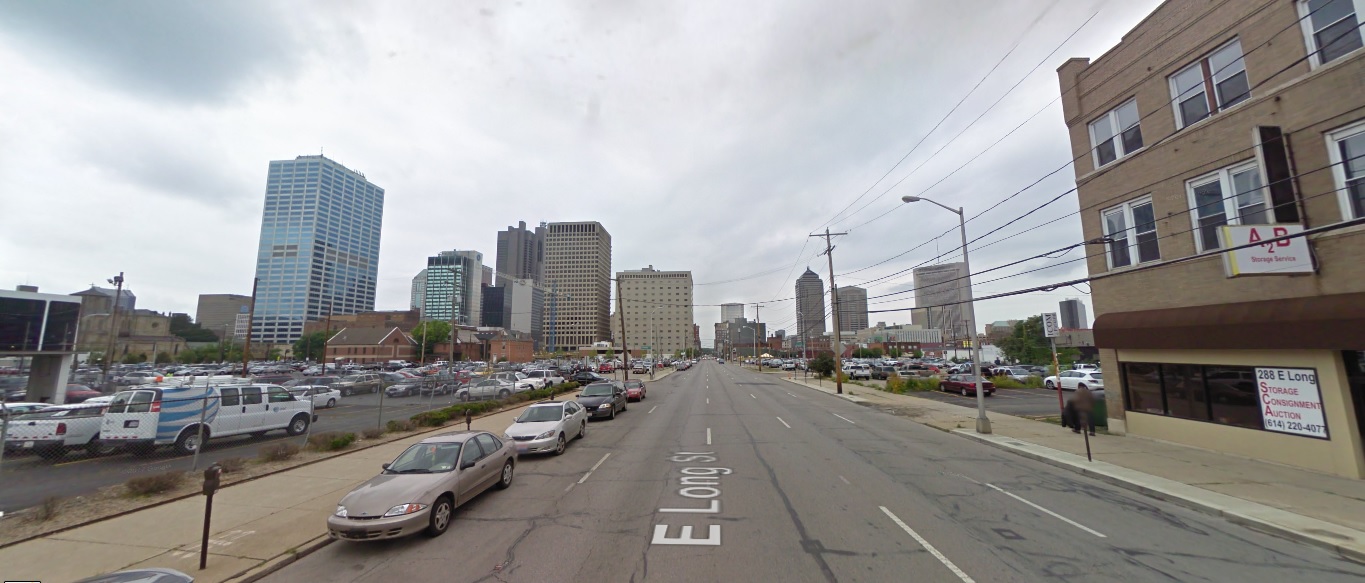
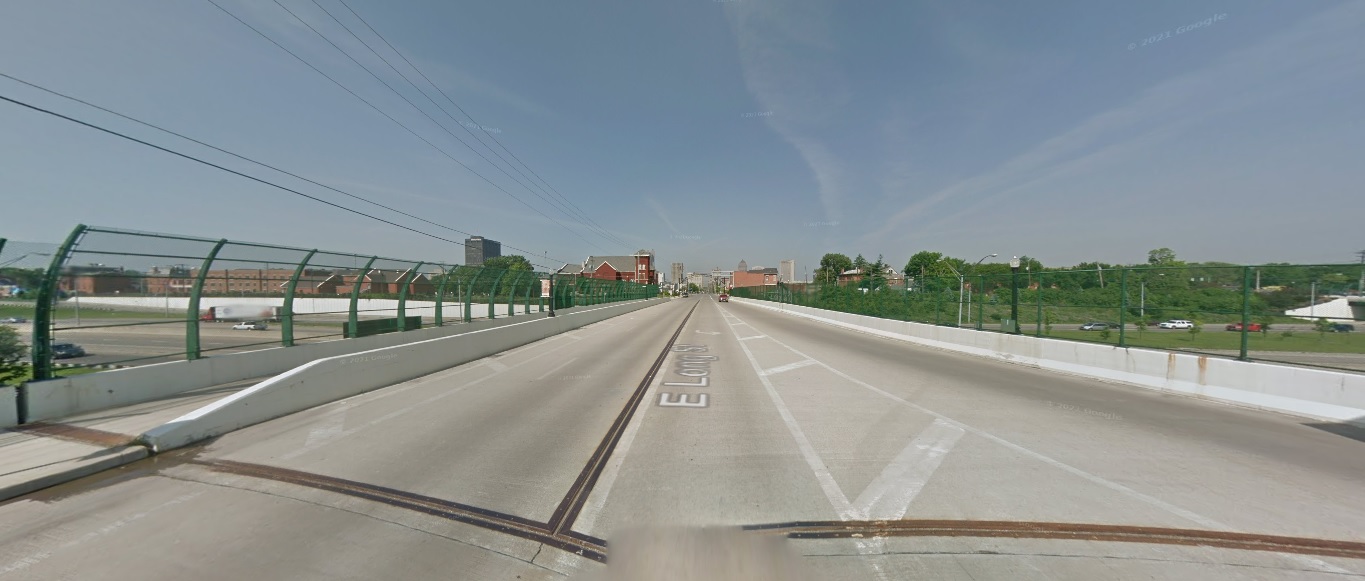
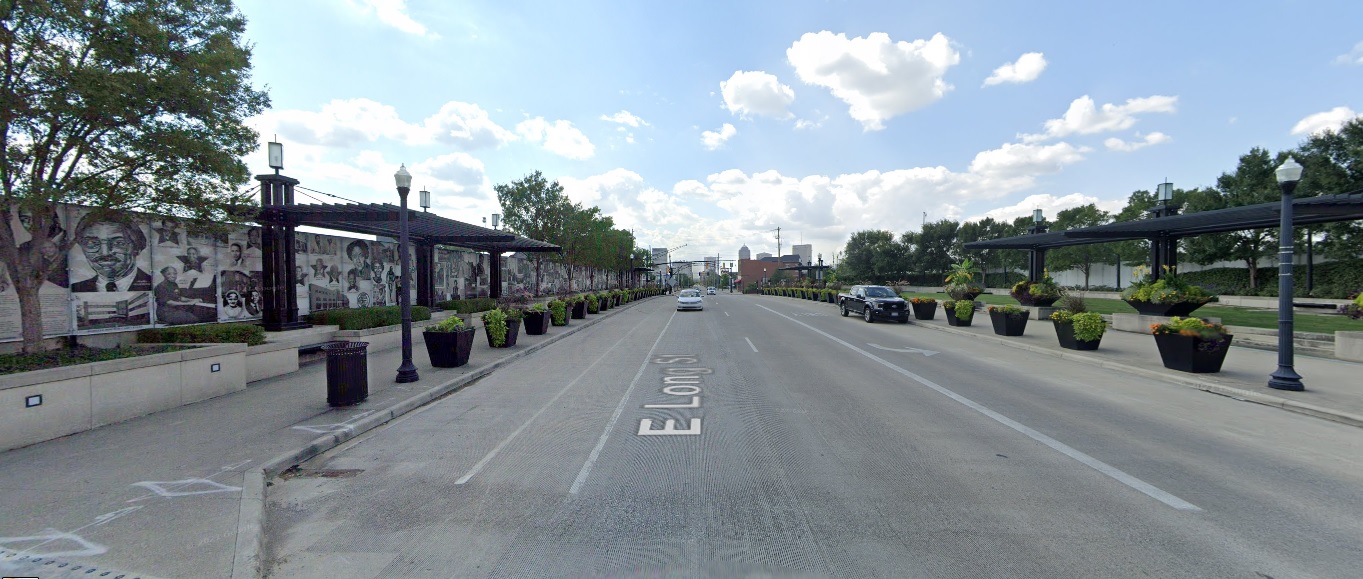
Long Street, looking west at I-71.
Before: 2011
After: 2021
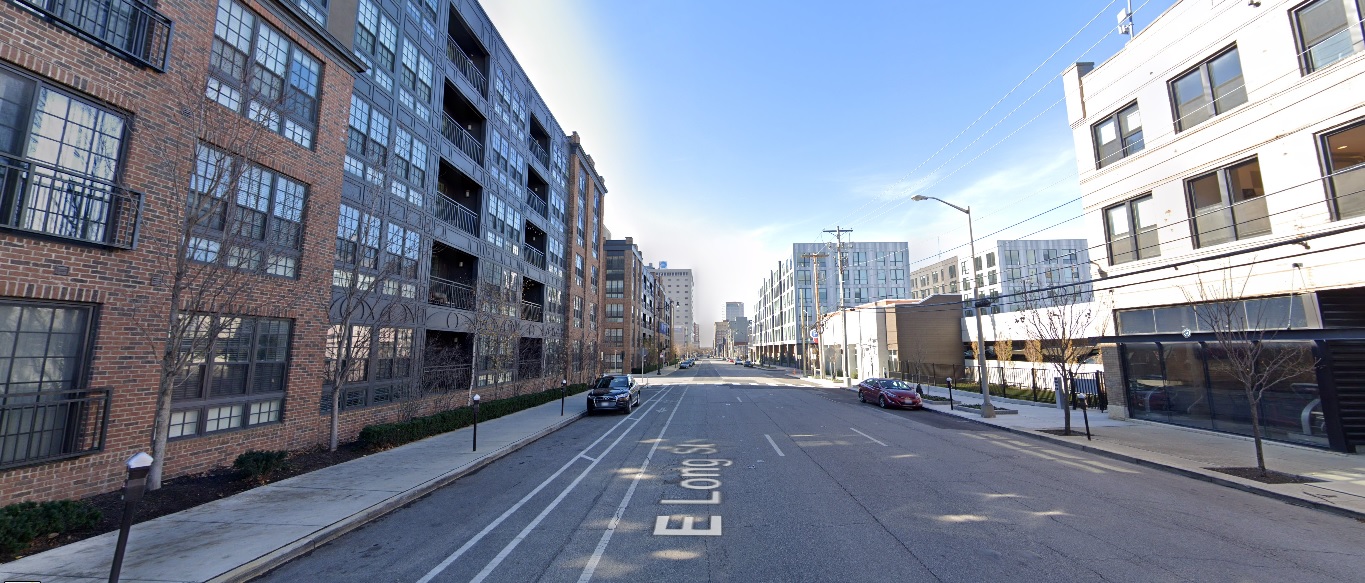
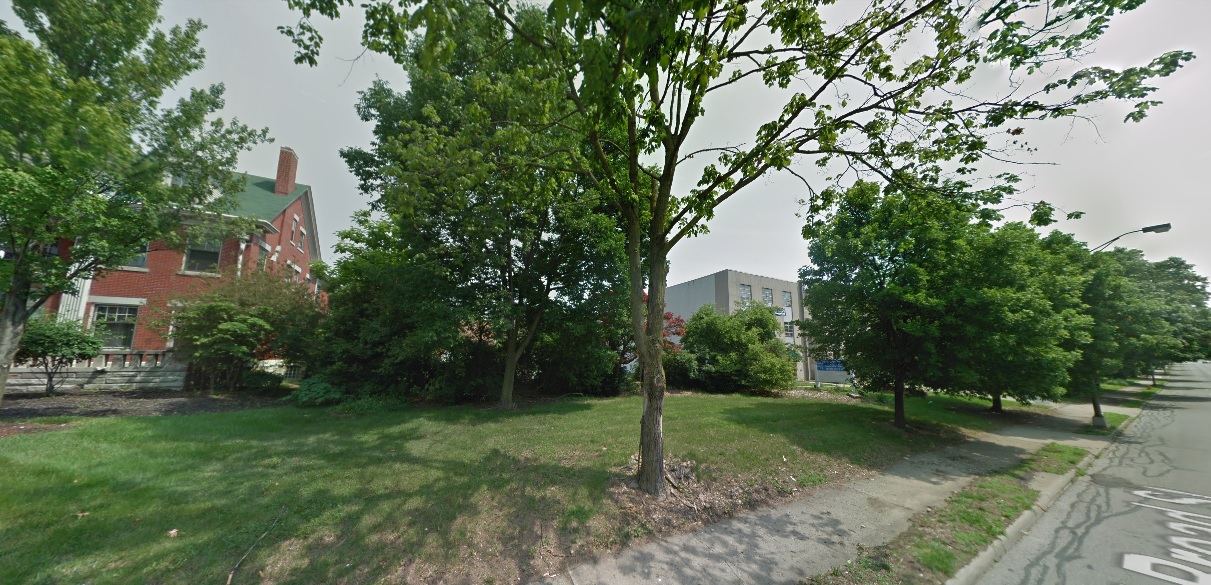
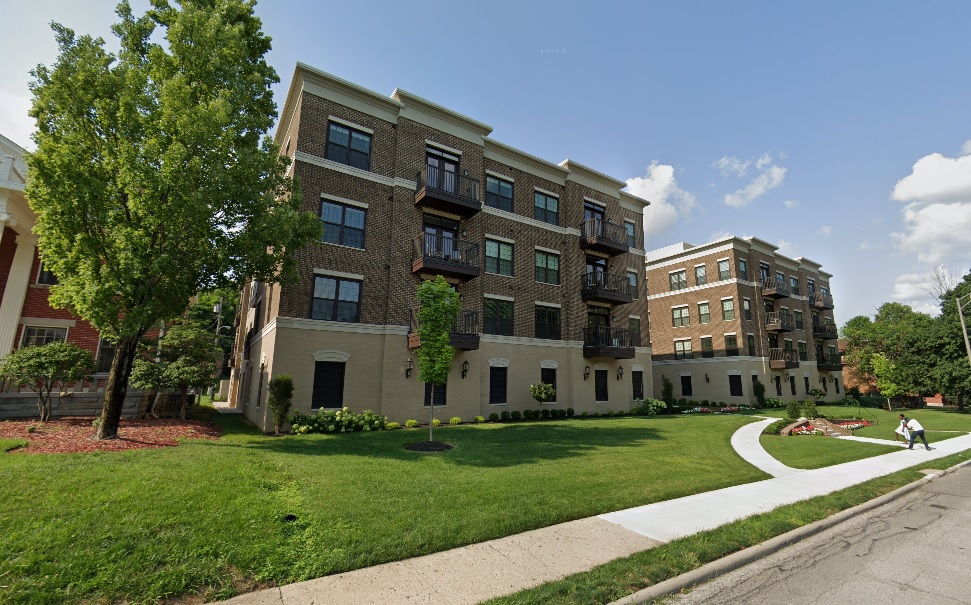
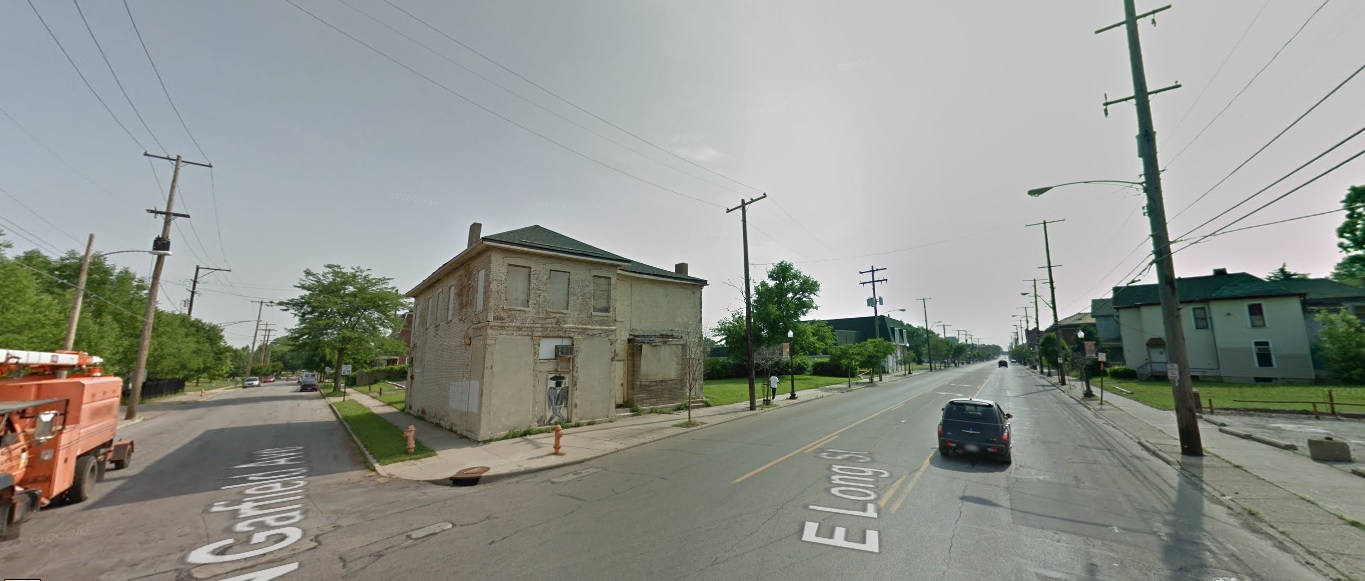
Long Street, looking northeast at Garfield Avenue.
Before: 2011
After: 2021
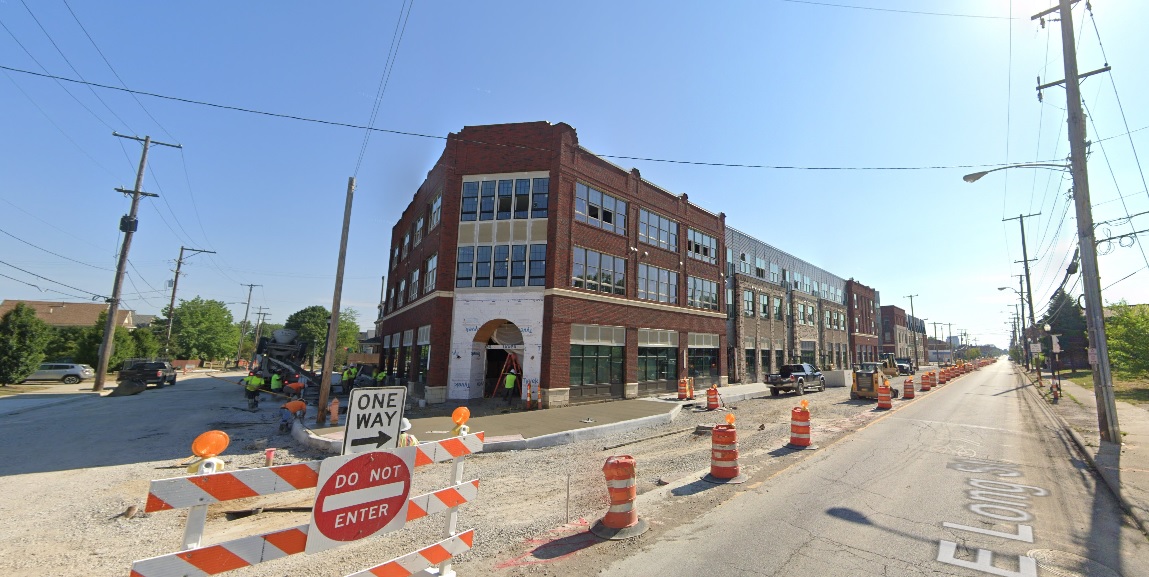
Long Street, looking north just west of 21st Street.
Before: 2011
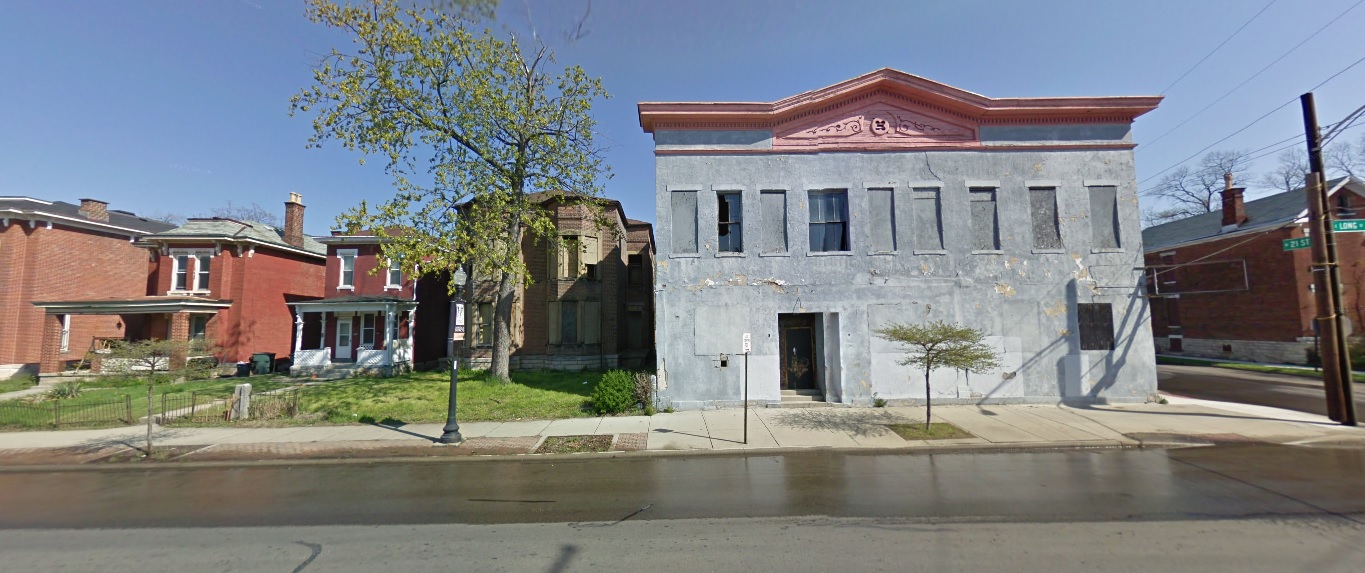
After: 2021
West Side
Georgesville Road, looking east south of Broad Street.
Before: 2011
After: 2021
North Side
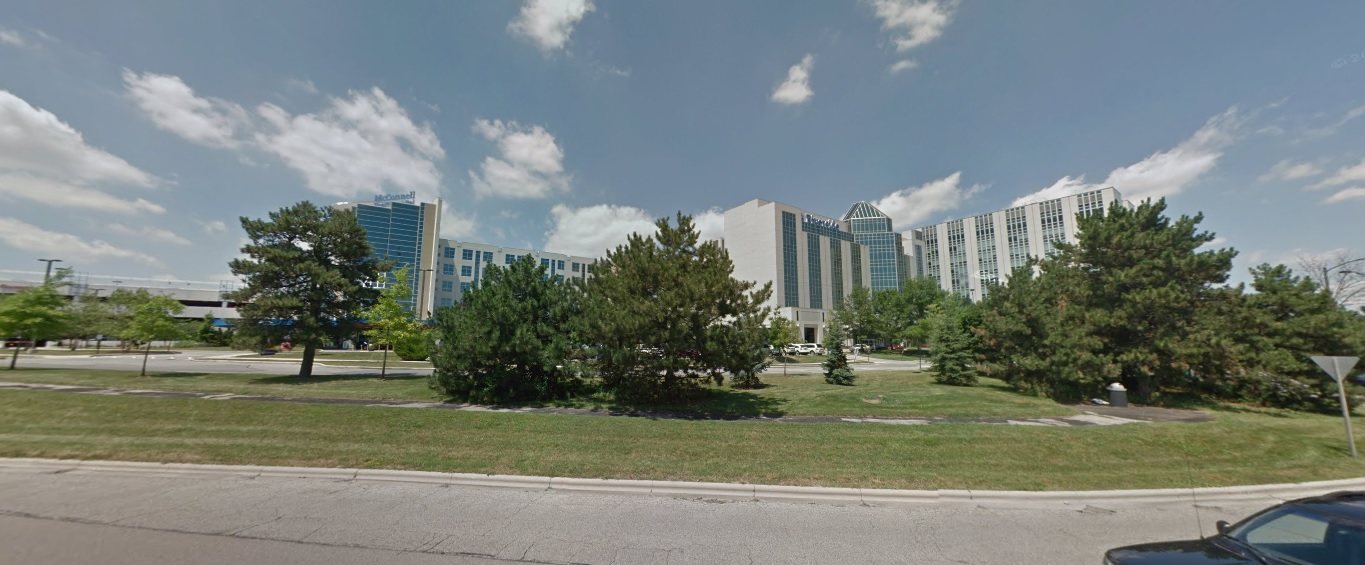
Wakeford Street, looking west from Olentangy River Road.
Before: 2011
After: 2021
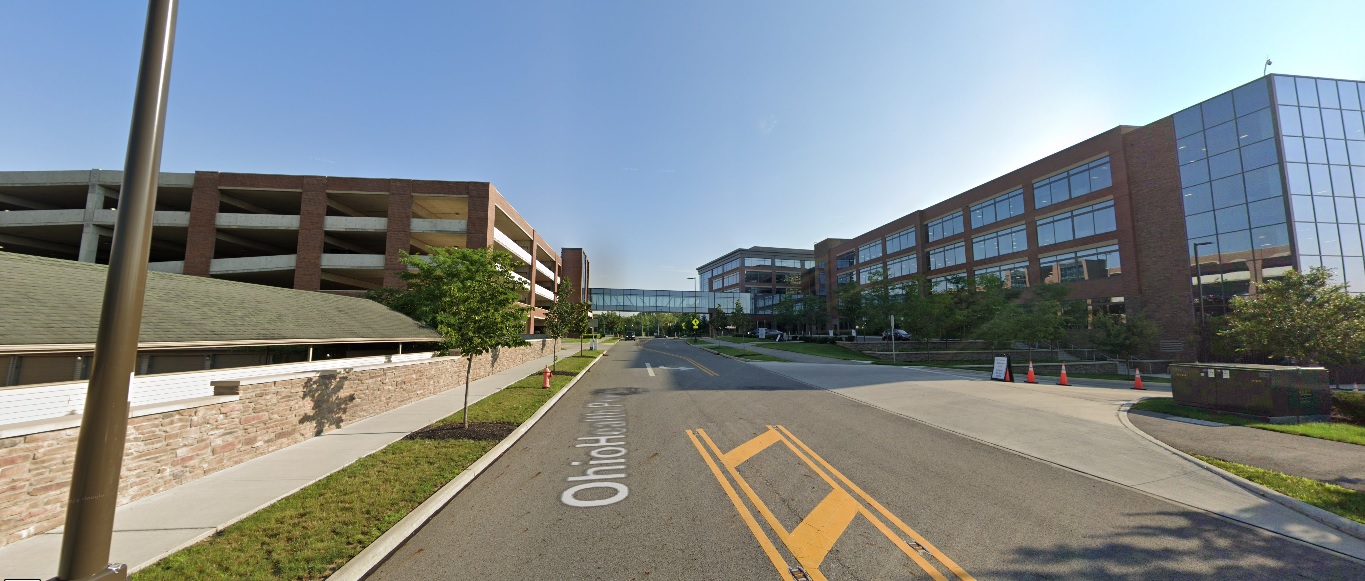
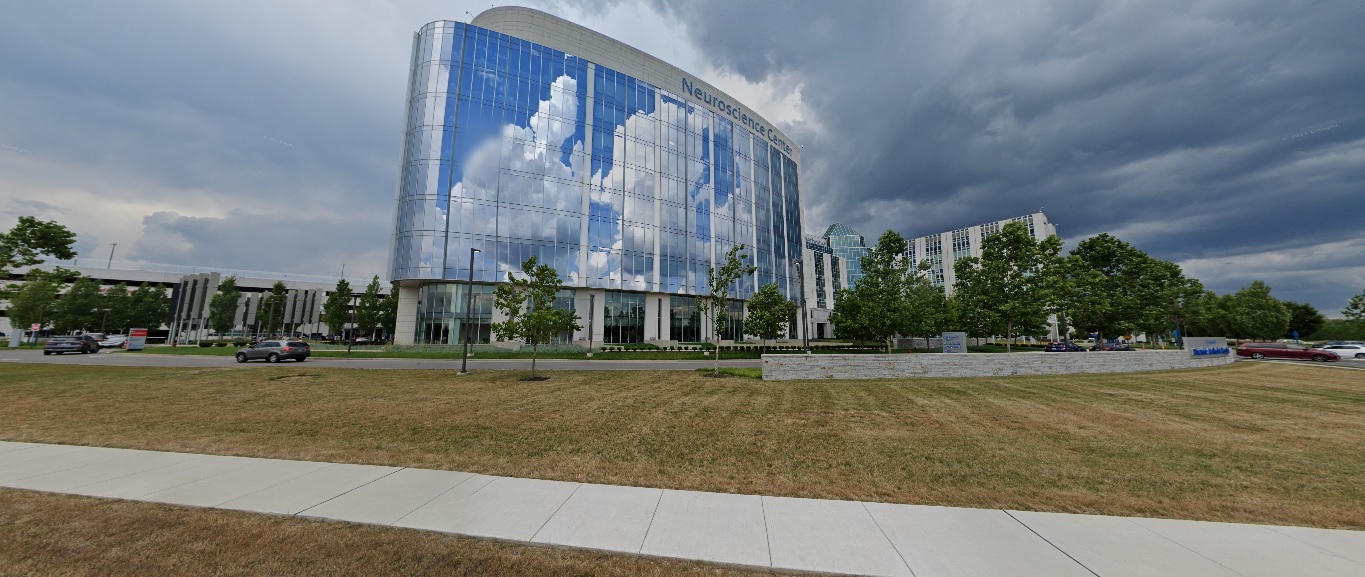
Ohio Health Parkway, looking north from Healthy Community Way.
Before: 2015
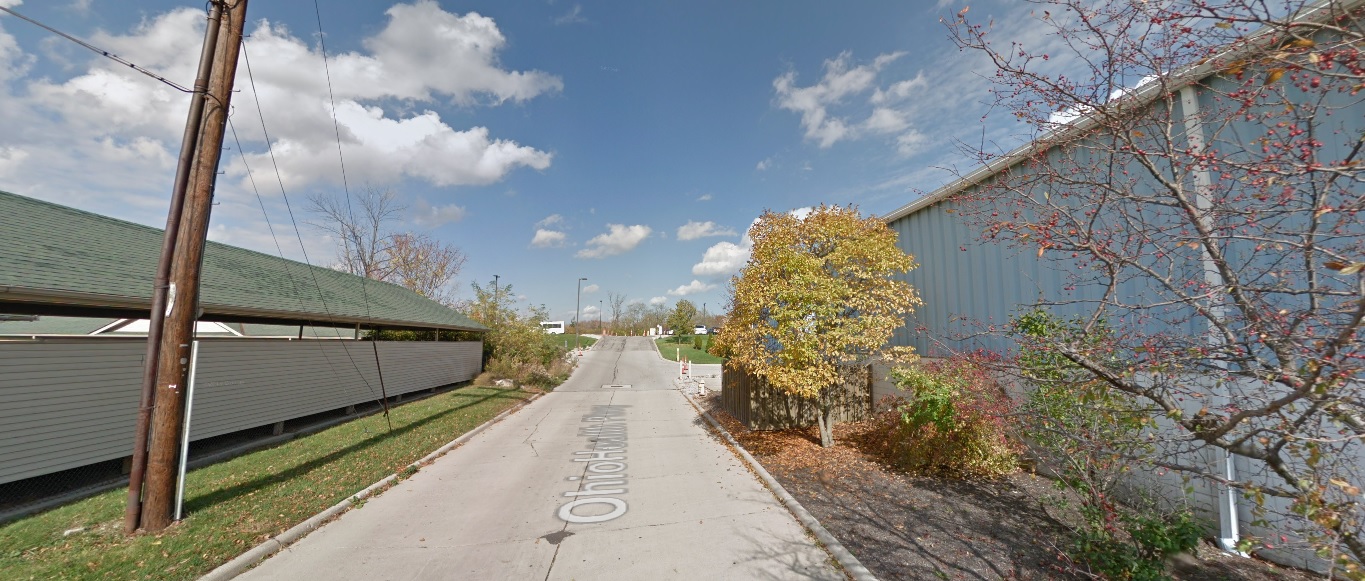
After: 2021
East North Broadway, looking north at 315.
Before: 2011
After: 2021
Grandview Heights
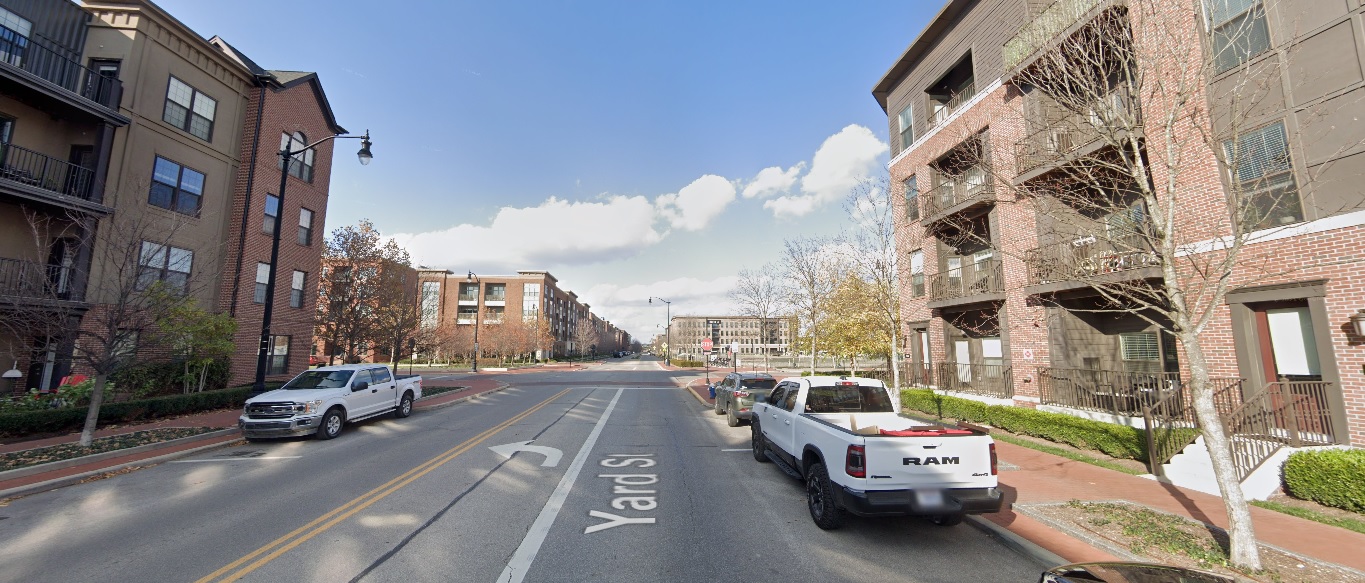
Yard Street, looking north from just south of Burr Avenue.
Before: 2011
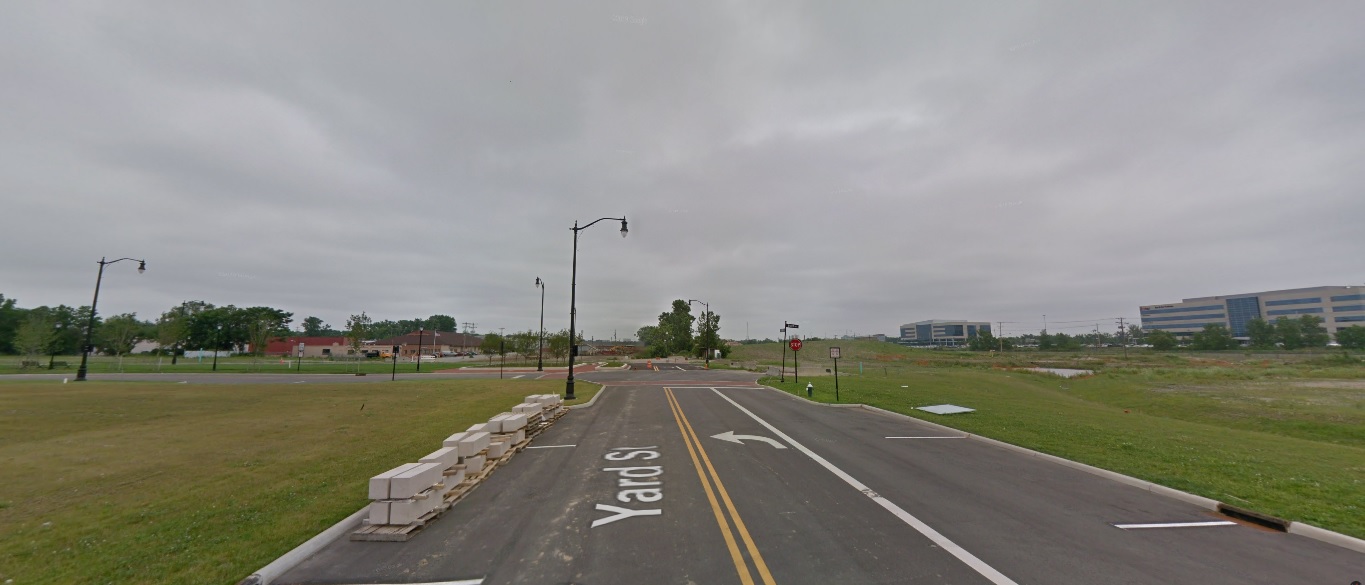
After: 2020
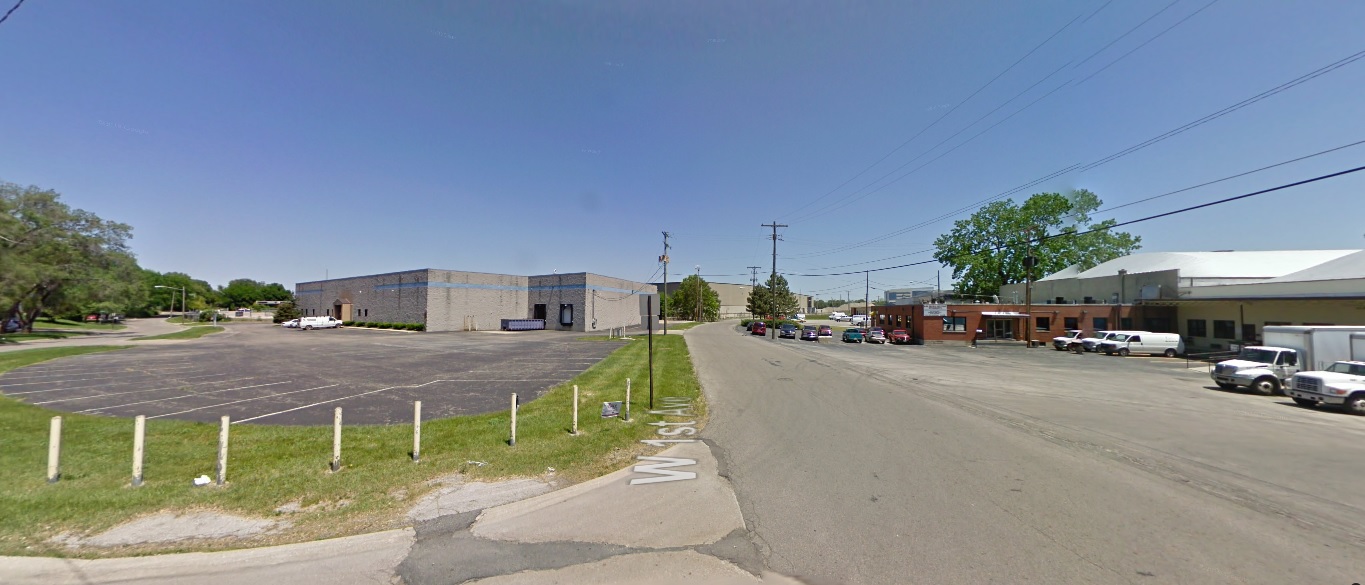
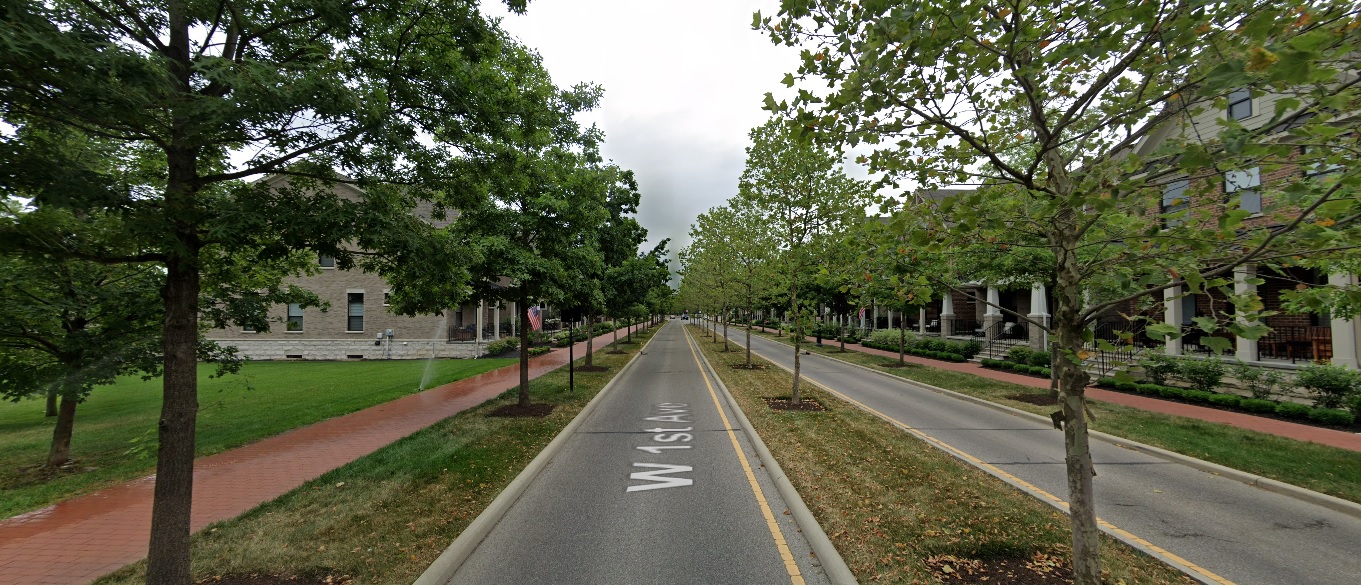
First Avenue, looking northeast at Edgehill Road.
Before: 2012
After: 2021
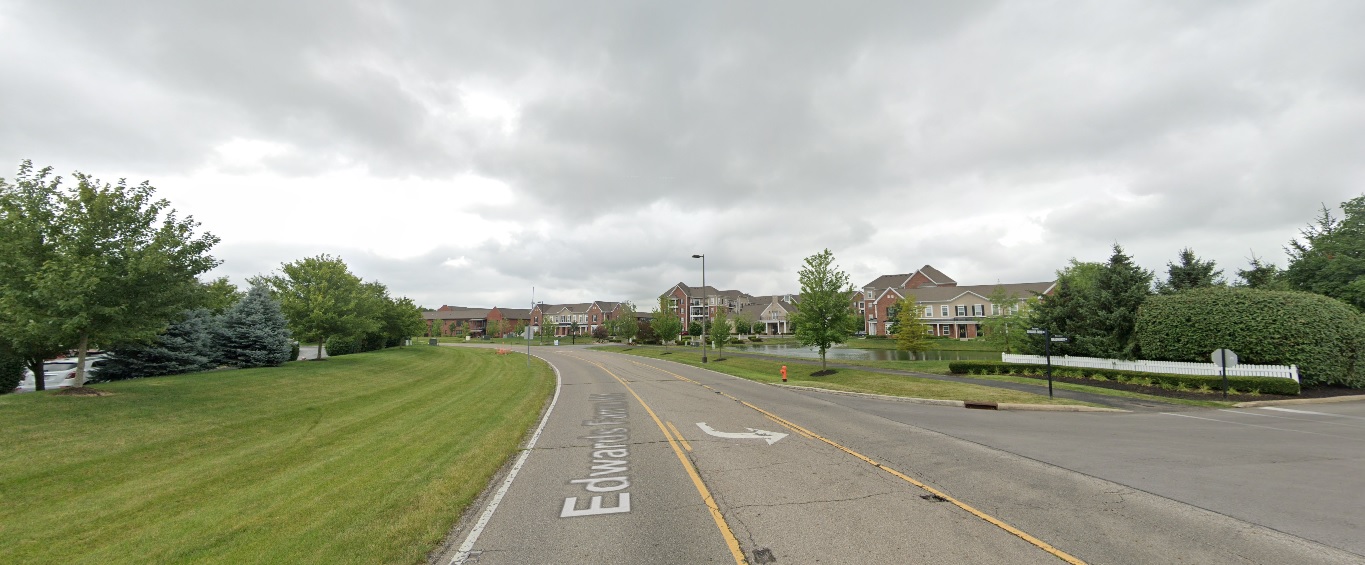
Dublin
Edwards Farms Drive, looking south at Frawley Drive.
Before: 2011
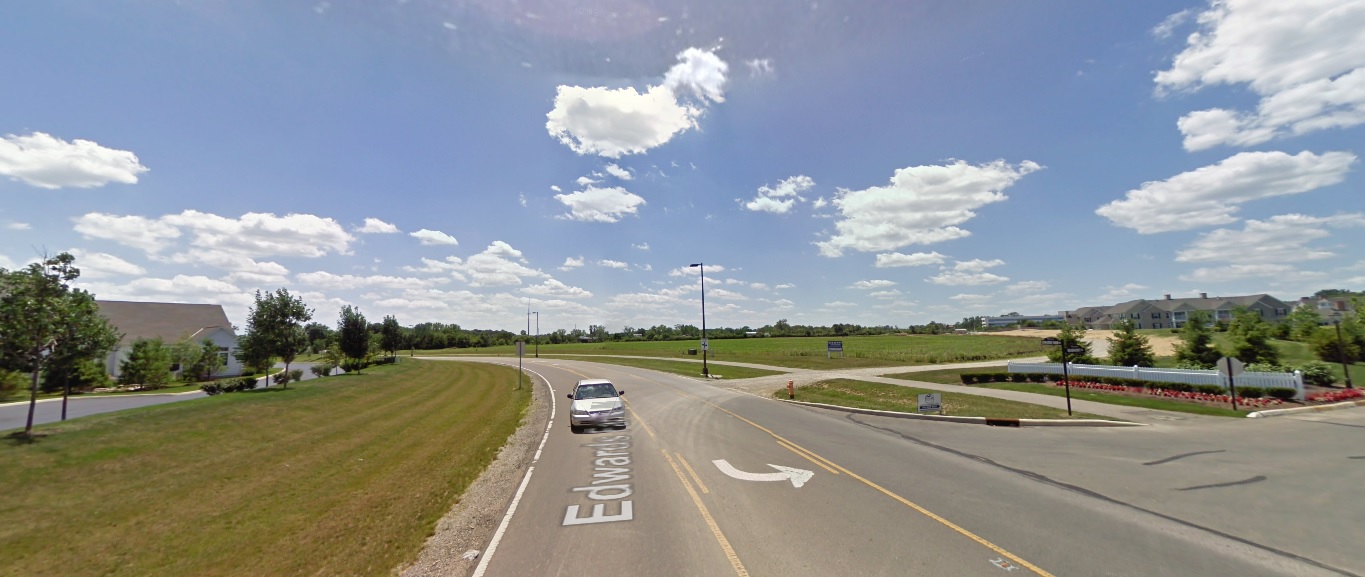
After: 2021
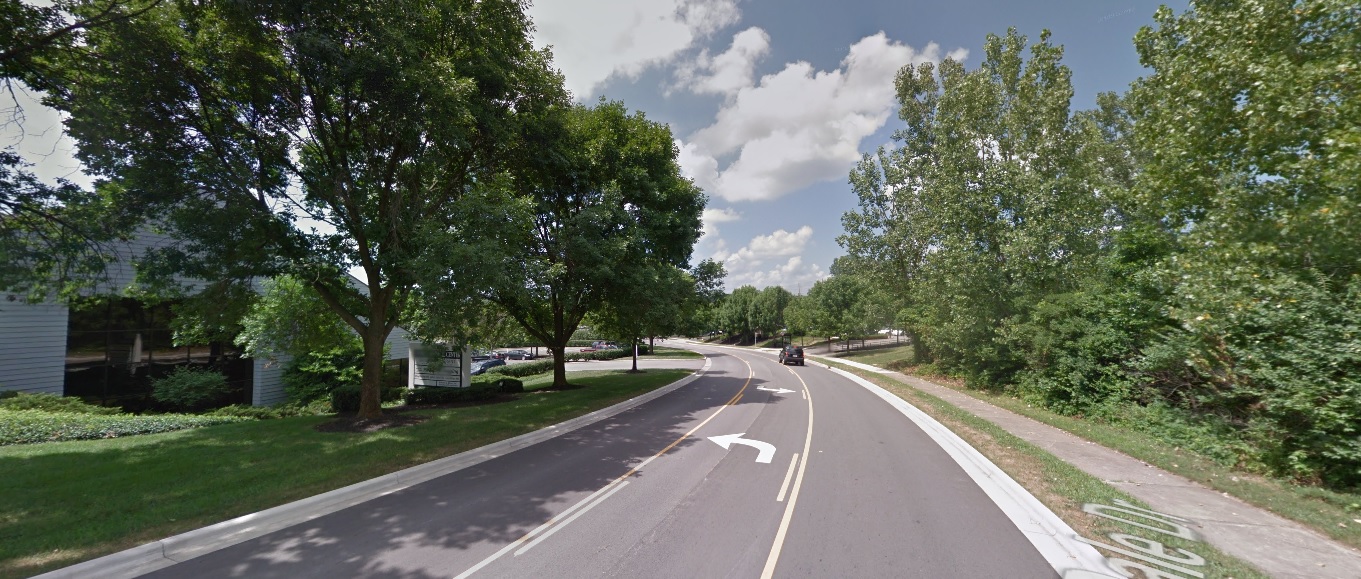
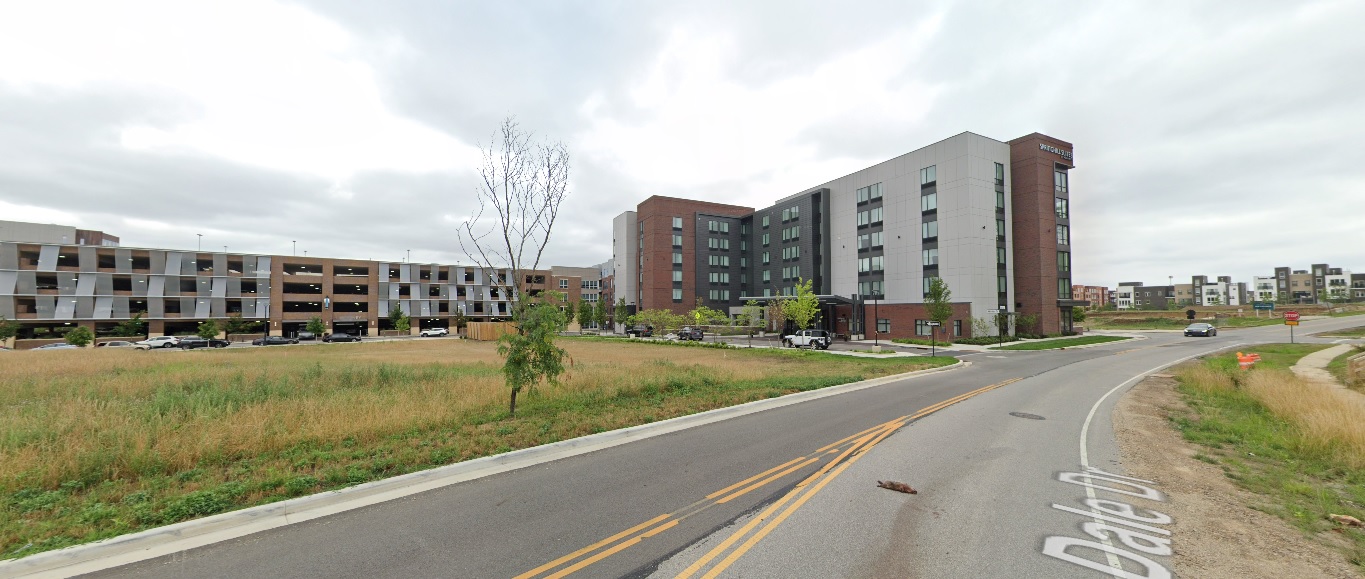
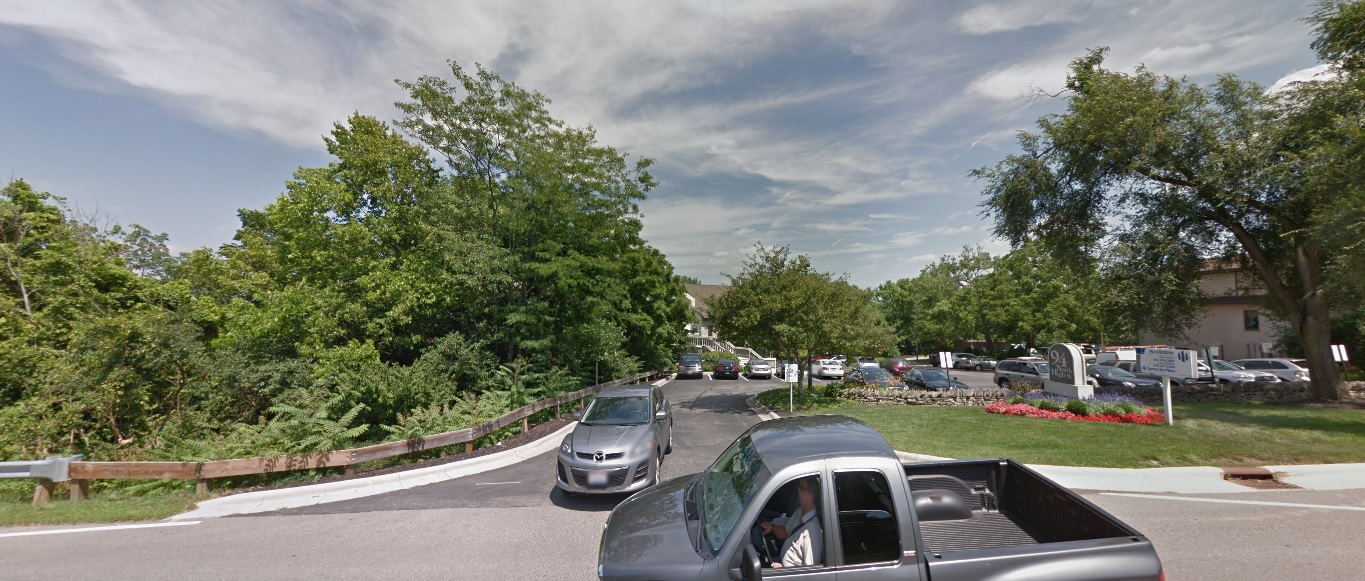
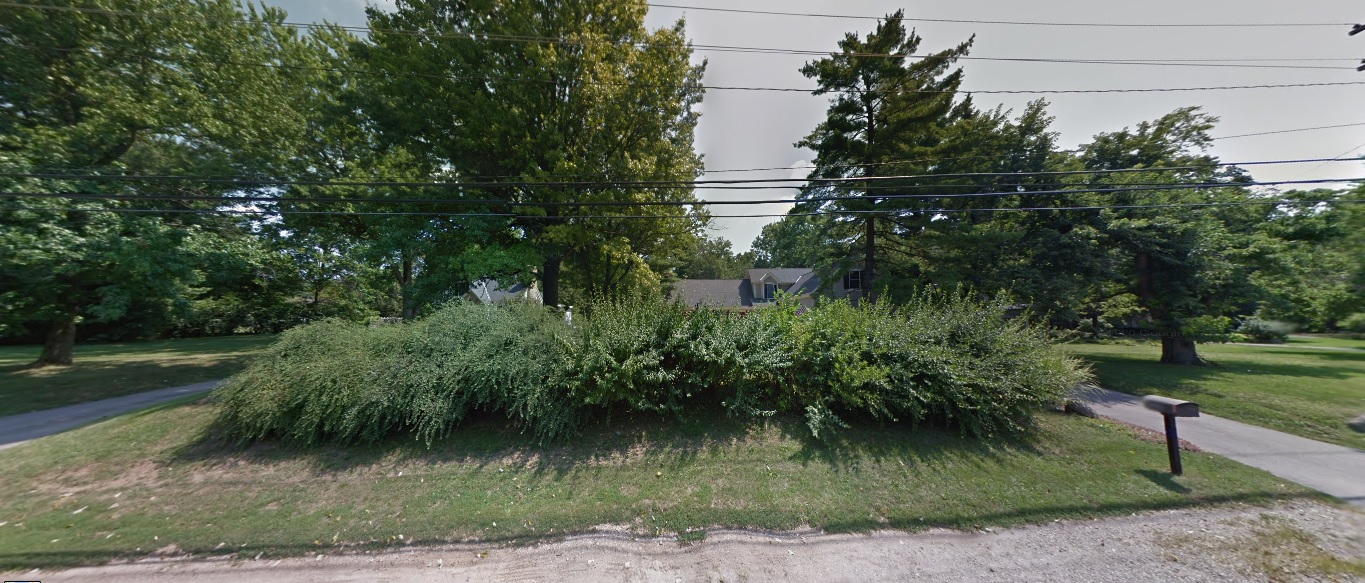
Dale Drive, looking northwest north of Banker Drive.
Before: 2011
After: 2021
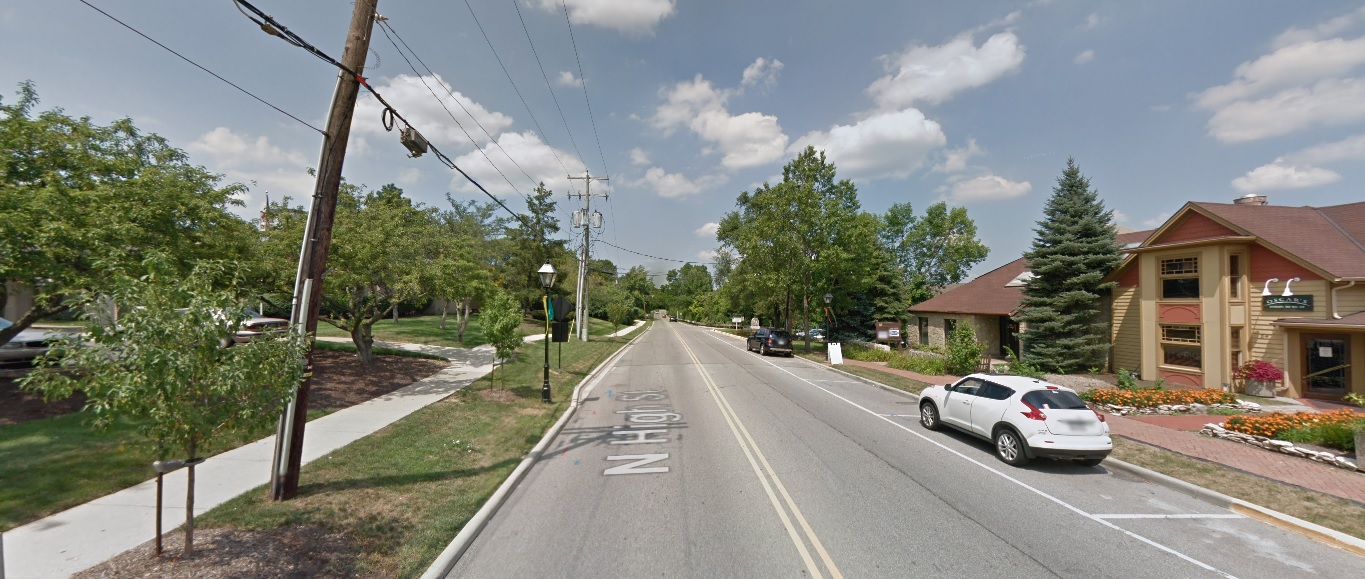
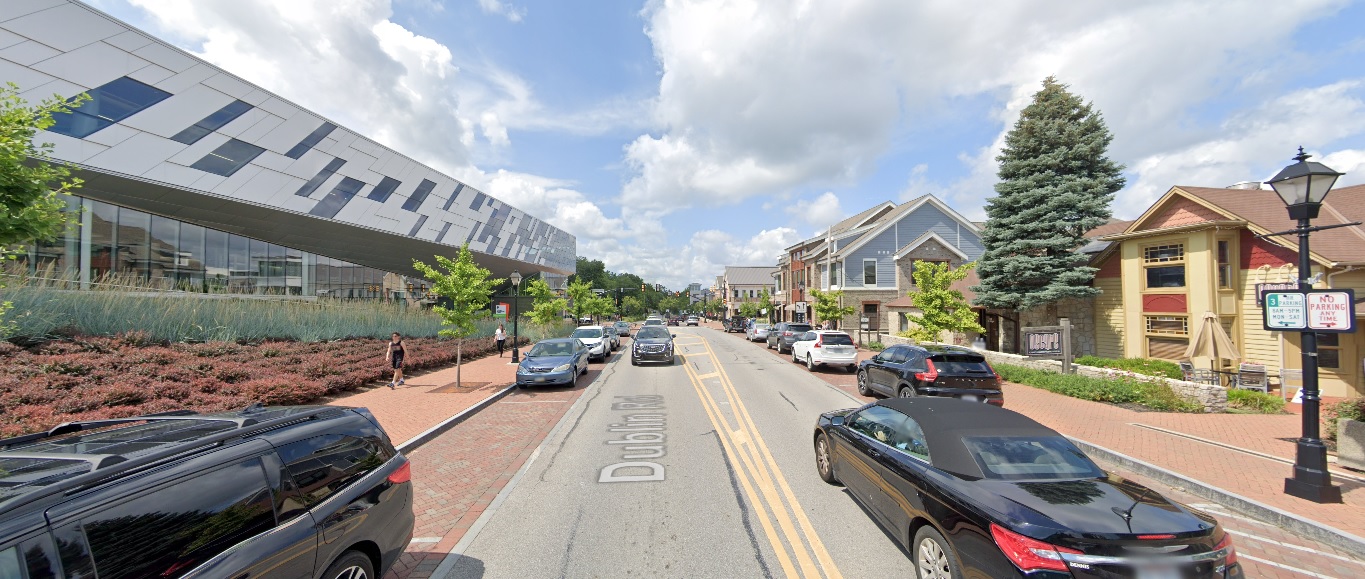
High Street, looking north from North Street.
Before: 2011
After: 2021
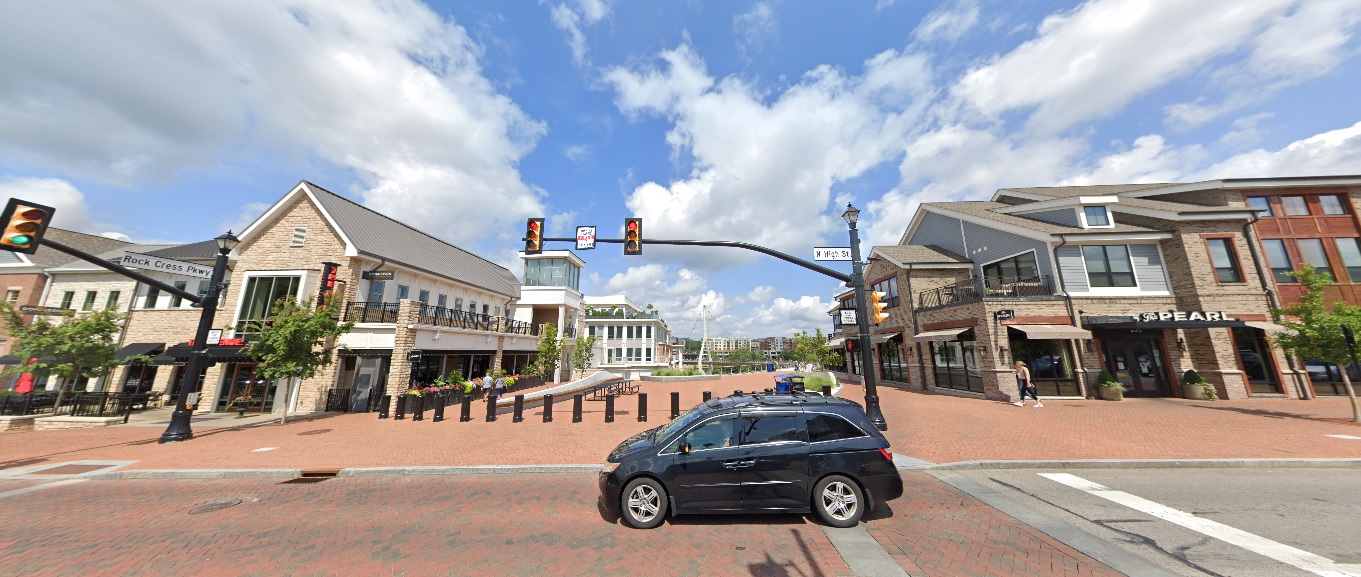
High Street, looking east at Rock Cress Parkway.
Before: 2011
After: 2021
Upper Arlington
Riverside Drive, looking east just south of Bethel Road.
Before: 2011
After: 2021
Bexley
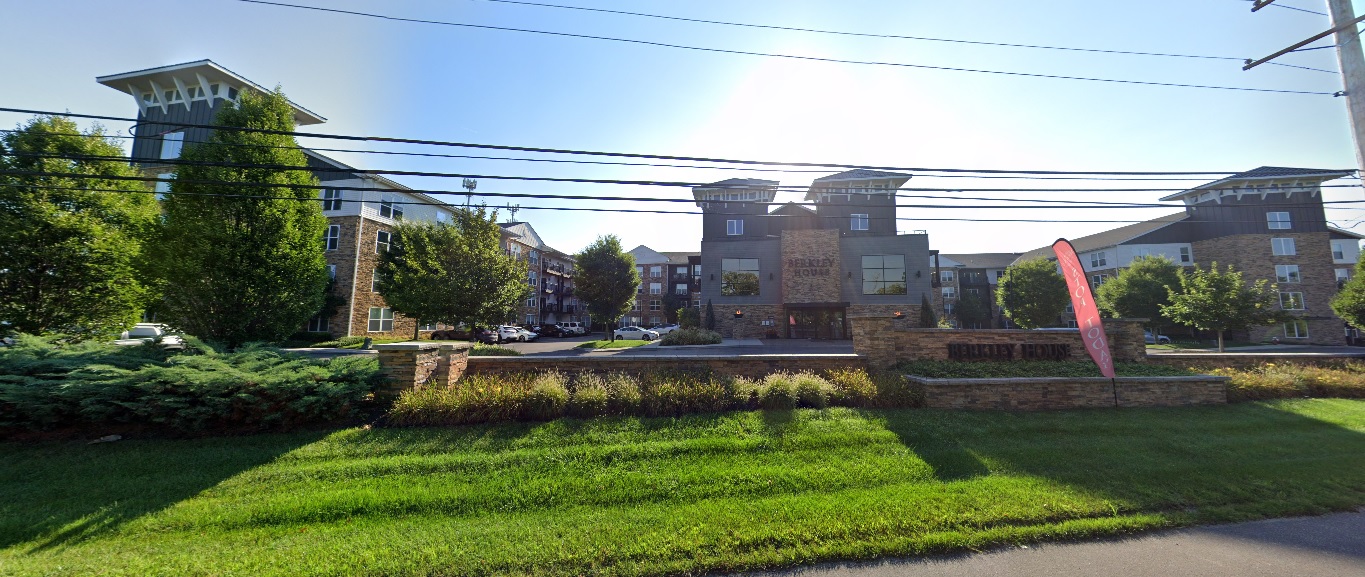
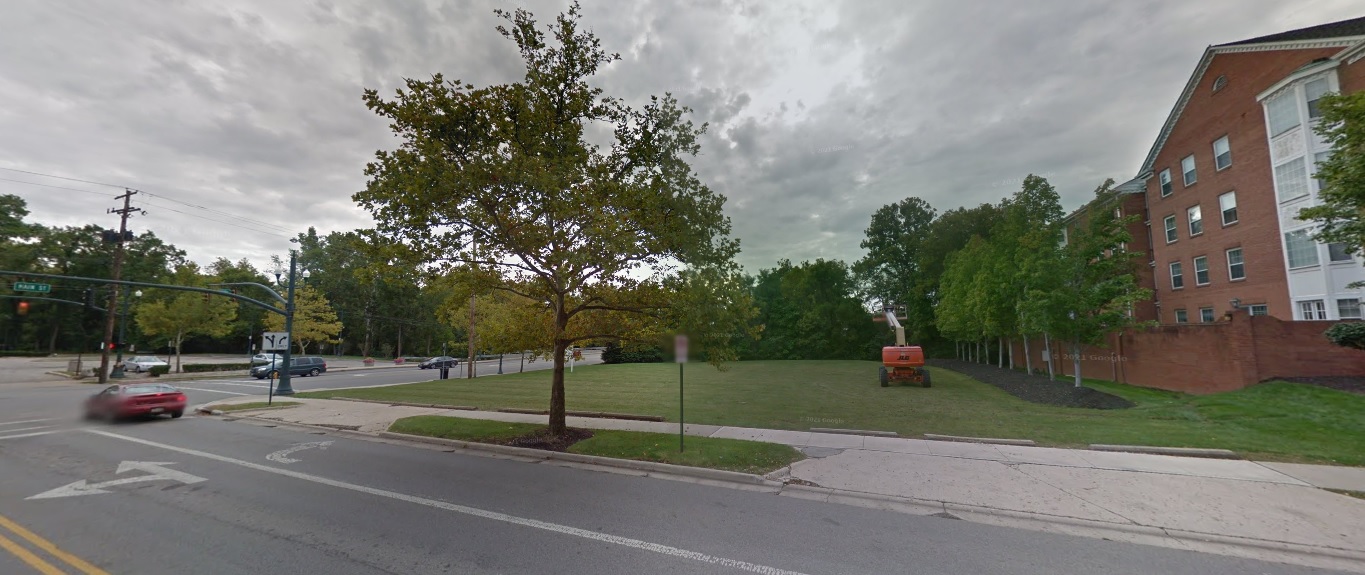
Parkview Avenue, looking southwest just north of Main Street.
Before: 2011
After: 2021

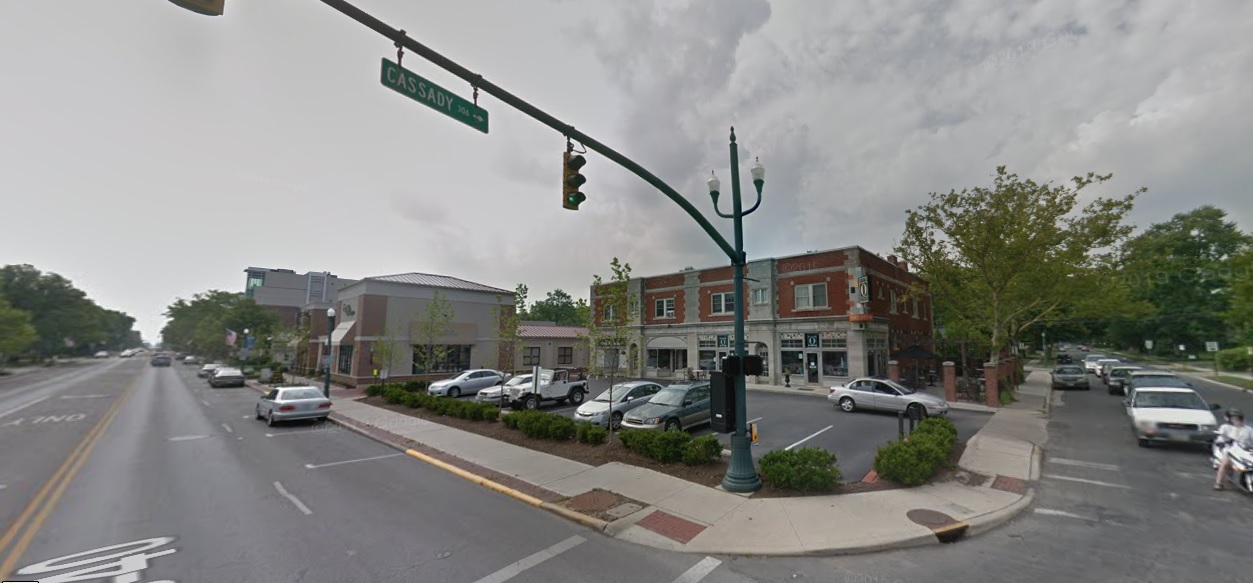
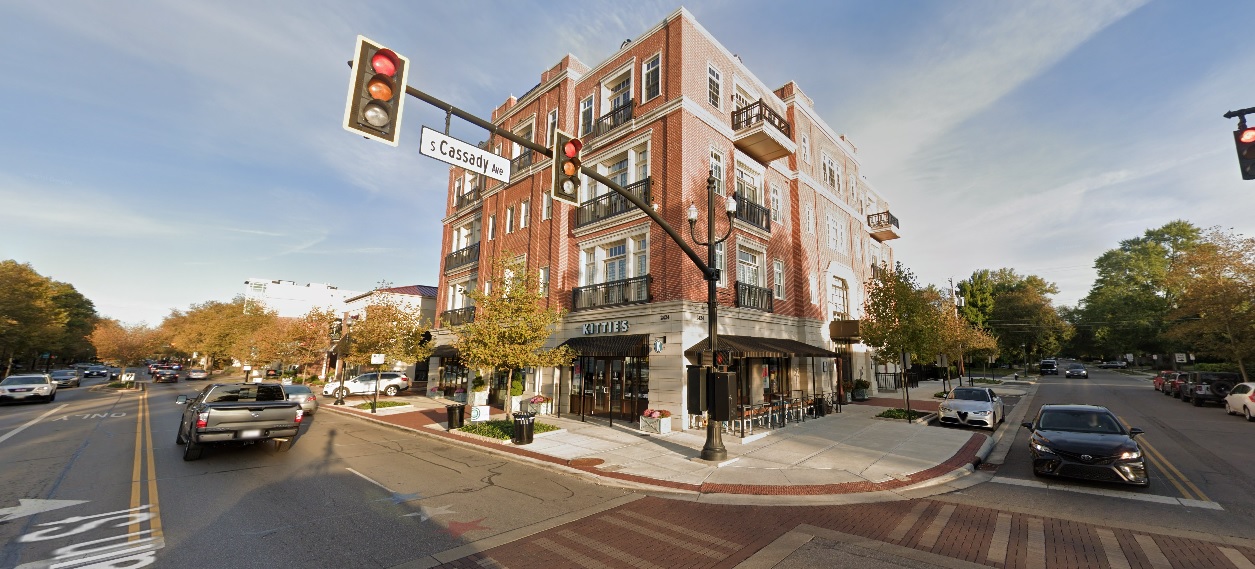
Main Street, looking northwest at Cassady Avenue.
Before: 2011
After: 2021
As I stated in the previous installment, these photos still just represent a small fraction of the development and changes that have occurred across the city and its suburbs in the past decade. These are meant to be representative of those changes, not to suggest that other neighborhoods not featured didn’t change as well. Either way, enjoy!
This 2-part before and after series highlights many projects that have changed the landscape around the city. Many other projects that will continue to transform the area for the next decade and beyond are still in development or construction phases. A list of local area commissions provide monthly updates on potential new projects around the city.