The Housing Market Update September 2022 data from Columbus Realtors continued to support that the local housing shortage is as bad as ever, with low supplies and rising prices.
Note: LSD= Local School District, CSD= City School District. In both cases, school district boundaries differ from city boundaries.
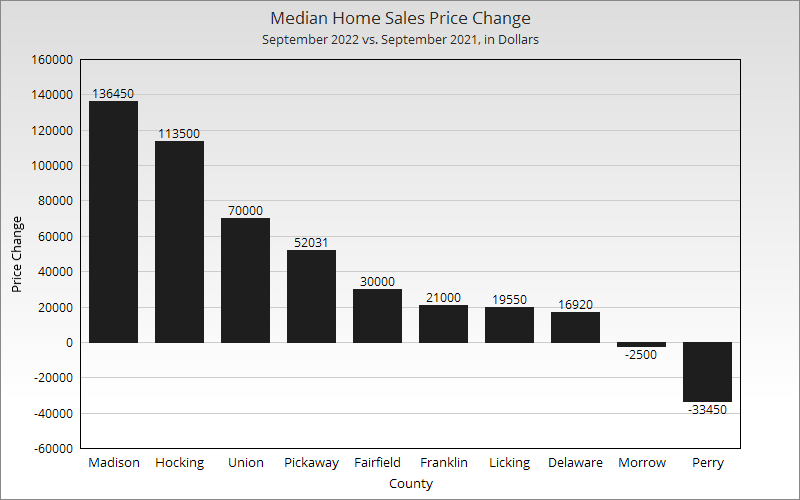
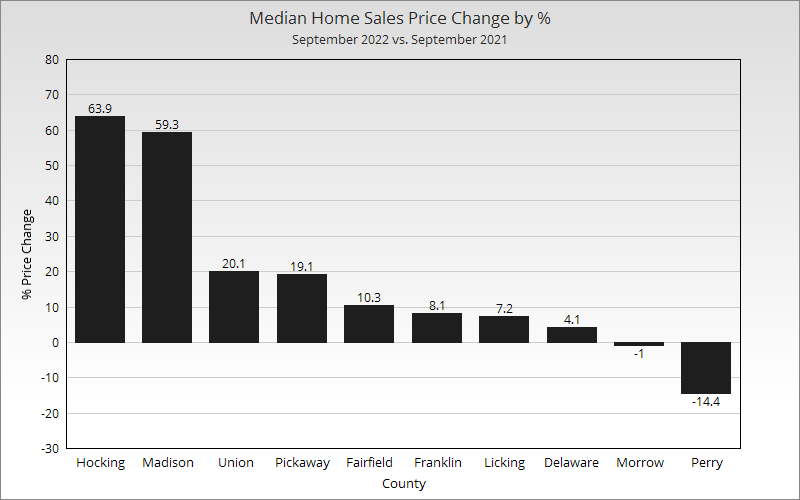
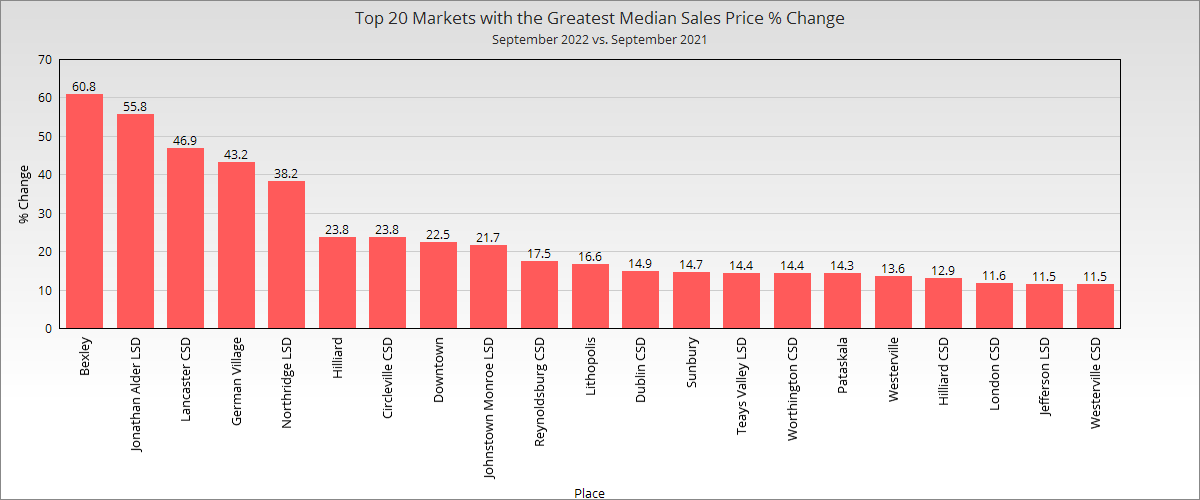
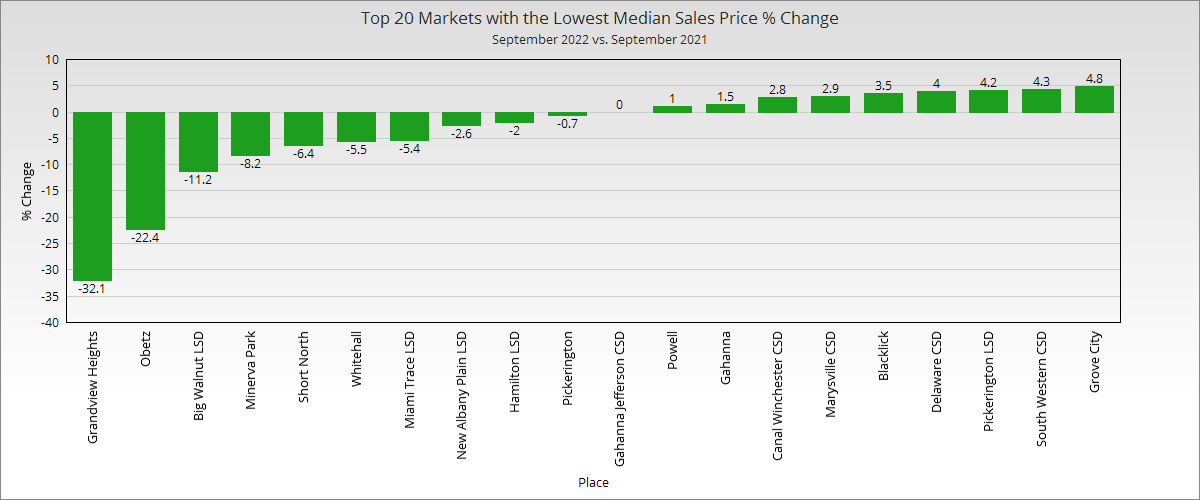
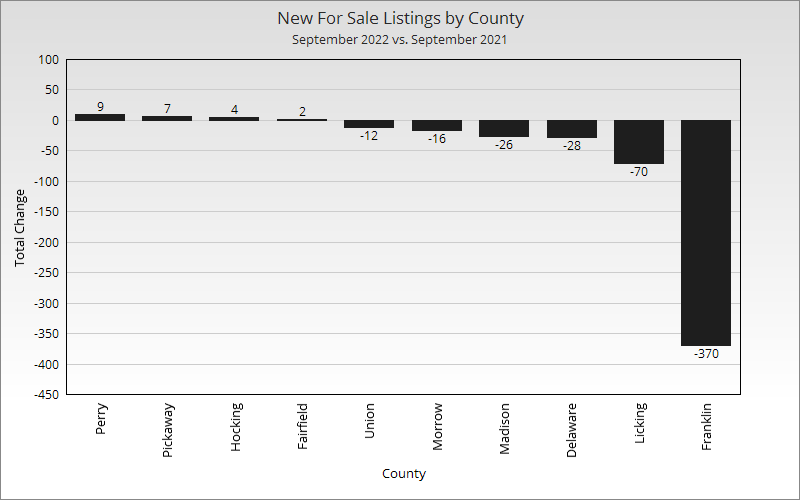
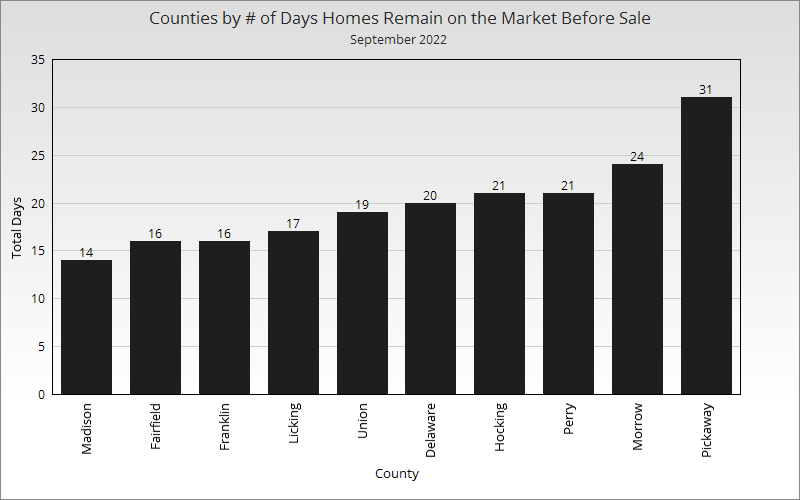
The least populated counties saw some of the largest swings either positively or negatively, which is typically the case given that prices can be determined by a much smaller number of home sales.
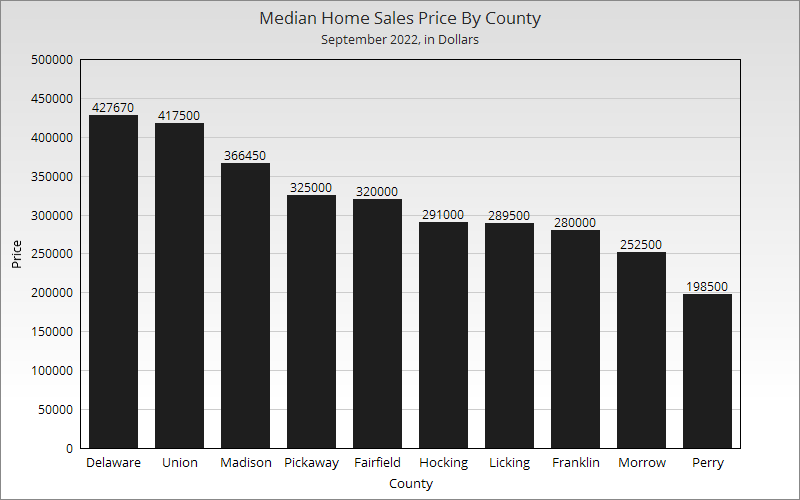
Overall Market Median Sales Price in September 2022: $316,812 Based on the 10 Columbus Metro Area counties, the metro price saw about a $10,000 increase over August 2022 and a more than $42,000 increase versus September 2021. Overall Market Median Sales Price % Change in September 2022 versus September 2021: +15.4%
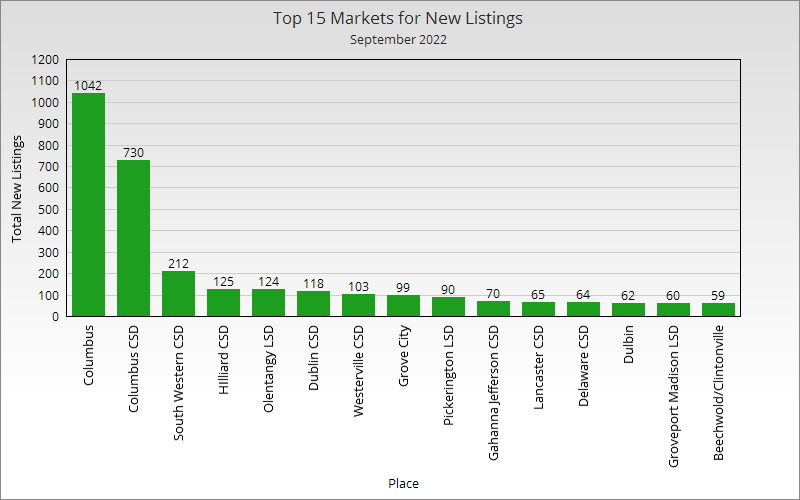
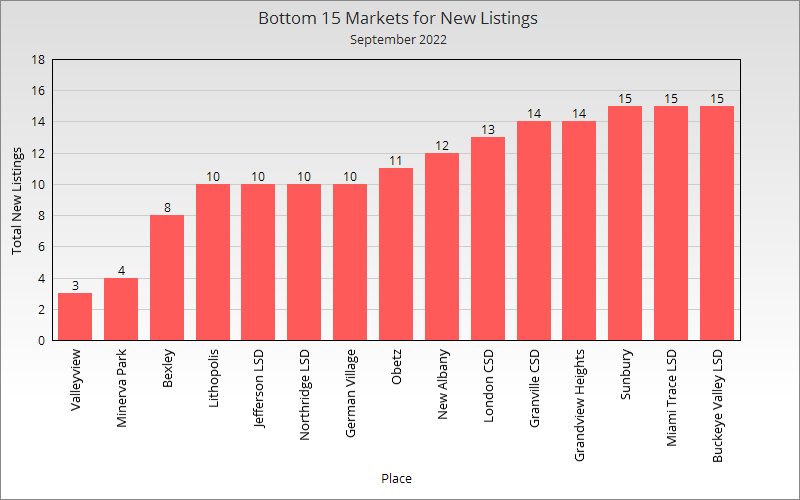
Now let’s take a look at individual neighborhoods and places within the metro area.
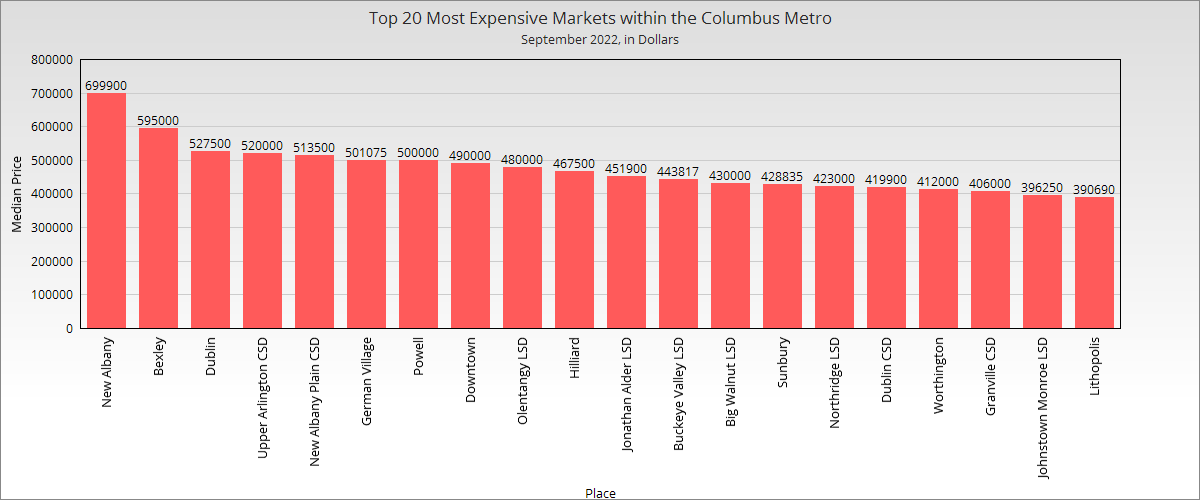
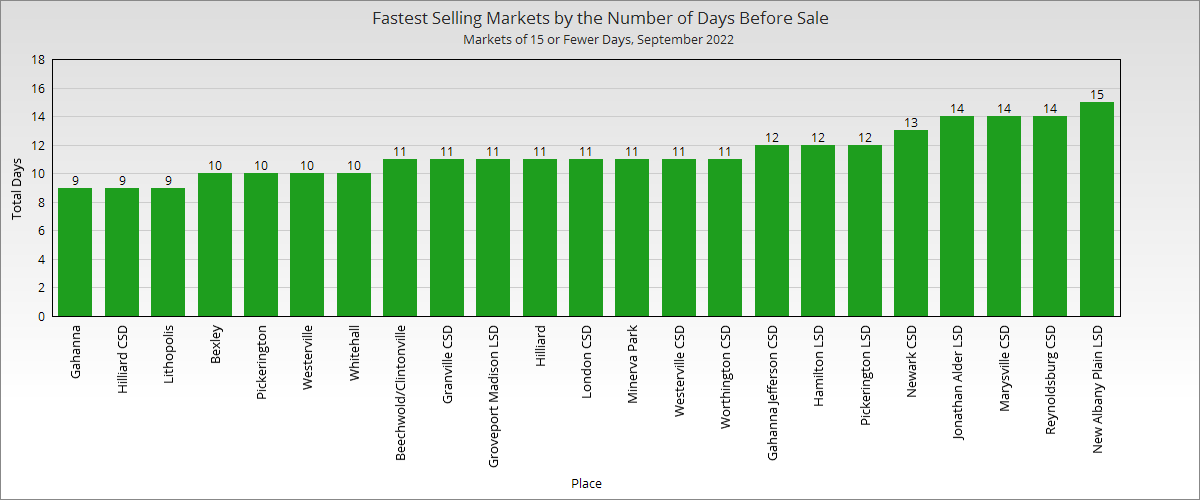
New Albany and some of the other expected suburbs continued to top the charts, but with prices not quite as high as over the summer.
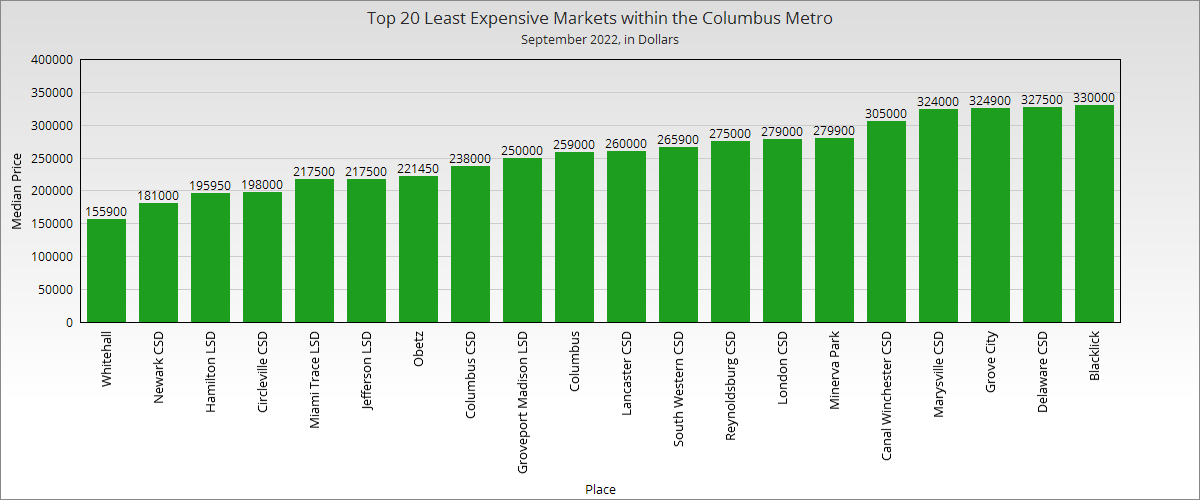
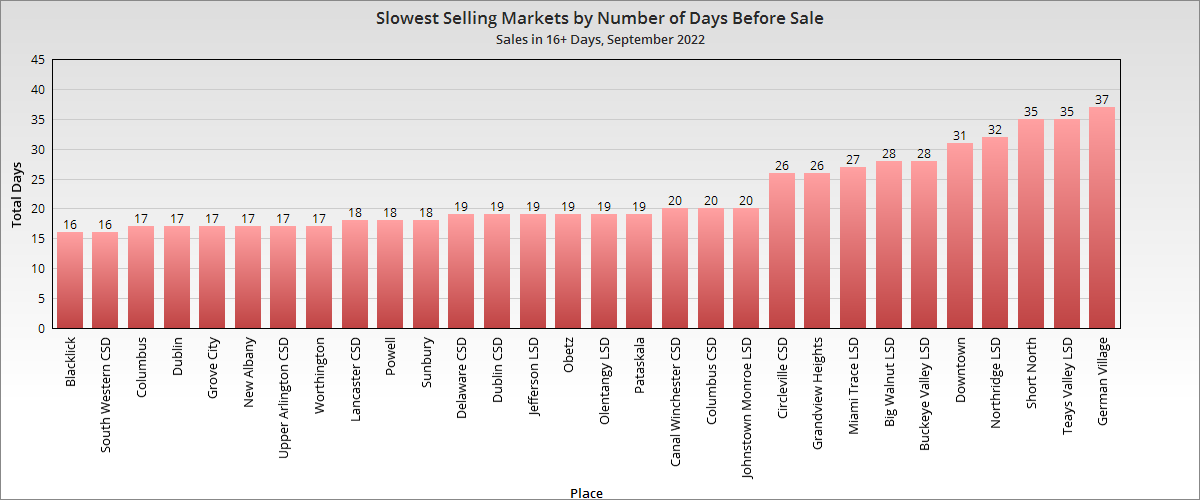
Just 4 local markets out of more than 50 remained below the $200K market in September. Columbus itself was in it usual spot closer to the *relatively* more affordable bottom.
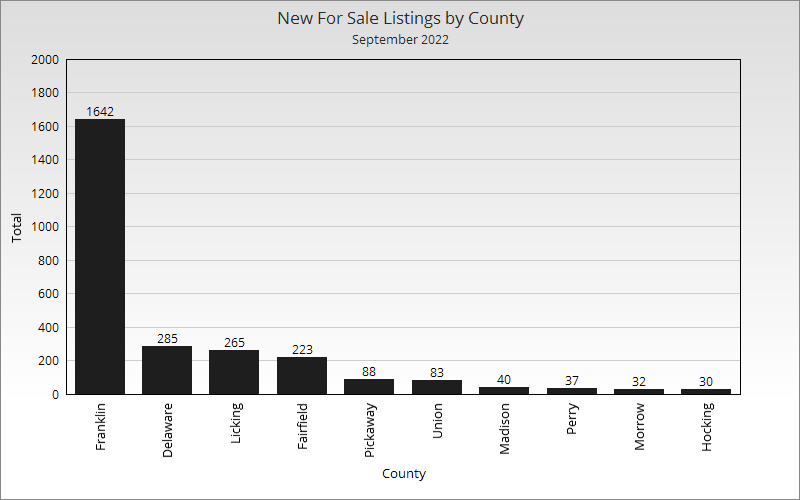
Total Metro New Listings in September 2022: 2,725 Total Metro New Listings Change from September 2021 to September 2022: -500 Year-over-year, new listings were down significantly across the metro area, but especially in Franklin County.
Average # of Days Homes Remain on the Market Before Sale for the Metro Overall in September 2022: 19.9 # of Days Homes Remain on the Market Before Sale for the Metro September 2021 vs. September 2022: -0.3 Homes across the market sold slightly faster than a year ago, but largely due to significant drops in a few rural counties. Most counties saw small increases.
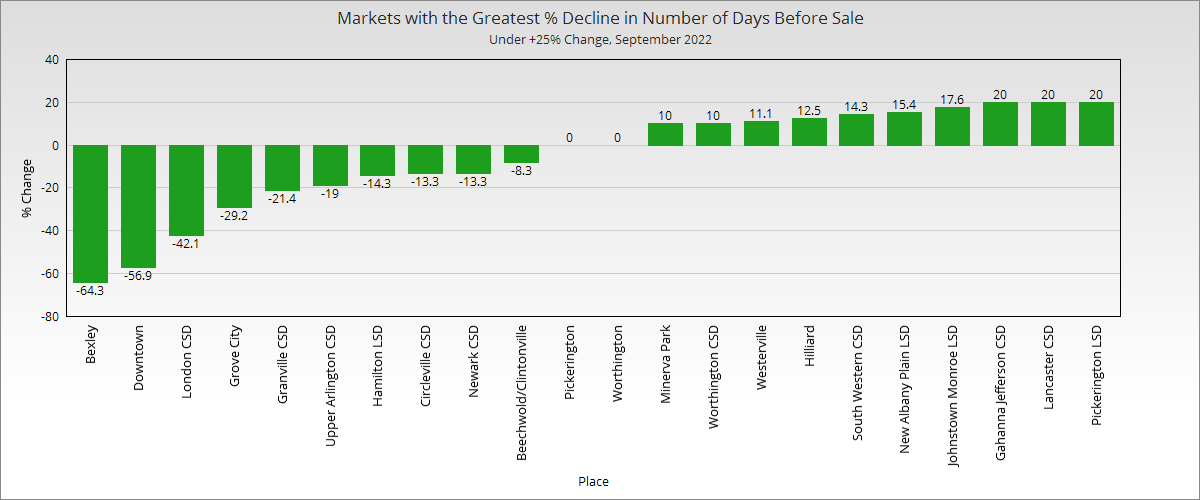
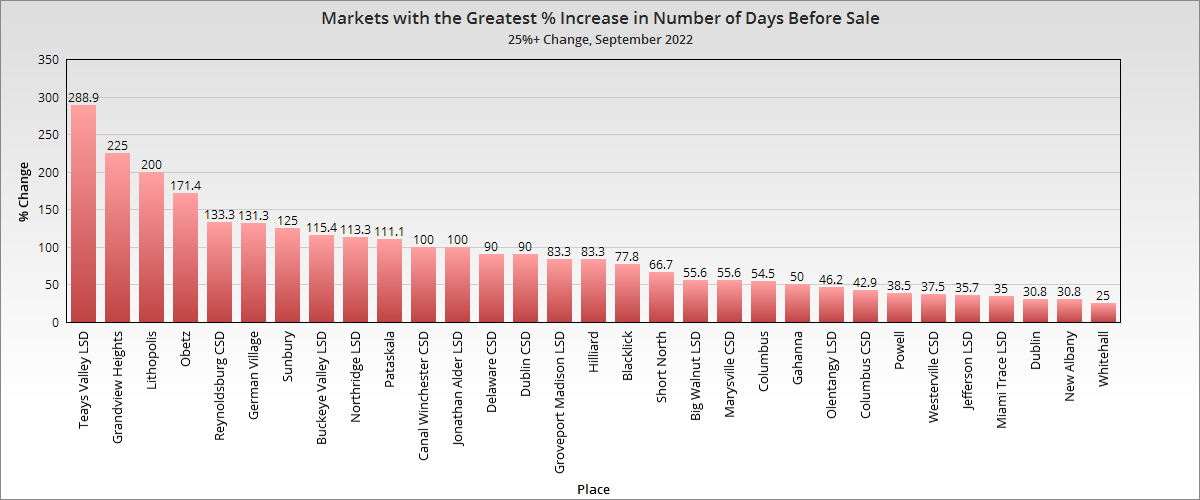
The vast majority of local markets saw substantial increases in the number of days before sale, which is pretty much the only measurement indicating the seller’s market may finally be showing some signs of weakness.
The local housing market update March 2022 has been release by Columbus Realtors. Here are the numbers!
Note: LSD= Local School District, CSD= City School District. In both cases, school district boundaries differ from city boundaries.
Top 15 Most Expensive Locations By Median Sales Price in March 2022 1. New Albany: $682,500 2. German Village: $667,500 3. Powell: $638,000 4. New Albany Plain LSD: $535,000 5. Grandview Heights: $535,000 6. Upper Arlington CSD: $525,000 7. Big Walnut LSD: $520,000 8. Olentangy LSD: $500,000 9. Dublin: $481,000 10. Short North: $480,000 11. Granville CSD: $460,000 12. Dublin CSD: $430,000 13. Jonathan Alder LSD: $413,500 14. Bexley: $410,000 15. Pickerington: $408,000 16. Worthington: $408,000
Top 15 Least Expensive Locations by Median Sales Price in March 2022 1. Whitehall: $160,250 2. Circleville CSD: $162,500 3. Newark CSD: $180,000 4. Lancaster CSD: $180,000 5. Hamilton LSD: $185,000 6. Obetz: $209,000 7. Miami Trace: $214,000 8. Columbus CSD: $234,000 9. Groveport Madison LSD: $237,500 10. Jefferson LSD: $240,950 11. Columbus: $248,000 12. London CSD: $250,000 13. South-Western CSD: $260,000 14. Blacklick: $270,000 15. Reynoldsburg CSD: $286,250
Overall Market Median Sales Price in March: $279,265 Based on the 10 Columbus Metro Area counties.
Top 15 Locations with the Highest Median Sales Price % Growth Between March 2021 and March 2022 1. Johnstown-Monroe LSD: +60.0% 2. Miami Trace LSD: +40.9% 3. German Village: +40.4% 4. Reynoldsburg CSD: +39.5% 5. Teays Valley LSD: +36.9% 6. Big Walnut LSD: +35.1% 7. Jefferson LSD: +30.2% 8. Jonathan Alder LSD: +29.2% 9. Pataskala: +28.6% 10. Northridge LSD: +28.5% 11. Groveport Madison LSD: +28.4% 12. Canal Winchester CSD: +25.6% 13. Hilliard CSD: +24.7% 14. Delaware CSD: +24.3% 15. Newark CSD: +23.3%
Top 15 Locations with the Lowest Median Sales Price % Growth Between March 2021 and March 2022 1. Circleville CSD: -22.6% 2. Lithopolis: -15.6% 3. Obetz: -8.1% 4. Buckeye Valley LSD: -3.0% 5. Bexley: -0.7% 6. London CSD: -0.4% 7. New Albany Plain LSD: +2.2% 8. Dublin CSD: +2.6% 9. Blacklick: +2.7% 10. Dublin: +4.1% 11. Grove City: +4.4% 12. New Albany: +4.7% 13. Sunbury: +5.5% 14. Worthington CSD: +9.7% 15. Westerville: +10.1%
Curiously, New Albany has not yet seen significant housing cost increases despite the news of the Intel development announced a few months ago, but that may just be due to the fact that housing prices there exceed all other markets by a good margin already.
Overall Market Median Sales Price % Change March 2022 vs. March 2021:+19.6% Based on 52 metro market locations.
Top 10 Locations with the Most New Listings in March 2022 1. Columbus: 1,161 2. Columbus CSD: 773 3. South Western CSD: 205 4. Olentangy LSD: 151 5. Westerville CSD: 144 6. Hilliard CSD: 121 7. Dublin CSD: 113 8. Pickerington LSD: 94 9. Worthington CSD: 85 10. Grove City: 84
Top 10 Locations with the Fewest New Listings in March 2022 1. Valleyview: 1 2. Minerva Park: 1 3. Lithopolis: 3 4. Sunbury: 10 5. Northridge LSD: 10 6. Obetz: 12 7. Johnstown Monroe LSD: 12 8. German Village: 13 9. Powell: 13 10. Jefferson LSD: 14 11. Whitehall: 14
Total New Listings in the Columbus Metro in March 2022:+2,901 Overall Metro New Listings % Change March 2022 vs March 2021:+3.7%
New listings did increase in March versus a year ago, but only slightly. Listings tend to increase as the weather warms up.
Top 10 Fastest-Selling Locations by # of Days Homes Remain on the Market Before Sale in March 2022 1. Lithopolis: 2 2. Miami Trace LSD: 3 3. Minerva Park: 3 4. Pickerington: 4 5. German Village: 5 6. Westerville: 5 7. Worthington: 5 8. Worthington CSD: 5 9. Dublin: 7 10. Gahanna: 7 11. Groveport Madison LSD: 7 12. New Albany: 7
Top 10 Slowest-Selling Locations by # of Days Homes Remain on the Market Before Sale in March 2022 1. Northridge LSD: 78 2. Downtown: 60 3. Granville CSD: 52 4. Short North: 51 5. Grandview Heights: 38 6. Oberz: 27 7. Circleville CSD: 25 8. Delaware CSD: 22 9. Hamilton LSD: 22 10. Johnstown Monroe LSD: 22
Top 10 Locations with the Greatest % Decline of # of Days on the Market Before Sale March 2022 vs. March 2021 1. Lithopolis: -96.6% 2. Miami Trace LSD: -85.7% 3. Pickerington: -84.6% 4. Dublin: -81.1% 5. Worthington CSD: -76.2% 6. Big Walnut LSD: -75.5% 7. Worthington: -72.2% 8. German Village: -70.6% 9. Westerville: -68.8% 10. Powell: -67.3%
Top 10 Locations with the Lowest % Decline of # of Days on the Market Before Sale March 2022 vs. March 2021 1. Canal Winchester CSD: +466.7% 2. Johnstown Monroe LSD: +450.0% 3. Northridge LSD: +254.5% 4. Granville CSD: +126.1% 5. Hilliard: +100.0% 6. Hamilton LSD: +69.2% 7. Obetz: +50.0% 8. Whitehall: +44.4% 9. London CSD: +30.0% 10. Grove City: +28.6% 11. Teays Valley LSD: +28.6%
% Change for the # of Days Homes Remain on the Market Before Sale Across the Metro Overall: 20.4 Overall Metro Days on Market % Change March 2022 vs March 2021: -12.1%
The local housing market update May 2021 is finally out, and the trends continue to show a strong sellers market. Prices continued to accelerate upward and supply continued to lag way behind, pushing home sales to occur even faster than they have been in recent months.
Note: LSD= Local School District, CSD= City School District. In both cases, school district boundaries differ from city boundaries.
Top 15 Most Expensive Locations By Median Sales Price in May 2021 1. New Albany: $810,000 2. German Village: $630,000 3. New Albany Plain LSD: $570,000 4. Dublin: $528,750 5. Bexley: $497,500 6. Upper Arlington CSD: $495,000 7. Worthington: $461,420 8. Powell: $460,000 9. Dublin CSD: $450,000 10. Olentangy LSD: $445,000 11. Buckeye Valley LSD: $406,790 12. Granville CSD: $402,500 13. Short North: $400,450 14. Grandview Heights: $394,000 15. Jonathan Alder LSD: $390,000
New Albany proper posted an astronomical median price in May, reaching unprecedented numbers for a Columbus suburb.
Top 15 Least Expensive Locations by Median Sales Price in May 2021 1. Whitehall: $138,000 2. Valleyview: $157,500 3. Groveport Madison LSD: $175,825 4. Lancaster CSD: $176,000 5. Circleville CSD: $182,000 6. Newark CSD: $184,250 7. Jefferson LSD: $207,500 8. Columbus CSD: $220,000 9. London CSD: $225,000 10. Hamilton LSD: $237,000 11. Columbus: $240,000 12. Reynoldsburg CSD: $245,500 13. South-Western CSD: $249,900 14. Canal Winchester CSD: $260,000 15. Teays Valley LSD: $268,894
In general, the further out the place from Columbus, the cheaper the location, but there are some exceptions. Whitehall and Columbus proper remain relatively affordable compared to most locations in the metro.
Overall Market Median Sales Price in May 2021: $227,088 The overall market is defined by Columbus Metro Area counties.
Top 15 Locations with the Highest Median Sales Price % Growth Between May 2020 and May 2021 1. German Village: +59.5% 2. Worthington: +54.6% 3. Obetz: +52.2% 4. New Albany Plain LSD: +40.7% 5. Hamilton LSD: +39.4% 6. Dublin CSD: +32.0% 7. Delaware CSD: +32.0% 8. Dublin: +31.4% 9. Pickerington: +30.3% 10. New Albany: +29.7% 11. Newark CSD: +29.4% 12. Worthington CSD: +29.1% 13. Westerville CSd: +28.6% 14. Pataskala: +27.0% 15. Jonathan Alder LSD: +25.8%
Top 15 Locations with the Lowest Median Sales Price % Growth Between May 2020 and May 2021 1. Lancaster CSD: -7.3% 2. Jefferson LSD: -5.5% 3. Downtown Columbus: -4.2% 4. Hilliard: -0.5% 5. Teays Valley LSD: +3.5% 6. Powell: +5.1% 7. Big Walnut LSD: +6.2% 8. Grandview Heights: +6.8% 9. Granville CSD: +7.6% 10. Short North: +7.6% 11. Canal Winchester CSD: +8.3% 12. Minerva Park: +8.4% 13. London CSD: +10.3% 14. Circleville CSD: +11.3% 15. Buckeye Valley LSD: +11.4%
There were fewer locations down year-over-year in May than in previous months, though urban areas generally saw lower increases.
Overall Market Median Sales Price % Change May 2021 vs. May 2020: +18.6%
Top 10 Locations with the Most New Listings in May 2021 1. Columbus: 1,467 2. Columbus CSD: 972 3. South-Western CSD: 217 4. Hilliard CSD: 171 5. Westerville CSD: 168 6. Olentangy LSD: 166 7. Dublin CSD: 166 8. Worthington CSD: 118 9. Pickerington LSD: 115 10. Upper Arlington CSD: 101
Top 10 Locations with the Fewest New Listings in May 2021 1. Valleyview: 2 2. Lithopolis: 5 3. Minerva Park: 5 4. Jefferson LSD: 6 5. Obetz: 8 6. Sunbury: 8 7. Grandview Heights: 10 8. Johnstown-Monroe LSD: 11 9. Whitehall: 12 10. Circleville CSD: 14
Urban areas and major suburbs saw increases in supply versus previous months, but because sales were also stronger, it didn’t help with actual supply or prices.
Total New Listings in the Columbus Metro in May 2021: +3,468 Overall Metro New Listings % Change May 2021 vs May 2020: +14.3%
Top 10 Fastest-Selling Locations by # of Days Homes Remain on the Market Before Sale in May 2021 1. Jonathan Alder LSD: 3 2. Valleyview: 3 3. Canal Winchester CSD: 4 4. Groveport Madison LSD: 4 5. Lithopolis: 4 6. German Village: 5 7. Worthington: 5 8. Worthington CSD: 5 9. Beechwold/Clintonville: 6 10. Blacklick: 6 11. Gahanna: 6 12. Marysville CSD: 6 13. Pickerington LSD: 6 14. Powell: 6 15. Westerville CSD: 6 16. Whitehall: 6
Top 10 Slowest-Selling Locations by # of Days Homes Remain on the Market Before Sale in May 2021 1. Short North: 51 2. Downtown Columbus: 39 3. Johnstown-Monroe LSD: 28 4. Bexley: 25 5. Lancaster CSD: 25 6. Jefferson LSD: 23 7. Obetz: 22 8. Buckeye Valley LSD: 21 9. Dublin: 19 10. Olentangy LSD: 18
Top 10 Locations with the Greatest % Decline of # of Days on the Market Before Sale May 2021 vs May 2020 1. Powell: -91.2% 2. Jonathan Alder LSD: -90.6% 3. Minerva Park: -85.7% 4. Circleville CSD: -84.2% 5. Whitehall: -82.9% 6. London CSD: -80.0% 7. Sunbury: -78.9% 8. Newark CSD: -78.0% 9. Upper Arlington CSD: -76.5% 10. Granville CSD: -75.8%
Top 10 Locations with the Lowest % Decline of # of Days on the Market Before Sale May 2021 vs May 2020 1. Short North: +264.3% 2. Valleyview: +50.0% 3. Bexley: +13.6% 4. Downtown Columbus: +11.4% 5. Lancaster CSD: -3.8% 6. Teays Valley LSD: -11.1% 7. Dublin: -26.9% 8. Reynoldsburg CSD: -29.4% 9. Westerville: -33.3% 10. Pataskala: -38.5%
% Change for the # of Days Homes Remain on the Market Before Sale Across the Metro Overall: 14
The market’s sales pace only increased further in May, with the entire metro’s supply of homes selling in an average of just 2 weeks. Many locations were selling at far faster rates, however.
A handy link is the Columbus Realtors website, which most of this data is derived from.