June’s Missed Opportunity of the Month


Columbus, as recent estimates show, is clearly becoming a real player on the national stage in terms of its rapid growth and increasing name recognition. There’s a lot to be proud of for a city located in what many people think is just the Rust Belt. But as with every city, Columbus doesn’t get it all right all the time. A while back, I wrote how Columbus could sometimes be a city of missed opportunities when it came to development, and that remains true. For every great project in the Short North, there’s an equally terrible development going up somewhere else. In what I want to be a semi-regular series, I’m going to highlight some projects that simply miss the boat in terms of good urban development. Some are merely not reaching their potential, and then some, like June’s missed opportunity of the month, is an out of left field example that seems to be trying so hard, only to fail equally so.

That project is the redevelopment of the University City strip mall off of Olentangy River Road.
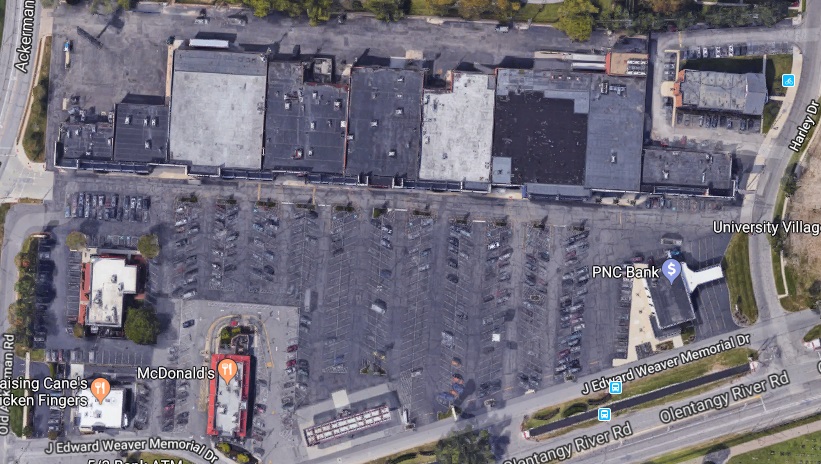
Aerial photo.

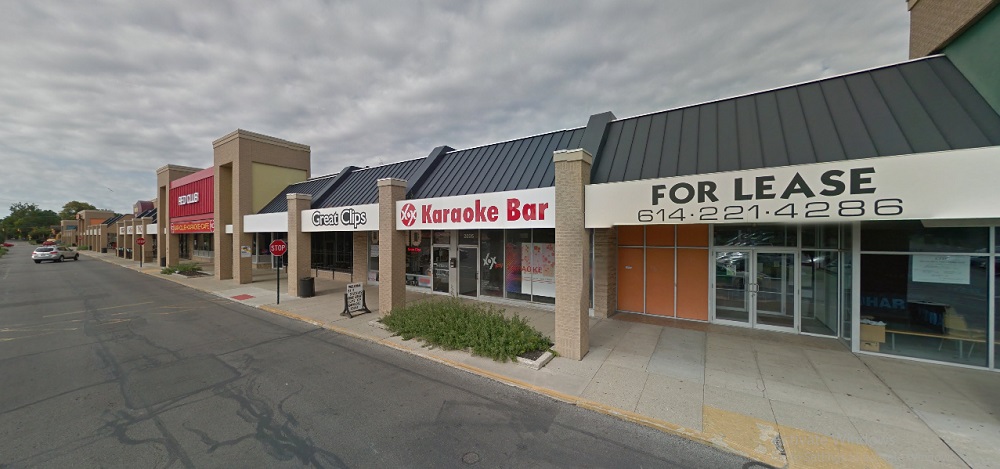
As you can see from the aerial, the site is your typical strip mall. Built in 1961 when such developments were seen as community shopping destinations rather than the dying suburban sprawl they have become, University City is completely nondescript and looks no different than hundreds of others dotting the landscape. Anchored by a Kroger, the strip mall held other stereotypical establishments- a salon, bars, a Chinese restaurant, etc. A handful of out lots contain a McDonald’s, gas station and a bank.


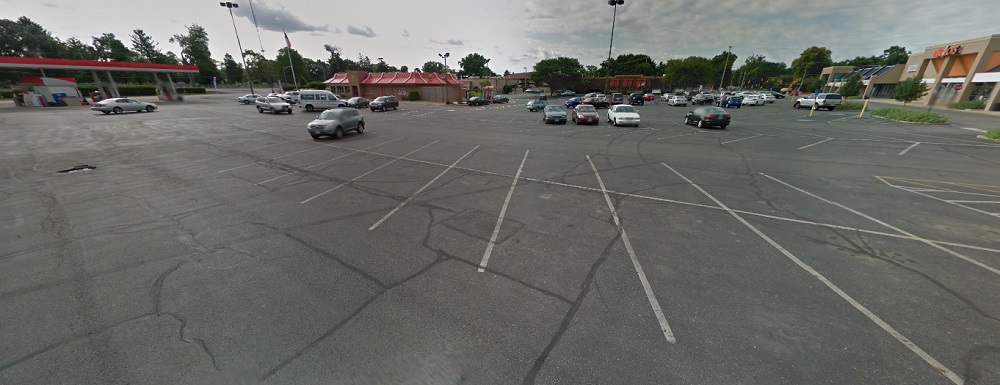
Most of the site, of course, is taken up by enormous amounts of surface parking, most of which sits empty more often than not.

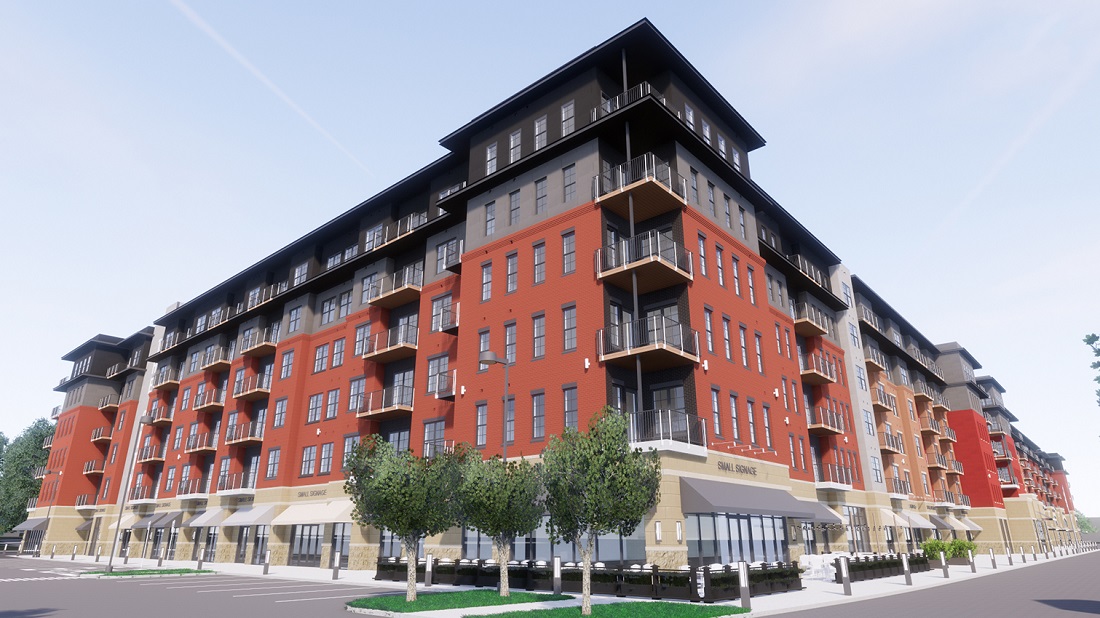
Olentangy River Road is not exactly an urban street. Most of it is lined with hotels, restaurants and offices, all set well back from the road and in a generally unfavorable configuration to encourage walkability. So when it was announced in June of last year that the strip mall would be redeveloped, hope for something substantially different seemed possible. The initial renderings showed a 6-story mixed-use building on the site instead of the strip mall.

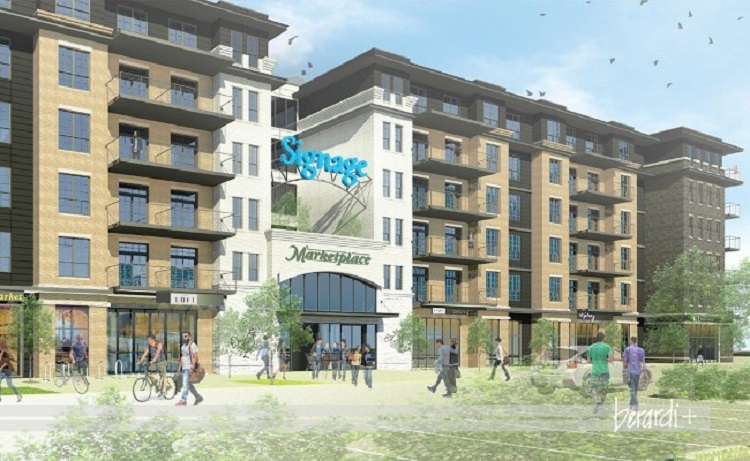
MUCH better, right? Of course, saying it’s much better is a low bar compared to the current situation, but a 6-story, mixed-use project is truly urban, and one of the first of its kind on Olentangy River Road. So why, one might ask, is this a missed opportunity?
To answer that, we have to look at the proposed layout of the entire site.

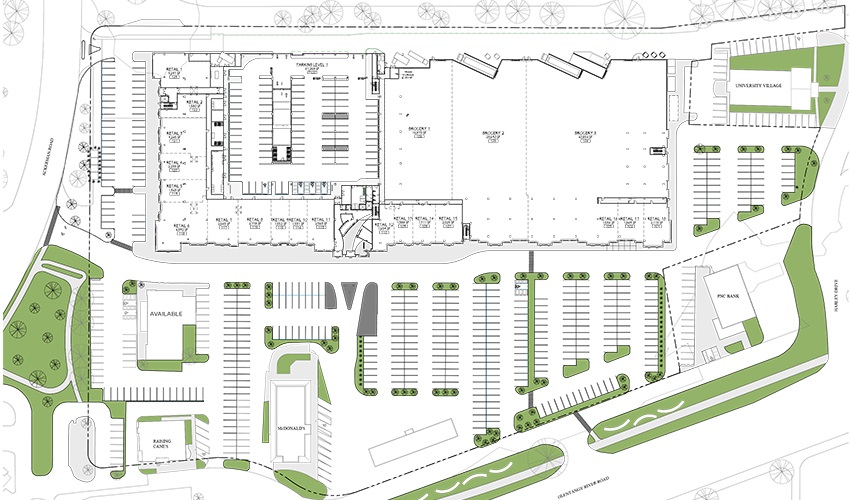
Comparing the proposed layout to the current one is a little confusing, because they look extremely similar. It seems that the 6-story project will only replace the current strip center, but most of the parking and all of the out lots will remain intact. It’s a Frankenstein’s monster of suburban and urban elements that just looks really weird. There is no interaction with any of the nearby roads, and not even a resident pathway from the main building to the multi-use path that was built a few years ago along Olentangy. It’s all still catering to cars.
In the most recent rendering of the main building, seen below, there appears to be only 1 patio space for what is clearly a very large project. The view for customers from there, of course, is still just the parking lot, with its noise, pollution and lack of any shade. In fact that’s basically the view out of every window in the building- parking lots.

I suppose that some surface lots and outbuildings could eventually be redeveloped at some point, but as it stands now, there’s a lot to be desired. The main building is decent, but the overall layout and connections are terrible and it makes the whole project just look like a much larger version of the strip mall that’s already there. Maybe that’s a harsh assessment, but I don’t think it’s an unfair one. Casto, the developer, basically invented the strip mall, so they’re clearly playing to their strengths here. They’ve done some really good projects at times, like the renovation of the Julian building on South Front Street in Downtown, and I applaud the effort to go more urban in this location, but I think so much could’ve been done better in this case. No doubt that this development will have no trouble finding tenants to rent the apartments, just due to the lack of housing anywhere in the core, but I question just what this development offers that better ones don’t.

In the end, it is a good example of how Columbus needs more true urban developers that are comfortable and willing to push the envelope on this style of development. Trying to have it both ways, where suburbia reigns in an urban location, gets us nowhere.


Young Adults Prefer Density in Franklin County


I’ve seen several articles across the internet lately questioning the idea that Millennials and young adults prefer density and urban areas. I decided to see how this played out in Franklin County overall. I first looked at the total population aged 20-34 in the year 2000 and the year 2015 by Census Tract.
Here were the maps for those years.
young adults prefer density

After looking at the numbers for both years, I came up with this map for how that age group had changed in the 2000-2015 period.

Unfortunately, some tracts, particularly in the eastern suburban areas, did not exist in 2000, and so I was not able to figure out the change for them during the period. The rest of the map, however, shows that the strongest growth in this age group was not only inside 270, but closest to Downtown and central corridors along Broad and High Streets.
These maps don’t tell us about the relationship between those changes and the population density of the census tracts. So I went further and broke the tracts into increments of density to see where the strongest growth was occurring.

With a few exceptions, there appears to be a correlation between average 20-34 aged population growth and the density of the census tracts it occurs in. This suggests that this age group, at least in Franklin County, prefers areas with moderate to high density, which typically translates to urban living.

2015 Census Tract Population Density


2015 census tract population density

The US Census recently released 2015 census tract population density data, including census tract population density. I figured midway through the decade would be a good point to update where these stand because they give greater insight in smaller-scale population changes. I looked at all the census tracts in Franklin County and came up with the following map series.

First, the population in 2015.

Next, the population density of tracts in 2010, as reference.

And now 2015.

On the surface, it’s difficult to see the changes, but put side by side, you can tell there have been a lot of increases across the county. To make this more visible, I made the following maps.

You can see that some of the strongest density increases occurred around Downtown and the Short North, New Albany, parts of the Campus area, and Dublin.

The map above gives a straightforward look at where the density increased and decreased. As you can see, the increases FAR outweighed the decreases. Most of the latter were scattered except across the Far South Side and parts of the Whitehall area.

Here were the top 20 most dense census tracts in 2015.
1. 1810: 29,508.2 South Campus/Victorian Village
2. 1121: 25,287.9 Main Campus
3. 13: 21,961.4 Campus/Indianola Terrace
4. 1110: 18168.6 North Campus/Tuttle Park
5. 10: 17386.3 Campus/SoHud
6. 12: 16,981.9 Campus/Iuka Ravine
7. 20: 13,030.5 Short North/Victorian Village
8. 17: 12,872.3 Weinland Park
9. 6: 12,153.6 Old North Columbus
10. 21: 10,853.5 Short North/High Street
11. 8163: 10,255.3 Lincoln Village/Southwest Columbus
12: 4810: 9,557.4 South Central Hilltop
13. 47: 9,492.7 North Central Hilltop
14. 6352: 9,434.0 Northwest Columbus/Henderson Road
15. 57: 9,257.4 Brewery District/South German Village
16. 5: 9,177.9 Old North Columbus
17. 6933: 9,090.9 Forest Park East
18. 16: 8,980.5 Weinland Park
19. 4620: 8,928.6 North Central Hilltop
20. 1820: 8743.3 Victorian Village

It’s obvious that the High Street corridor is the most dense of the city, racking up most of the top 20.

Now here are the 20 tracts with the largest density increases 2010-2015.
1. 1121: 4,375.9
2. 6: 2,178.5
3. 21: 1,934.9
4. 22: 1,478.1
5. 40: 1,107.7 South Downtown
6. 1820: 1,044.1
7. 20: 921.7
8. 38: 904.3 Old Towne East
9. 5: 861.2
10. 210: 833.9 Clintonville
11. 32: 751.1 Arena District West/West Victorian Village
12. 730: 736.9
13. 7551: 656.0 Somerset/South Easton
14. 7951: 610.4 West Columbus
15. 6372: 574.6 Hayden Falls/Sawmill Road
16. 7209: 514 New Albany
17. 7395: 497.6 Blacklick/East Broad
18. 10: 492.8
19. 8230: 449.3 Westland
20. 710: 447.3 West-Central Linden

And finally, the top 20 largest declines 2010-2015.
1. 13: -2,964.3
2. 12: -1,625.1
3. 42: -1,620.8 Scioto Peninsula/East Franklinton
4. 920: -902.2 Northeast Linden
5. 17: -775.4
6. 50: -554.4 Franklinton
7. 61: -485.7 South High Street
8. 59: -441.9 Near South Side/Deshler Park
9. 4620: -380.4
10. 720: -380.2
11. 4610: -335.4
12. 820: -305.4 North Linden
13. 7721: -305.2 North Linden
14. 45: -258.1 North Hilltop
15. 60: -253.2 Vassor Village
16. 810: North Central Linden
17. 7532: -240.3 Morse Road/Easton
18. 2520: -240.1 Near East Side/King-Lincoln
19. 47: -206.6
20. 9333: -194.9 Linwood

So there you have it. The Census Tract Maps page gives demographic and population data for census tracts going back to 1930.


Columbus’ Shrinking Annexation Rate

Ever wonder how Columbus got so big in area? Its city limits stretch into parts of other counties and include about a third of Franklin County. Today, it has a reputation for annexing its way to growth, but how true is this?

Well, 50 years ago, it was more or less true. Today, not so much. Aggressive annexation began in Columbus in 1953, when Mayor Maynard “Jack” Sensenbrenner began his policy of requiring annexation into the city if communities wanted city water service. Between 1953 and 1960, the area size of the city more than doubled, and that rate continued through the 1960s and 1970s, even after Sensenbrenner was no longer mayor. After 1980, annexation rates gradually began to decline.

As the chart above shows, you can see the rapid rate of growth during the 1950s-1970s and the decline in more recent decades. Through the first 5 years of the 2010s, Columbus is on pace to add fewer than 3 square miles by 2020. Despite that fact, the city’s annual population growth since 2010 is exceeding the average annual growth of any decade during the mass annexation years. This strongly supports that the dynamic, and indeed, the story of Columbus’ growth is no longer about “fake” growth through the addition of existing land and population, but rather though the influx of new residents from outside of the city limits altogether. This is helping to gradually raise the city’s population density, which exceeded Cincinnati’s last year, as the chart below shows, along with a few other Columbus peers.