Columbus Named Top Memorial Day Weekend Destination


https://www.bizjournals.com/columbus/news/2019/05/24/cnn-names-columbus-a-top-place-to-visit-for.html

Columbus has been receiving a lot of great national press in recent years, and that continued when CNN called the city a top Memorial Day weekend destination. The recent opening of the National Veterans Memorial, the first of its kind in the country, seemed to play a prominent role in the decision.

top Memorial Day weekend destination

The National Veterans Memorial on the Scioto Peninsula, completed in 2018.

2018 City Population Estimates


2018 city population estimates

A few days ago, the Census released the latest 2018 city population estimates Here were the top 30 cities in Ohio in 2010 and 2018.

2010 Population———————————————–2018 Population
1. Columbus: 787,033—————————————1. Columbus: 892,533
2. Cleveland: 396,815—————————————2. Cleveland: 383,793
3. Cincinnati: 296,943————————————–3. Cincinnati: 302,605
4. Toledo: 287,208——————————————4. Toledo: 274,975
5. Akron: 199,110——————————————–5. Akron: 198,006
6. Dayton: 141,527——————————————6. Dayton: 140,640
7. Parma: 81,601——————————————–7. Parma: 78,751
8. Canton: 73,007——————————————-8. Canton: 70,458
9. Youngstown: 66,982————————————9. Youngstown: 64,958
10. Lorain: 64,097——————————————10. Lorain: 64,028
11. Hamilton: 62,477—————————————11. Hamilton: 62,174
12. Springfield: 60,608————————————12. Springfield: 59,282
13. Kettering: 56,163————————————–13. Kettering: 55,103
14. Elyria: 54,533——————————————14. Elyria: 53,881
15. Lakewood: 52,131————————————–15. Lakewood: 50,100
16. Cuyahoga Falls: 49,652——————————-16. Newark: 50,029
17. Euclid: 48,920—————————————–17. Cuyahoga Falls: 49,272
18. Middletown: 48,694———————————-18. Middletown: 48,861
19. Mansfield: 47,821————————————–19. Dublin: 48,647
20. Newark: 47,573—————————————-20. Beavercreek: 47,391
21. Mentor: 47,159—————————————–21. Mentor: 47,273
22. Cleveland Heights: 46,121—————————-22. Euclid: 46,946
23. Beavercreek: 45,193———————————-23. Mansfield: 46,560
24. Strongsville: 44,750———————————–24. Strongsville: 44,853
25. Fairfield: 42,510——————————25. Cleveland Heights: 44,373
26. Dublin: 41,751——————————————26. Fairfield: 42,613
27. Warren: 41,557—————————————-27. Grove City: 41,625
28. Findlay 41,202—————————————-28. Findlay: 41,324
29. Lancaster: 38,780———————————–29. Lancaster: 40,414
30. Lima: 38,771——————————————30. Westerville: 40,387

And here were the top 25 cities with the highest numeric growth 2010-2018.
1. Columbus: +105,500
2. Hilliard: +7,979
3. Dublin: +6,896
4. Grove City: +6,050
5. Cincinnati: +5,662
6. Delaware: +5,177
7. North Ridgeville: +4,424
8. Westerville: +4,267
9. New Albany: +3,165
10. Pickerington: +2,910
11. Mason: +2,874
12. Newark: +2,456
13. Reynoldsburg: +2,385
14. Gahanna: +2,303
15. Wadsworth: +2,214
16. Beavercreek: +2,198
17. Marysville: +2,173
18. Avon: +2,070
19. Powell: +1,809
20. Grandview Heights: +1,785
21. Upper Arlington: +1,751
22. Harrison: +1,711
23. Lancaster: +1,634
24. Oxford: +1,514
25. Sunbury: +1,485

Columbus’ growth is very impressive in Ohio, but it has also been a top 15 fastest-growing city in the country for the past few years now, and there appears to be little standing in the way of that continuing.


Winter 2018-2019 Review


Winter 2018-2019 Review Columbus, Ohio

The Winter 2018-2019 Review reveals the season was another one of extremes, with record highs and near record lows, snowy months and snowless months. The only real consistency was how wet it was.

Temperature and snowfall ranking data goes back to the winter of 1878-1879. Snow depth ranking data goes back to 1940. Rankings are accurate through the 2018-2019 winter.

December-February Only
Average High: 41.4 22nd Warmest
Average Low: 26.4 21st Warmest
Mean: 33.8 24th Warmest
Precipitation: 12.15″ 8th Wettest
Snowfall: 23.3″ 35th Snowiest
Average Daily Snow Depth: 0.5″
32 or Below Highs: 22 16th Fewest
32 or Below Lows: 66 14th Fewest
Measurable Precipitation Days: 43 10th Most
Measurable Snowfall Days: 22 15th Most
Deepest Snow Depth: 4″ on January 13th and 20th, February 1st and 2nd
Days with 1″+ Snow Depth: 17 14th Fewest

Entire Cold Season- October-April
Average High: 49.7 27th Warmest
Average Low: 33.3 25th Warmest
Mean: 41.5 23rd Warmest
Precipitation: 29.33″ 3rd Wettest
Snowfall: 27.4″ 44th Snowiest
Average Snow Depth: 0.2″
32 or Below Highs: 27 17th Fewest
32 or Below Lows: 106 25th Fewest
Measurable Precipitation Days: 91 14th Most
Measurable Snowfall Days: 29 16th Most
Deepest Snow Depth: 4″ on January 13th and 20th, February 1st and 2nd
Days with 1″+ Snow Depth: 20 13th Fewest

Average High By Month
October 2018: 65.7 43rd Warmest
November 2018: 45.2 8th Coldest
December 2018: 44.1 21st Warmest
January 2019: 36.6 48th Coldest
February 2019: 43.4 25th Warmest
March 2019: 47.5 36th Coldest
April 2019: 65.4 21st Warmest

Average Low By Month
October 2018: 47.2 25th Warmest
November 2018: 33.2 28th Coldest
December 2018: 30.6 15th Warmest
January 2019: 22.2 47th Warmest
February 2019: 26.3 33rd Warmest
March 2019: 28.7 27th Coldest
April 2019: 44.6 12th Warmest

Mean By Month
October 2018: 56.5 28th Warmest
November 2018: 39.2 14th Coldest
December 2018: 37.3 18th Warmest
January 2019: 29.4 51st Coldest
February 2019: 34.8 30th Warmest
March 2019: 38.1 34th Coldest
April 2019: 55.0 14th Warmest

Precipitation By Month
October 2018: 2.60″ 43rd Wettest
November 2018: 5.70″ 4th Wettest
December 2018: 3.57″ 30th Wettest
January 2019: 3.09″ 47th Wettest
February 2019: 5.49″ 6th Wettest
March 2019: 5.33″ 15th Wettest
April 2019: 3.55″ 54th Wettest

Snowfall By Month
October 2018: 0.0″
November 2018: 2.1″
December 2018: 0.4″
January 2019: 11.3″
February 2019: 11.6″
March 2019: 2.0″
April 201: 0.0″

Average Daily Snow Depth By Month
October 2018: 0.0″
November 2018: Trace
December 2018: 0.0″
January 2019: 1″
February 2019: 0.5″
March 2019: 0.1″
April 2019: 0.0″

Maximum High By Month
October: 88 on the 6th and 8th
November: 61 on the 1st
December: 66 on the 2nd
January: 62 on the 8th
February: 62 on the 7th
March: 75 on the 14th
April: 82 on the 11th

Maximum High Records
-The 62 on February 7th was a record for the date, beating the old record of 61 set in 1925.

Minimum High By Month
October: 49 on the 21st
November: 30 on the 28th
December: 28 on the 8th
January: 11 on the 31st
February: 22 on the 1st
March: 20 on the 5th
April: 43 on the 1st

Minimum High Records
-The 33 on November 14th tied the record set in 2014.
-The 20 on March 5th tied the record set in 1890.

Maximum Low By Month
October: 69 on the 2nd and 9th
November: 50 on the 5th
December: 46 on the 15th
January: 41 on the 8th
February: 43 on the 6th
March: 51 on the 14th and 29th
April: 64 on the 18th

Maximum Low Records
-The 69 on October 2nd was a record for the date, beating the old record of 68 set in 1881 and 1884.
-The 68 on October 8th tied the record for the date set in 1879.
-The 69 on October 9th tied the record for the date set in 1879.
-The 68 on October 10th was a record for the date, beating the old record of 66 set in 1879.
-The 43 on February 6th was a record for the date, beating the old record of 42 set in 1991.
-The 64 on April 18th was a record for the date, beating the old record of 63 set in 1941.

Minimum Low By Month
October: 32 on the 22nd and 25th
November: 22 on the 10th and 11th
December: 16 on the 10th
January: -4 on the 30th and 31st
February: 9 on the 2nd
March: 7 on the 5th
April: 24 on the 1st

Highest Daily Precipitation By Month
October: 0.63″ on the 31st
November: 1.80″ on the 1st
December: 1.01″ on the 31st
January: 0.81″ on the 19th
February: 1.22″ on the 20th
March: 1.97″ on the 30th
April: 0.77″ on the 19th

Precipitation Records
-The 1.80″ on November 2nd was a record for the date, beating the old record of 1.45″ set in 1984.
-The 1.01″ on December 31st was a record for the date, beating the old record of 0.89″ set in 1887.
-The 0.91″ on February 12th was a record for the date, beating the old record of 0.77″ in 1930.
-The 1.97″ on March 30th was a record for the date, beating the old record of 1.47″ set in 1987.

Highest Daily Snowfall By Month
October: 0.0″
November: 1.3″ on the 15th
December: 0.2″ on the 5th
January: 4″ on the 12th
February: 4.2″ on the 1st
March: 1.9″ on the 3rd
April: 0.0″

Deepest Snow Depth By Month
October: 0″
November: 1″
December: 0″
January: 4″ on the 13th and 20th
February: 4″ on the 1st and 2nd
March: 2″ on the 1st
April: 0″

Overall, the winter of 2018-2019, while having a few cold spells, was largely warmer than normal. It was also wet and had snowfall near normal.

For more winter season records and local weather information, visit Winter Season Records or
Wilmington National Weather Service.


The Biggest Snowstorms of All Time


The biggest snowstorms of all time Columbus, Ohio

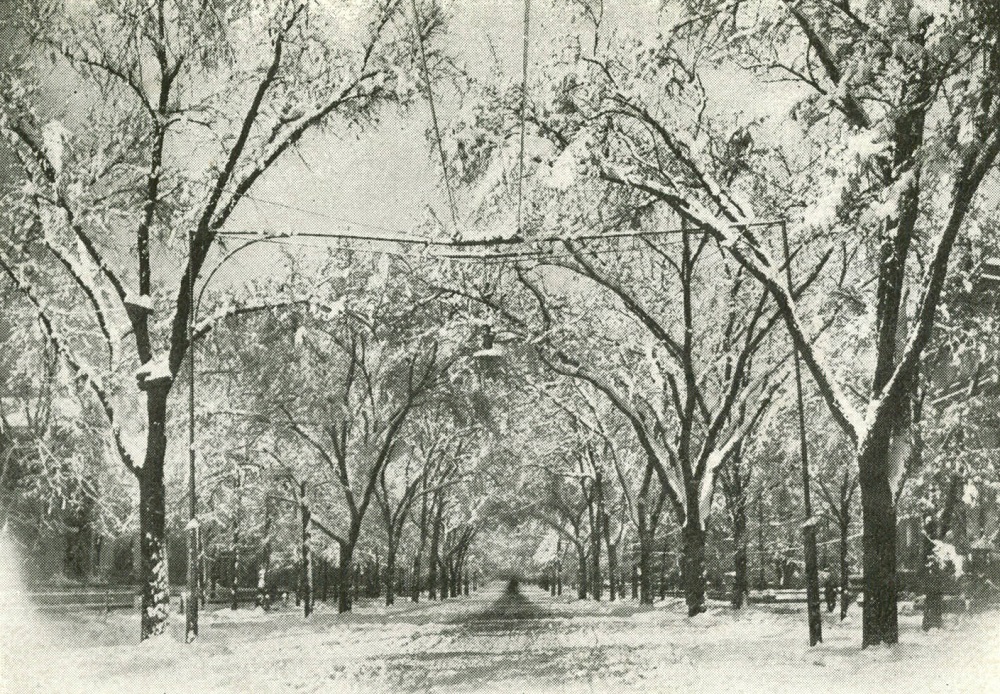
East Broad Street after a snowstorm in March, 1906.

In light of yesterday’s strange storm that challenged local forecasters, I thought it might be time to look at the biggest snowstorms of all time in Columbus, or at least since records began in 1878. I looked up the total snowfall over different periods of time.

Top 20 Largest Single Snowstorms of Any Duration
1. 3/7-3/8/2008: 20.5″
2. 2/14-2/17/2003: 15.5″
3. 2/16-2/19/1910: 15.3″
4. 11/23-11/29/1950: 15.2″
5. 1/6-1/7/1910: 12.7″
6. 4/3-4/5/1987: 12.6″
7. 1/7-1/9/1884, 2/11-2/12/1910: 10.6″
8. 2/15-2/16/2010, 2/4-2/5/2014: 10.4″
9. 3/19-3/20/1906, 1/13-1/14/1917: 10.0″
10. 2/7-2/8/1971, 1/16-1/17/1978, 2/5-2/6/2010: 9.9″
11. 1/6-1/7/1996: 9.8″
12. 1/13-1/15/1968, 2/27-2/28/1984: 9.5″
13. 2/13-2/14/1914: 9.3″
14. 3/5-3/6/1962: 9.2″
15. 12/19-12/20/1960: 8.8″
16. 1/14-1/15/1918: 8.5″
17. 2/25-2/26/1934: 8.4″
18. 1/31-2/1/1881, 2/25-2/26/2014: 8.3″
19. 3/11-3/12/1906: 8.2″
20. 12/3-12/4/1957: 8.1″

Top 12 Largest 1-Day Snowfalls
1. 3/8/2008: 15.5″
2. 4/4/1987: 12.3″
3. 1/6/1910: 11.9″
4. 2/15/2010: 9.7″
5. 3/19/1906: 9.6″
6. 2/5/2010: 9.0″
7. 2/8/1971, 2/16/2003: 8.9″
8. 1/7/1996: 8.8″
9. 3/5/1962: 8.6″
10. 1/8/1884: 8.5″
11. 2/16/1910: 8.2″
12. 12/3/1957: 7.9″

Top 12 Largest 2-Day Snowfalls
1. 3/7-3/8/2008: 20.5″
2. 3/8-3/9/2008: 15.5″
3. 2/16-2/17/1910: 15.0″
4. 1/6-1/7/1910: 12.7″
5. 4/4-4/5/1987: 12.5″
6. 4/3-4/4/1987: 12.4″
7. 2/15-2/16/2003: 12.0″
8. 1/5-1/6/1910: 11.9″
9. 2/16-2/17/2003: 10.8″
10. 2/11-2/12/1910, 2/4-2/5/2014: 10.6″
11. 2/15-2/16/2010: 10.4″
12. 1/8-1/9/1884: 10.2″

Top 12 Largest 3-Day Snowfalls
1. 3/6-3/8/2008, 3/7-3/9/2008: 20.5″
2. 3/8-3/10/2008: 15.5″
3. 2/16-2/18/1910: 15.3″
4. 2/15-2/17/1910: 15.0″
5. 2/15-2/17/2003: 13.9″
6. 2/14-2/16/2003: 13.6″
7. 1/5-1/7/1910, 1/6-1/8/1910: 12.7″
8. 4/3-4/5/1987: 12.6″
9. 4/4-4/6/1987: 12.5″
10. 4/2-4/4/1987: 12.4″
11. 1/4-1/6/1910, 1/7-1/9/1996: 11.9″
12. 11/25-11/27/1950: 11.5″

Players struggle during the infamous Ohio State-Michigan Snow Bowl game on November 27, 1950.


Top 12 5-Day Snowfalls
1. 3/4-3/8/2008, 3/5-3/9/2008: 21.2″
2. 3/6-3/10/2008, 3/7-3/11/2008: 20.5″
3. 1/16-1/20/1978: 17.6″
4. 3/31-4/4/1987: 16.4″
5. 2/15-2/19/2003: 15.9″
6. 4/2-4/6/1886: 15.7″
7. 2/13-2/17/2003, 2/14-2/18/2003, 3/8-3/12/2008: 15.5″
8. 2/14-2/18/1910, 2/15-2/19/1910, 2/16-2/20/1910: 15.3″
9. 2/13-2/17/1910: 15.0″
10. 4/3-4/7/1886, 2/12-2/16/1910, 2/5-2/9/2010: 14.3″
11. 1/17-1/21/1978: 14.2″
12. 2/12-2/16/2003: 14.0″

Top 12 Largest 7-Day Snowfalls
1. 2/11-2/17/1910: 25.6″
2. 2/12-2/18/1910: 21.4″
3. 3/2-3/8/2008, 3/3-3/9/2008, 3/4-3/10/2008, 3/5-3/11/2008: 21.2″
4. 3/6-3/12/2008, 3/7-3/13/2008: 20.5″
5. 1/14-1/20/1978: 19.0″
6. 2/10-2/16/1910: 18.8″
7. 3/30-4/5/1987: 18.3″
8. 3/29-4/4/1987: 18.1
9. 1/15-1/21/1978, 1/16-1/22/1978: 17.8″
10. 2/13-2/19/2003, 2/14-2/20/2003: 17.5″
11. 2/10-2/16/2003: 17.0″
12. 4/1-4/7/1886, 4/2-4/8/1886: 16.9″

Top 12 10-Day Snowfalls
1. 2/9-2/18/1910: 28.4″
2. 2/8-2/17/1910: 28.1″
3. 2/10-2/19/1910, 2/11-2/20/1910: 25.9″
4. 3/11-3/20/1906: 23.5″
5. 3/10-3/19/1906: 23.1″
6. 2/28-3/8/2008, 2/29-3/9/2008: 21.7″
7. 2/12-2/21/1910: 21.4″
8. 2/7-2/16/1910: 21.3″
9. 3/1-3/10/2008, 3/2-3/11/2008, 3/3-3/12/2008, 3/4-3/13/2008, 3/5-3/14/2008: 21.2″
10. 2/10-2/19/2003: 20.9″
11. 1/12-1/21/1978, 1/2-1/11/1996: 20.8″
12. 1/11-1/20/1978: 20.6″

Top 12 Largest 15-Day Snowfalls
1. 2/8-2/22/1910, 2/9-2/23/1910: 28.8″
2. 2/3-2/17/1910: 28.5″
3. 2/4-2/18/1910, 2/5-2/19/1910, 2/6-2/20/1910, 2/7-2/21/1910: 28.4″
4. 2/10-2/24/1910, 2/11-2/25/1910: 26.3″
5. 2/2-2/16/2010: 25.8″
6. 1/7-1/21/1978, 1/8-1/22/1978: 25.7″
7. 1/6-1/20/1978, 2/3-2/17/2010, 2/4-2/18/2010, 2/5-2/19/2010: 25.5″
8. 1/12-1/26/1978: 25.2″
9. 2/1-2/15/2010: 25.1″
10. 3/10-3/24/1906, 3/11-3/25/1906, 1/13-1/27/1978: 24.8″
11. 1/14-1/28/1978, 2/10-2/24/2003: 24.5″
12. 3/6-3/20/1906, 3/7-3/21/1906: 23.8″

Top 12 Largest 30-Day Snowfalls
1. 1/20-2/18/1910, 1/21-2/19/1910: 37.9″
2. 1/19-2/17/1910: 37.6″
3. 1/22-2/20/1910: 35.3″
4. 1/2-1/31/1978, 1/3-2/1/1978, 1/4-2/2/1978, 1/5-2/3/1978: 34.0″
5. 1/8-2/6/1978: 33.8″
6. 1/1-1/30/1978, 1/7-2/5/1978: 33.6″
7. 12/30/1977-1/28/1978, 12/31/1977-1/29/1978: 33.4″
8. 12/29/1977-1/27/1978: 32.8″
9. 12/28/1977-1/26/1978: 32.5″
10. 1/6-2/4/1978: 32.0″
11. 2/8-3/8/2008: 31.8″
12. 1/24-2/22/1910, 1/25-2/23/1910, 1/26-2/24/1910, 1/27-2/25/1910, 1/28-2/26/1910, 1/29-2/27/1910, 1/30-2/28/1910, 1/26-2/24/2003: 30.7″

Certain years show up on all the lists, including 1906, 1910, 1978, 2003, 2008 and 2010. These winters all had periods of extreme snowfall and are considered “historic”.
Check out more winter and other local weather data with the following links.
Winter Storms
Winter Season Records
Annual Weather Records
Wilmington National Weather Service


Columbus’ Foreign-Born Population Origins


foreign-born population origins

Columbus’s foreign-born population origins are much more varied, and the overall population larger, than what one might expect. As of 2017, they made up 12% of the city’s population, the highest in more than 100 years. I’ve looked at such numbers before, but I wanted to update for the most recent available numbers.

Top 25 Origin Nations for the Existing Foreign-Born Population
2010—————————————2017
1. Mexico: 13620———————1. Mexico: 12214
2. India: 7790————————–2. India: 10095
3. Somalia: 6799———————3. Somalia: 8143
4. China: 3881————————-4. China: 6475
5. Ghana: 2381————————5. Ghana: 5229
6. Korea: 2246————————-6. Ethiopia: 2428
7. El Salvador: 1542—————–7. Kenya: 2131
8. Japan: 1518————————8. El Salvador: 2057
9. Vietnam: 1496———————-9. Vietnam: 1992
10. Ethiopia: 1457——————-10. Nepal: 1914
11. Kenya: 1391———————-11. Korea: 1564
12. Sierra Leone: 1222————-12. Iraq: 1407
13. Haiti: 1091————————13. Sierra Leone: 1399
14. Canada: 1086——————–14. Dominican Republic: 1292
15. Philippines: 1054—————-15. Japan: 1292
16. Germany: 1017——————-16. Cambodia: 1165
17. United Kingdom: 970———–17. Russia: 1142
18. Cambodia: 962——————-18. Philippines: 1135
19. Taiwan: 940———————–19. Morocco: 1134
20. Liberia: 852———————–20. Nigeria: 1029
21. Guatemala: 832——————21. Cameroon: 1018
22. Dominican Republic: 804——22. Taiwan: 982
23. Russia: 800———————–23. United Kingdom: 951
24. Ukraine: 716———————-24. Ukraine: 868
25. Nigeria: 701———————–25. Pakistan: 861

Since 2010, there has been somewhat of a shift away from Europe and Latin America, and more and more into Asia and Africa.

Here were the 10 biggest gainers and losers 2010-2017
Gainers————————————-Losers
1. Ghana: 2848———————-1. Mexico: -1406
2. China: 2594———————–2. Korea: -682
3. India: 2105————————3. Haiti: -647
4. Nepal: 1766———————–4. Germany: -280
5. Somalia: 1344——————–5. Liberia: -268
6. Iraq: 1108————————–6. Belarus: -228
7. Ethiopia: 971———————-7. Canada: -247
8. Morocco: 873———————8. Japan: -226
9. Cameroon: 819——————9. Bosnia/Herzegovina: -215
10. Kenya: 740———————-10. Guatemala: -210

Keep in mind that these are just estimates and can therefore have wide margins of error.

Both the Demographics and Population pages and the US Census offer additional data to explore.