In the last few decades, the Columbus Bhutanese community has grown into one of the largest in the world outside of Bhutan, itself. Many of these immigrants were resettled in other parts of Canada and the US, but an increasing number of them have made their way to Columbus and Central Ohio. According to the Bhutanese Community of Central Ohio, the area’s Bhutanese population now numbers upwards of 27,000, and projected to surpass 30,000 over the next few years.
This community has already made a local impact, opening new restaurants, shops and cultural and religious centers across the city and region.
In Franklin County, the immigrant- or foreign-born- population has been growing rapidly for the last few decades. Latin American immigration was dominant for many years, but has recently taken secondary position to even faster Asian growth. But where does the immigrant population live, exactly? Where they end up in the county is perhaps not where common belief would always suggest. The interactive map below breaks down not only the main continent of origin for immigrants by census tract, but also gives the top 5 specific origin nations. While at first glance, the continents seem heavily grouped together, a deeper look at nations of origin indicate that immigrant populations are much more diverse and spread out much more evenly than it appears.
Columbus has been growing steadily its entire existance. The past 10 years have seen its fastest growth ever, however. The city is attracting new residents not just from other parts of Ohio, but from across the United States and world. 50% of its overall growth is made up by either domestic migration or immigration from other nations.
There is now a steady stream of prospective residents in search for answers about the city and metro area. Hopefully, this post provides some of those desired answers.
Let’s look at some of the most common questions and attempt to provide the necessary information.
1. What are the most desirable places to live in Columbus? The answer to this question depends on what someone is searching for. For this question, we’ll base the answer on 5 categories- affordability, walkability, safety, schools and access to amenities. Based on these topics, here are the most-recommended urban neighborhoods.
Click on any neighborhood to find out more information.
1. The Short North, including Italian Village and Victorian Village Arguably the heart of Columbus’ urban core, the Short North is one of the most complete Midwest urban neighborhoods outside Chicago. While it has tons of amenities and walkability, a few potential negatives include the lack of parking and higher housing costs. 2. German Village and the Brewery District German Village is one of the largest historic districts in the United States. Its preserved 19th Century brick buildings and streets, walkable amenities and landscaped parks make it one of Columbus’ most uniquely beautiful neighborhoods. However, all that beauty can come with higher housing prices and very strict preservation rules. 3. Downtown and the Arena District The Downtown area, which includes the Arena District, is a rapidly growing area with tons of new housing and entertainment amenities. It is very walkable and the central hub of the city’s transit system. 4. Clintonville Located just north of the massive Ohio State Campus, Clintonville is a larger, more family-oriented neighborhood with quality housing and decent schools. 5. Merion Village, Schumacher Place, Franklinton, Weinland Park, Olde Towne East, Westgate and Old North Columbus These neighborhoods are for those who are okay with neighborhoods in transition. They are more affordable than the top 4, but also in various stages of revitalization. These neighborhoods provide some of the best long-term investment opportunities so long as you can look past some grit.
Based on the same criteria, here are the most-recommended suburbs.
1. Dublin This outer northwest suburb has a great mix of urban and suburban neighborhoods, with plenty of options for most tastes. Great schools and a one of the most diverse suburban populations make Dublin a popular choice. Negatives include a general lack of transit and higher housing costs. 2. Bexley Bexley is one of the oldest inner suburbs in the city. Its attractive older homes and beautiful tree-lined streets are right out of a John Hughes film. Great schools and walkable retail corridors make this suburb highly desirable. However, negatives include high property taxes and higher housing costs. 3. Grandview Heights Grandview is another more urban inner suburb with a great mix of quality housing stock and amenities. Schools are also very good. Negatives include a very tight housing market that make finding a home difficult, along with higher costs. 4. Upper Arlington This inner suburb is well known for its terrific schools and quality of life. It is more suburban in nature than other inner suburbs, and therefore a negative is its general lack of walkability to amenities. The cost of housing is generally higher. 5. Westerville Westerville is a northern, outer traditional suburb. Positives include a nice, walkable downtown area and much less expensive housing the other suburbs on the list.
This list of urban and suburban places is just a starter list and is not to be limiting.
2. What are the best ways to find somewhere to live? Beyond going with a realtor or doing internet searches, the best way to find somewhere to live is to visit your preferred neighborhood. Some house and apartments may not be advertised online, specifically those sales being managed by the owner. Another potential way is to visit local neighborhood social media sites to see if anyone has advertised their home or apartment. With the extremely fast-moving Columbus market, thinking outside the box can be beneficial.
4. Where can I find more information about the city and its quality of life? For many more links on Columbus activities, local government, schools and much more, check out the Columbus Links and Resources
In the ongoing series discussing topics related to the 2018 Census demographic estimates, today I will update the foreign-born comparison. Beyond the simple comparison, I will also talk about the regions and countries that the foreign-born populations come from.
Total Foreign-Born Population Rank by City 2010 and 2018 2010————————————-——-2018 1. Chicago: 557,674—————1. Chicago: 540,738 2. San Jose: 366,194————-2. San Jose: 407,839 3. Austin: 148,431—————-3. Austin: 180,544 4. Las Vegas: 130,503———–4. Las Vegas: 133,033 5. Sacramento: 96,105———-5. Columbus: 125,339 6. Columbus: 86,663————-6. Sacramento: 114,786 7. Portland: 83,026—————7. Jacksonville: 111,798 8. Jacksonville: 77,145——–8. Nashville: 95,040 9. Indianapolis: 74,707——–9. Portland: 90,728 10. Nashville: 73,327———-10. Indianapolis: 81,764 11. Minneapolis: 57,846——11. Minneapolis: 68,131 12. Milwaukee: 57,222——–12. St. Paul: 59,381 13. Providence: 52,920——-13. Milwaukee: 57,647 14. St. Paul: 50,366———–14. Omaha: 50,279 15. Virginia Beach: 40,756—15. Providence ;46,995 16. Omaha: 39,288————16. Detroit: 44,520 17. Wichita: 39,128————17. Kansas City: 43,485 18. Kansas City: 35,532——18. Virginia Beach: 43,385 19. Detroit: 34,307————19. Wichita: 42,171 20. Madison: 24,929———20. Madison: 32,622 21. St. Louis: 23,011———-21. Des Moines: 31,013 22. Lincoln: 22,214———–22. Pittsburgh: 26,569 23. Des Moines: 20,798—–23. Lincoln: 23,309 24. Pittsburgh: 18,698——24. Fort Wayne: 22,489 25. Cleveland: 17,739——-25. Cleveland: 21,838 26. Grand Rapids: 16,615—26. St. Louis: 21,538 27. Cincinnati: 16,531——-27. Cincinnati: 20,592 28. Fort Wayne: 15,286—-28. Grand Rapids: 20,032 29. Toledo: 11,159———–29. Akron: 13,649 30. Akron: 8,524————30. Toledo: 9,038 31. Dayton: 5,102———–31. Dayton: 7,311 32. Youngstown: 3,695—-32. Canton: 3,241 33. Canton: 1,343———–33: Youngstown: 976
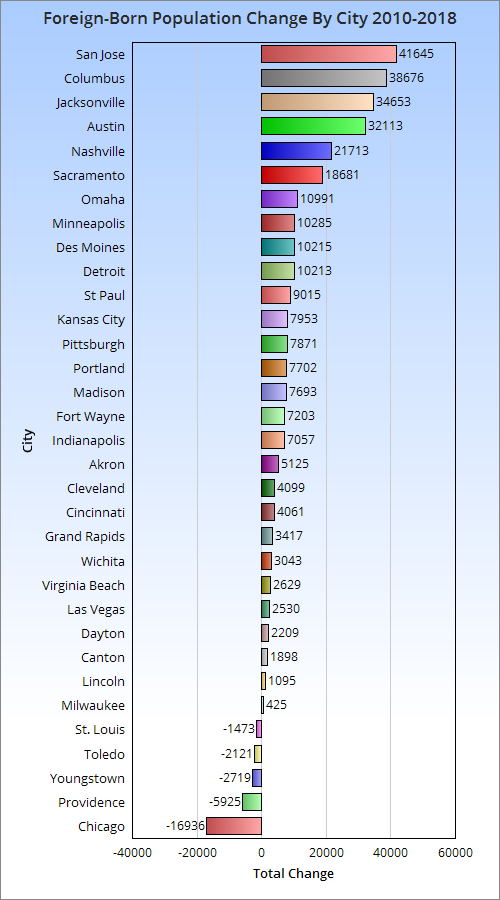
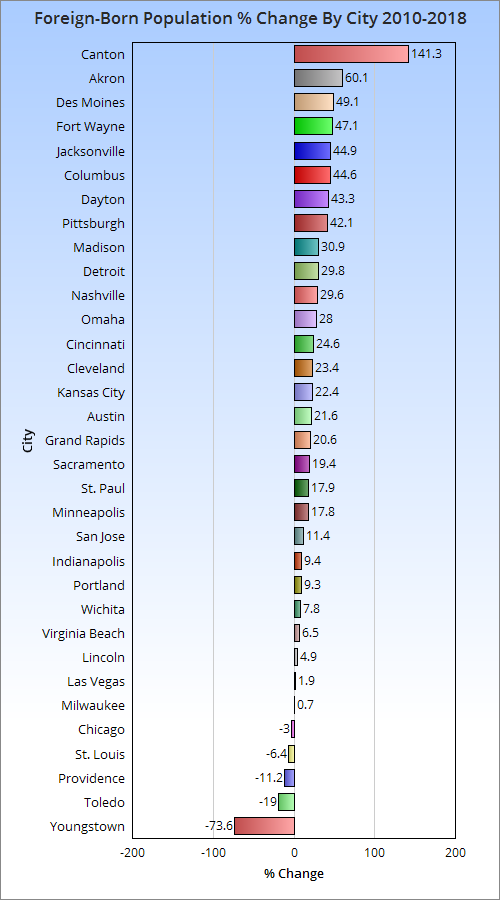
Here’s the 2010-2018 total change. And the 2010-2018 change by %.
Columbus has done very well in both total and % growth of its foreign-born population since 2010.
So now that we know how many foreign-born immigrants are arriving and how fast, let’s take a look at where they are coming from.
Total Foreign-Born Residents From Europe in 2000 and 2018 2000———————————————–2018 1. Chicago: 145,462———————1. Chicago: 91,397 2. San Jose: 21,904———————2. San Jose: 22,043 3. Portland: 17,572———————-3. Jacksonville: 18,808 4. Jacksonville: 10,883————4. Portland: 17,016 5. Las Vegas: 9,070—————-5. Austin: 11,981 6. Cleveland: 8,796—————-6. Las Vegas: 11,472 7. St. Louis: 8,543——————7. Columbus: 8,141 8. Sacramento: 8,204————-8. Nashville: 8,108 9. Milwaukee: 7,841—————9. Virginia Beach: 6,710 10. Austin: 7,474——————10. Sacramento: 6,275 11. Pittsburgh: 7,413————–11. Pittsburgh: 5,047 12. Columbus: 7,017————–12. Minneapolis: 5,031 13. Indianapolis: 6,543———–13. Omaha: 3,845 14. Virginia Beach: 6,333——–14. St. Louis: 4,711 15. Detroit: 5,600—————–15. Indianapolis: 4,199 16. Minneapolis: 5,409———–16. Omaha: 3,845 17. Providence: 5,126————-17. Milwaukee: 3,808 18. Nashville: 4,859—————18. Madison: 3,519 19. Cincinnati: 3,851————–19. Providence: 3,030 20. Grand Rapids: 3,396———20. Lincoln: 2,777 21. Omaha: 3,320—————–21. Cincinnati: 2,738 22. St. Paul: 3,255—————-22. St. Paul: 2,449 23. Des Moines: 3,216———–23. Grand Rapids: 2,336 24. Kansas City: 2,985———-24. Kansas City: 2,320 25. Madison: 2,871—————25. Fort Wayne: 2,235 26. Lincoln: 2,701—————-26. Wichita: 1,851 27. Akron: 2,687—————–27. Detroit: 1,767 28. Fort Wayne: 2076———–28. Akron: 1,580 29. Toledo: 2,020—————-29. Des Moines: 1,042 30. Wichita: 2,004————–30. Toledo: 496 31. Dayton: 901——————31. Canton: 347 32. Youngstown: 870———–32. Dayton: 347 33. Canton: 590—————–33. Youngstown: 337
Columbus had more European immigrants than most in 2000 and 2018, and was one of the relatively few cities that saw an increase by 2018.
Total Foreign-born Population from Asia 2000 and 2018 2000————————————————–2018 1. San Jose: 182,712—————————1. San Jose: 256,504 2. Chicago: 112,932—————————2. Chicago: 144,970 3. Sacramento: 40,253———————3. Austin: 59,711 4. Portland: 26,271—————————4. Sacramento: 56,084 5. Austin: 25,036——————————5. Columbus: 49,185 6. St. Paul: 23,245———————-6. Portland: 42,245 7. Columbus: 22,354——————-7. Jacksonville: 39,543 8. Jacksonville: 17,427—————–8. Las Vegas: 35,959 9. Minneapolis: 17,376—————–9. St. Paul: 34,246 10. Las Vegas: 17,062—————–10. Nashville: 28,142 11. Virginia Beach: 15,176————-11. Indianapolis: 24,992 12. Detroit: 15,114———————-12. Virginia Beach: 21,954 13. Nashville: 12,573——————-13. Milwaukee: 18,192 14. Milwaukee: 12,114——————14. Minneapolis: 17,929 15. Wichita: 10,826——————–15. Detroit: 17,474 16. Madison: 9,736——————–16. Madison: 17,021 17. Indianapolis: 9,190—————-17. Omaha: 14,582 18. Pittsburgh: 7,938—————–18. Wichita: 14,107 19. Providence: 7,871—————–19. Kansas City: 13,753 20. Kansas City: 7,312—————-20. Des Moines: 13,139 21. Lincoln: 6,691———————-21. Pittsburgh: 12,929 22. St. Louis: 6,425——————–22. Lincoln: 11,233 23. Omaha: 6,302 ———————23. Fort Wayne: 10,809 24. Cleveland: 6,213——————-24. Cleveland: 10,351 25. Des Moines: 5,239—————-25. St. Louis: 9,505 26. Cincinnati: 4,326——————26. Akron: 8,391 27. Toledo: 3,847———————-27. Providence: 7,744 28. Grand Rapids: 3,206————–28. Cincinnati: 5,599 29. Akron: 3,099———————–29. Toledo: 3,597 30. Fort Wayne: 2,792—————–30. Grand Rapids: 3,369 31. Dayton: 903————————-31. Dayton: 2,575 32. Youngstown: 338——————32. Canton: 542 33. Canton: 296————————33. Youngstown: 196
Columbus ranks even higher with its foreign-born Asian population.
Total Foreign-born Population from Africa 2000 and 2018 2000—————————————————2018 1. Minneapolis: 12,765——————–1. Columbus: 45,092 2. Chicago: 12,613————————-2. Minneapolis: 26,271 3. Columbus: 9,530———————–3. Chicago: 25,573 4. San Jose: 5,189————————-4. Nashville: 18,423 5. St. Paul: 4,697———————5. Indianapolis: 14,965 6. Nashville: 4,183——————-6. St. Paul: 13,594 7. Detroit:: 3,249———————7. Austin: 9,961 8. Providence: 3,138—————-8. Kansas City: 8,558 9. Indianapolis: 2,650—————9. San Jose: 8,546 10. Portland: 2,430—————–10. Cincinnati: 7,113 11. Austin 2,263———————11. Des Moines: 6,191 12. Kansas City: 2,192————–12. Omaha: 5,474 13. Cincinnati: 1,781—————-13. Grand Rapids: 3,932 14. Jacksonville: 1,719————-14. Portland: 3,899 15. St. Louis: 1,500—————–15. St. Louis: 3,777 16. Omaha: 1,497——————-16. Providence: 3,571 17. Milwaukee: 1,332—————17. Milwaukee: 3,552 18. Cleveland: 1,075—————-18. Jacksonville: 3,426 19. Sacramento: 1,051————-19. Lincoln: 2,942 20. Des Moines: 1,038————-20. Wichita: 2,752 21. Madison: 991——————–21. Madison: 2,599 22. Wichita: 946——————–22. Detroit: 2,081 23. Las Vegas: 916—————–23. Pittsburgh: 1,909 24. Pittsburgh: 905—————-24. Sacramento: 1,784 25. Virginia Beach: 840———–25. Virginia Beach: 1,783 26. Grand Rapids: 718————-26. Fort Wayne: 1,614 27. Toledo: 638——————–27. Dayton: 1,573 28. Lincoln: 637——————–28. Akron: 1,312 29. Dayton: 522——————–29. Las Vegas: 1,206 30. Fort Wayne: 384————–30. Cleveland: 622 31. Akron: 197———————-31. Toledo: 416 32. Canton: 89———————32. Youngstown: 277 33. Youngstown: 50—————33. Canton: 95
Columbus has claimed the number 1 spot in its foreign-born African population, passing previous top city Minneapolis.
And finally, the total foreign-born population from the Americas in 2000 and 2018 2000—————————————————-2018 1. Chicago: 357,235————————–1. Chicago: 277,742 2. San Jose: 117,989————————2. San Jose: 119,455 3. Austin: 73,935———————-3. Austin: 97,933 4. Las Vegas: 63,277——————4. Las Vegas: 83,782 5. Sacramento: 28,927—————5. Jacksonville: 49,339 6. Providence: 27,649—————-6. Sacramento: 42,722 7. Milwaukee: 24,781——————7. Nashville: 39,633 8. Detroit: 21,527———————-8. Indianapolis: 37,287 9. Portland: 20,939——————-9. Providence: 32,650 10. Minneapolis: 19,648————-10. Milwaukee: 31,917 11. Indianapolis: 17,530————–11. Omaha: 26,012 12. Nashville: 17,125——————12. Wichita: 23,429 13. Omaha: 14,467——————–13. Detroit: 23,198 14. Wichita:: 13,988——————14. Columbus: 22,469 15. Grand Rapids: 13,477————15. Portland: 20,407 16. Kansas City: 12,948————–16. Minneapolis: 18,765 17. Jacksonville: 11,881—————17. Kansas City: 18,170 18. St.Paul: 9,804———————18. Virginia Beach: 12,667 19. Columbus: 8,596—————–19. Des Moines: 10,675 20. Des Moines: 6,201—————20. Grand Rapids: 10,395 21. Virginia Beach: 5,754————21. Madison: 9,349 22. Cleveland: 5,192—————–22. St. Paul: 9,070 23. Madison: 5,080——————23. Fort Wayne: 7,831 24. Fort Wayne: 4,930————–24. Lincoln: 6,280 25. Lincoln: 3,106——————–25. Pittsburgh: 5,898 26. St. Louis: 2,961——————-26. Cleveland: 5,810 27. Toledo: 2,942———————27. Cincinnati: 4,901 28. Pittsburgh: 2,463—————-28. Toledo: 4,347 29. Cincinnati: 2,432—————–29. St. Louis: 3,545 30. Dayton: 919———————-30. Dayton: 2,816 31. Akron: 891————————31. Akron: 2,366 32. Canton: 347———————-32. Canton: 2,257 33. Youngstown: 333—————33. Youngstown: 166
Columbus does the worst with this group, but even here it moved up 5 spots in the rankings.
The rest of the foreign-born population is made up of small groups of people from Oceania- or basically island nations.
Columbus’s foreign-born population origins are much more varied, and the overall population larger, than what one might expect. As of 2017, they made up 12% of the city’s population, the highest in more than 100 years. I’ve looked at such numbers before, but I wanted to update for the most recent available numbers.