The Columbus area will soon be home to Ohio’s largest private investment in history with the Intel semiconductor fab planned for the Franklin County/Licking County line in New Albany. While this is not within Columbus itself, this project has massive implications for the city, region and possibly even Ohio overall. Let’s examine exactly what the Intel semiconductor fabs mean for Columbus, and some of the potential impacts the project may have for years to come.
What is it?
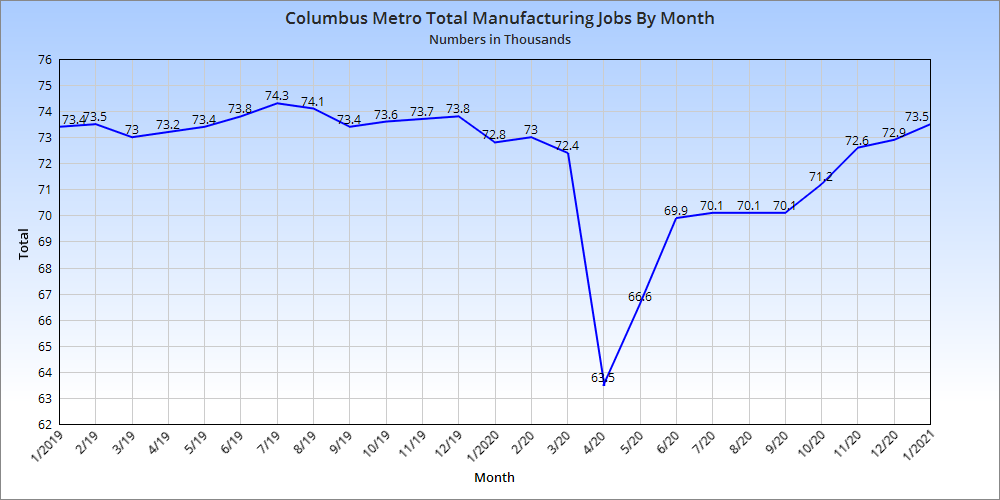
Semiconductors -at their most basic- conduct electricity, and are essentially what are used to make microchips. As such, they are crucially important for virtually all types of electronics, from cars to computers to ATMS to household appliances. Because they are so important, everyone needs them. Unfortunately, however, their production is more complex than many other types of manufacturing. Their production plants require large amounts of power and water, and manufacturing areas have to be free of things like static electricity and humidity, which can damage semiconductors. Furthermore, the jobs typically require specialized training and degrees. What all this means is that building a semiconductor factory- or fab- is enormously expensive. A single fab can easily cost $10-$20 billion, so there aren’t that many companies in the world that can actually build them- in fact, there are currently just 38 companies in the entire world capable of manufacturing them.
The proposed fab in New Albany is significant in several ways. First of all, as mentioned above, it will be Ohio’s largest single private investment in history, significantly more than any auto manufacturer or other industry. The first phase of the project has been announced, and will include two fabs at a cost of $20 billion, and will provide 3,000 direct jobs, 10,000 ancillary jobs and 7,000 construction jobs. The fab jobs will have an average salary of $135,000, about 2.5x the Ohio average. While this first phase is huge on its own, it seems that it will just be the beginning.
For some time, Intel has been talking about building a “mini-city” type development somewhere in the US. This mini tech city would include up to 8 or more fabs, and along with supporting development would be an investment greater than $100 billion. When news first broke about the New Albany project, there was some speculation that this site would be where this gigantic development would go, especially given that it included more than 3,000 acres of available land. Now, it seems that we have confirmation that Central Ohio is indeed the location of this mini city. In a recent Time article, this section stood out:
“Our expectation is that this becomes the largest silicon manufacturing location on the planet,” Intel CEO Pat Gelsinger told TIME; the company has the option to eventually expand to 2,000 acres and up to eight fabs. “We helped to establish the Silicon Valley,” he said. “Now we’re going to do the Silicon Heartland.”
So now that Central Ohio is about to rocket to the potential forefront of microchip manufacturing on a global scale, what might be the consequences long term?
Impacts
It’s hard to overstate how significant this development will be for the Columbus area. Here are just a few.
Housing Market
While the effects of this project won’t be felt by most right away, the areas and communities nearest to it will likely see home prices escalate fairly quickly. Places like Johnstown, New Albany, Alexandria and Granville, among others, will likely see the fastest- and most significant- realization of this increase, but virtually every community within 50 miles will likely see upward pressure- certainly including Columbus, which will probably end up with a healthy majority of any new workers into the region.
What that means long term is that housing construction will also explode. The region, if anything, has been underbuilding for years despite high demand. Even before this news, it was estimated that Central Ohio needed roughly 2x-4x the residential units constructed each year just to meet existing demand. Because of that existing issue, the area has faced a deep housing shortage and a near monthly new median housing price record.
So housing construction will almost inevitably increase, but the makeup of that housing and where it will be built remains to be seen. No doubt suburban sprawl around the construction area will accelerate, but what happens in Columbus itself is likely to be somewhat different. The city could see a massive upward movement in urban infill projects that make the past decade look paltry in comparison.
You might be wondering why all this development would even occur just because of this one project, no matter how large it is, and that brings us to the next impact.
Population
A project as large as the Intel mini-city doesn’t happen everyday, and arguably nowhere else in the country is going to have something like it in the industry. Because of the scale and notoriety alone, it is inevitable that other companies- and not just tech- take notice and give the Columbus are a new look for investment or relocation. Columbus, and indeed Ohio, doesn’t have the high costs associated with the West Coast or even parts of the Sun Belt. Ohio doesn’t struggle with water supplies like the Southwest, has stable power, does not suffer from significant natural disaster threats, is positioned well for climate change and is arguably the best-located state for access to a majority of the US population. Seeing Intel make such a large investment in the state will attract other investments as well, and these new companies investing will need supporting infrastructure and companies of their own, as well.
In fact, this process has already begun. Intel itself has said that multiple other companies, such as Air Products, Applied Materials, LAM Research and Ultra Clean Technology, among others, are already moving to invest in the area. Many more will follow.
Over time, this will lead to a greater influx of people, spurring more and more development.
Obviously, this is not going to happen overnight. Intel’s first fab isn’t even due to be completed for potentially another 3-4 years, but the stars are aligning for the Columbus population to really begin taking off and enter a true golden age.
Infrastructure
Up to now, the Columbus region’s infrastructure has been more or less sufficient in handling the needs of the population, with some exceptions. The highway system has been more than adequate to ensure that most trips around the area are relatively quick and easy, but should a rapidly-rising population manifest, that highway and road system may quickly fall behind. Even with current growth levels, traffic is becoming more of an issue. It’s been rumored that the State is going to invest up to a billion dollars improving infrastructure in the area surrounding the site, but this most likely is limited to roadway expansion, if anything.
One big negative for the region has always been mass transit. Columbus remains one of the few large US cities without rail service of any kind. It’s certainly possible, if not likely, that MORPC and other local planning groups are going to be faced with increasing pressure to invest in driving alternatives. COTA can only go so far. The plan to build BRT routes in some areas of the city is a start, but rail needs to be part of the longer-term picture. At the very least, a few lines between Downtown and the airport, and perhaps the airport and New Albany is something that needs to seriously be considered. The Columbus region can no longer afford to keep putting these investments off. Planning needs to start now, not later.
John Glenn International Airport is another potential weakness. While it is fine as a regional airport, all this news should put greater emphasis on the plan to replace the current terminal with a new one. Originally, city planners were talking about 2030 or later for this to happen. Due to the pandemic and a drop in overall air traffic, those plans were likely moved back even later, but if anything, the plans should go forward even sooner. This will allow the city to gain more flights- perhaps even some truly international ones- that are going to be increasingly in-demand.
The reality is that these are just a handful of the potential long-term impacts for the city and region, but they are the ones most obviously likely to be impacted the greatest. In effect, Intel’s mini-city is not just a single economic boost for Central Ohio, but it could also be the first wave in a tsunami of transformation that will change Columbus- good or bad- forever.