The 2022 final housing market update looks at the overall market performance for the year versus 2021.
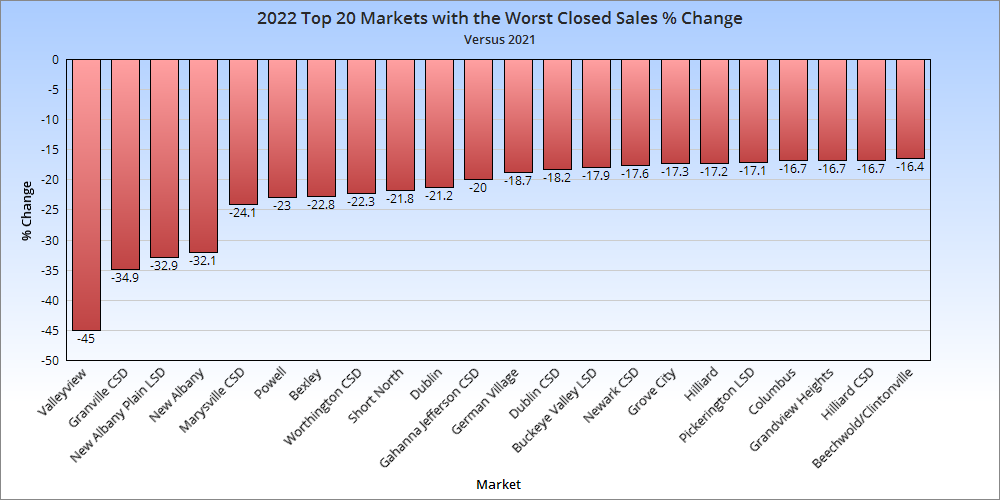
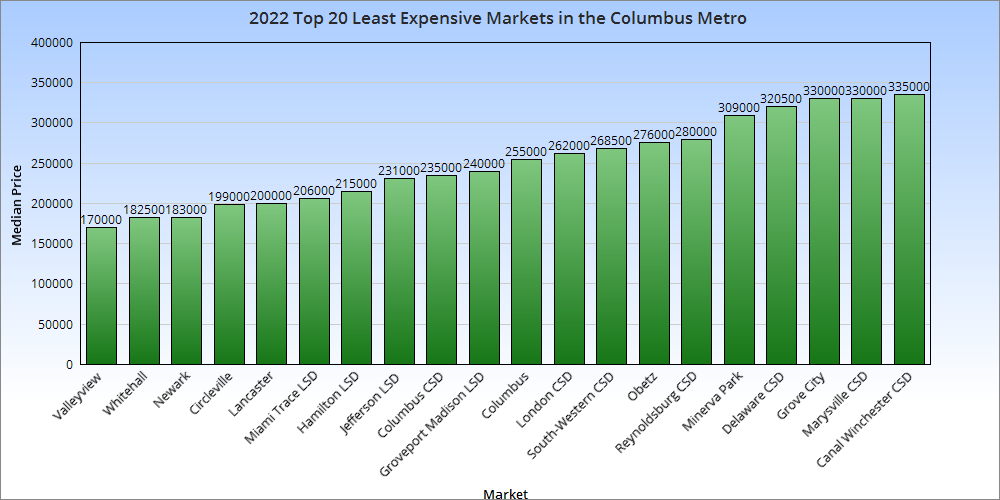
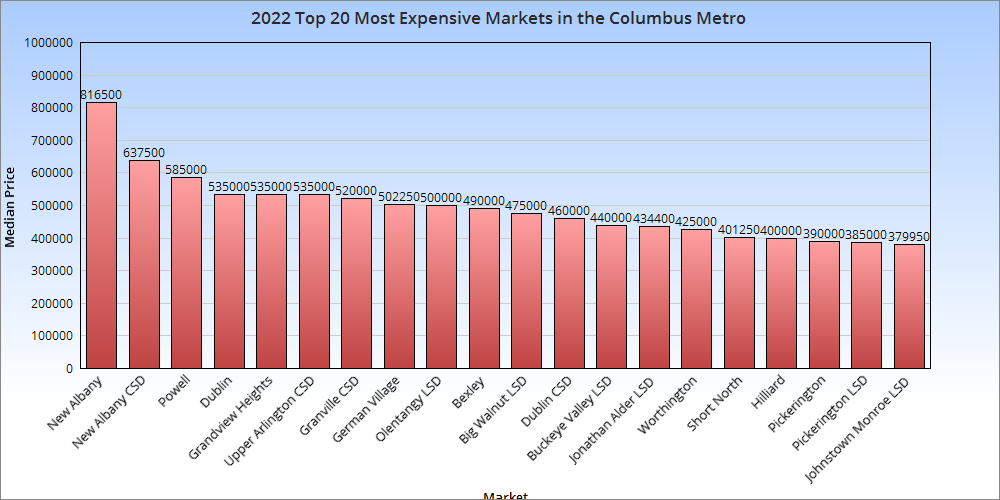
Note: LSD= Local School District, CSD= City School District. In both cases, school district boundaries differ from city boundaries.
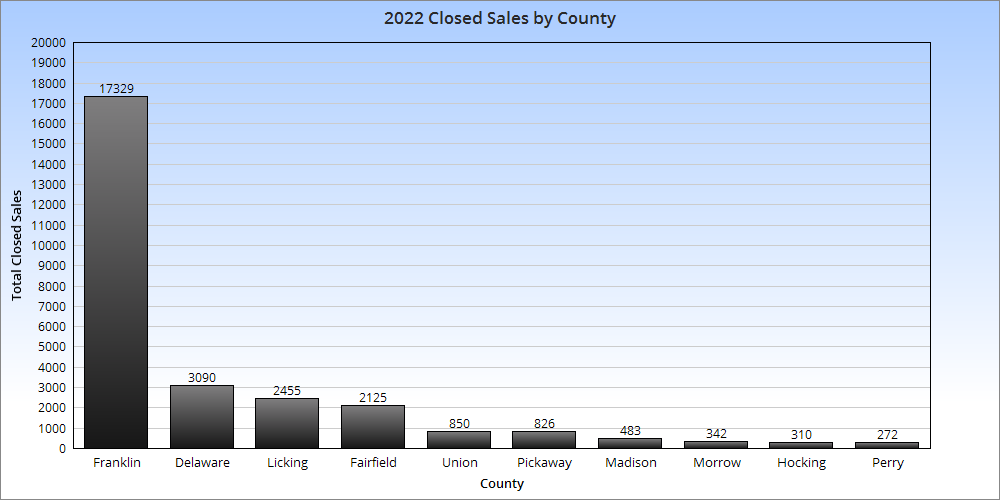
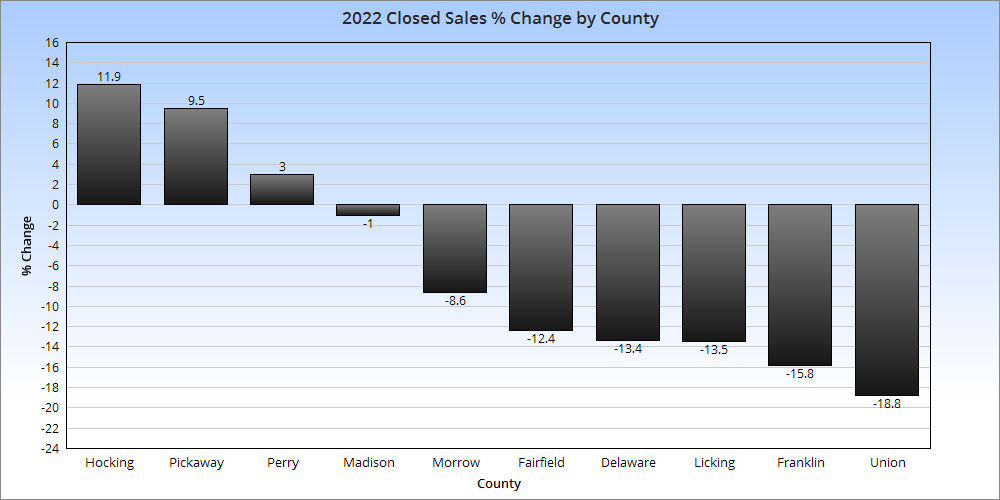
Closed sales are those sales that were completed during the year. 7 of the 10 metro counties saw declines vs. 2021.
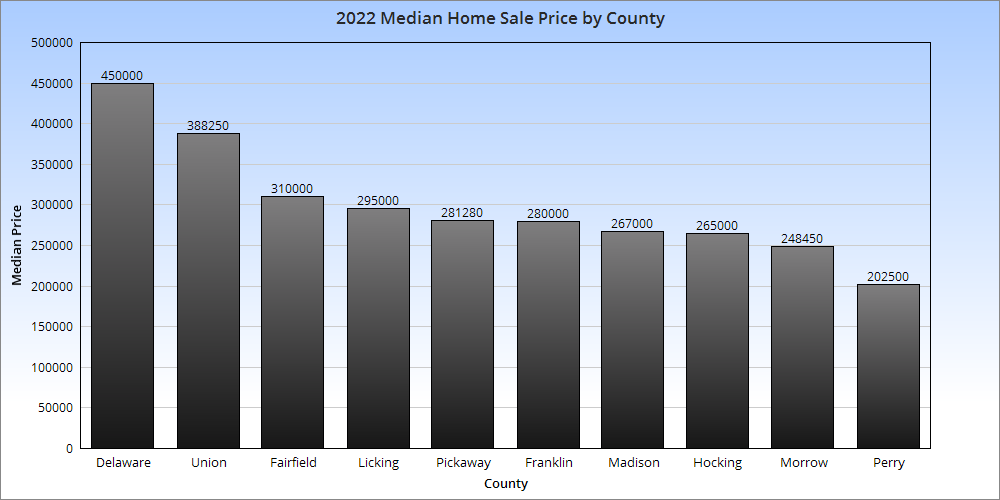
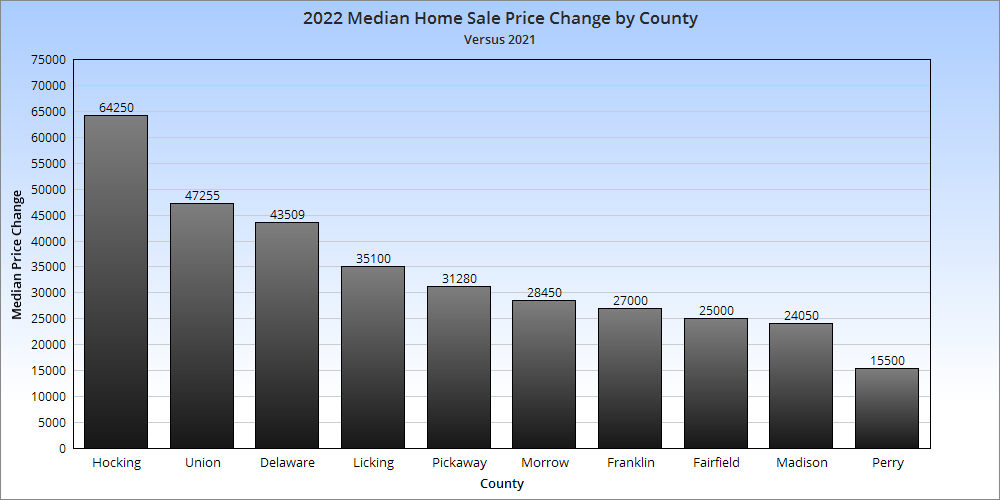
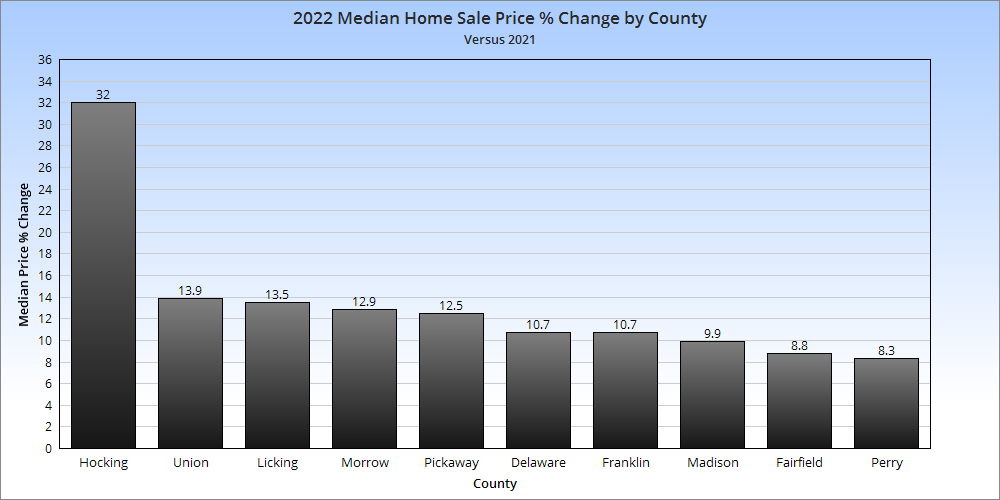
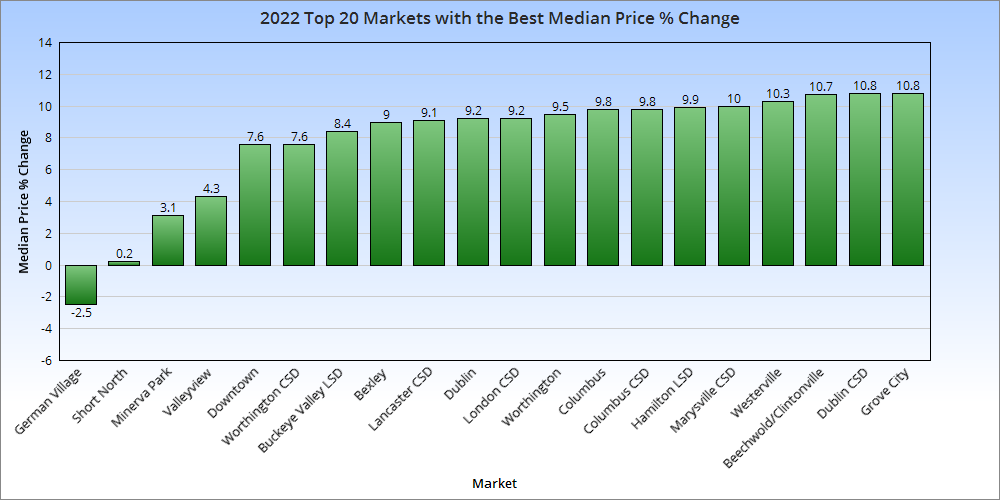
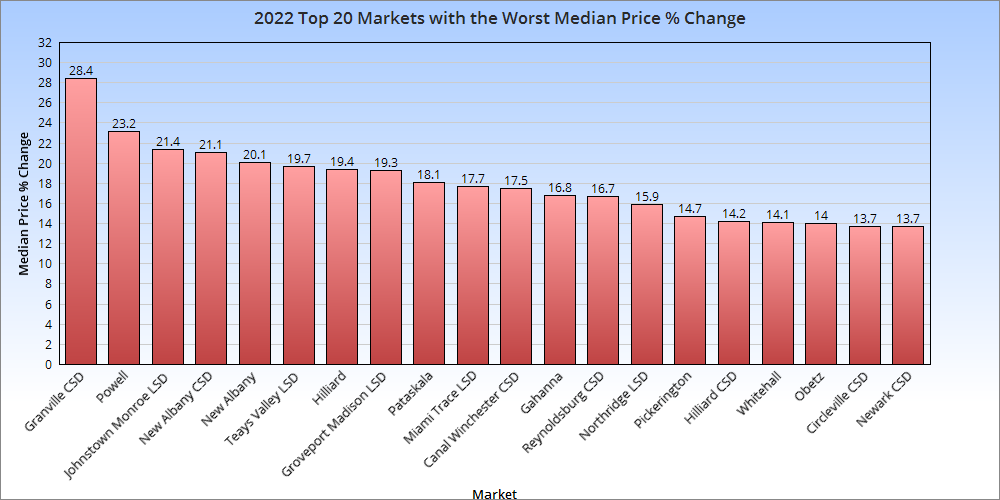
Overall Market Median Sales Price in 2022: $298,748 Based on the 10 Columbus Metro Area counties, the median price increased by $34,139 over 2021. Overall Market Median Sales Price % Change in 2022 versus 2021: +12.9%
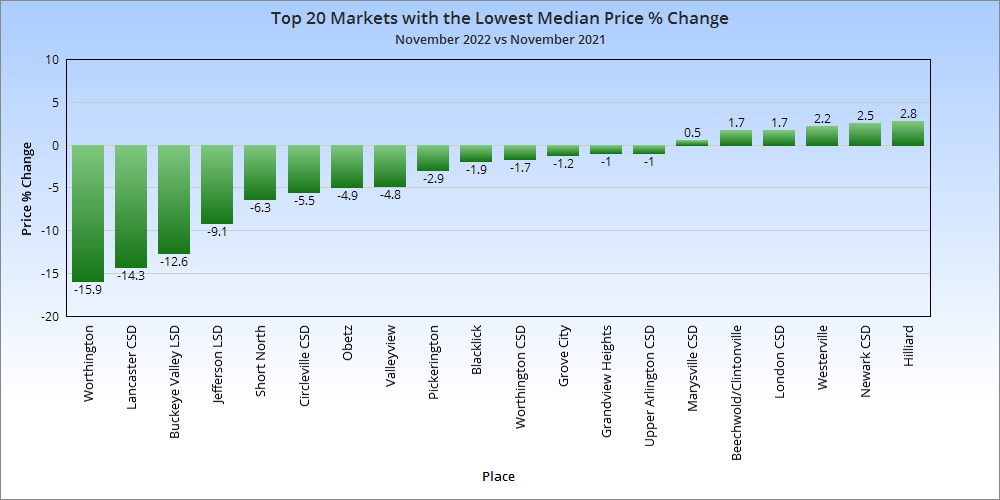
Best in the case of market median price % change is subjective. For buyers, it would be prices that have increased the least or even declined, while for sellers it would be the largest increases.
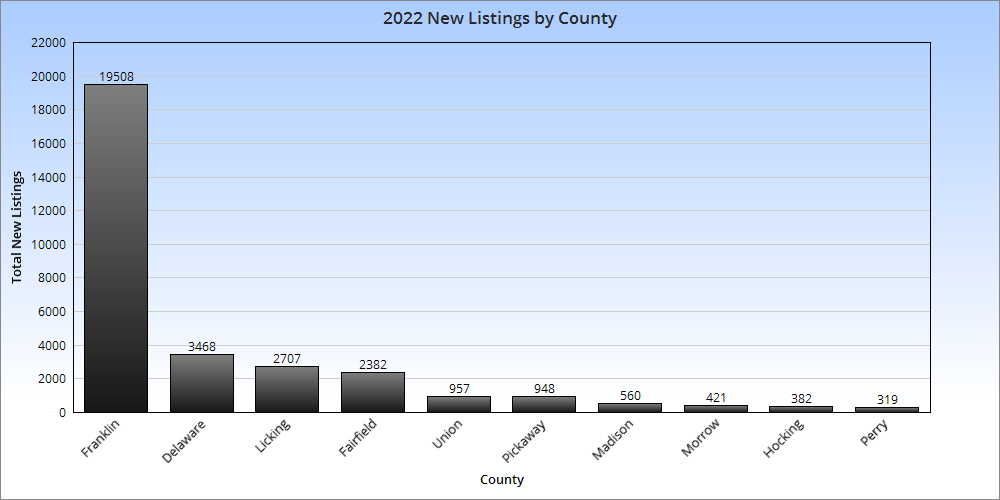
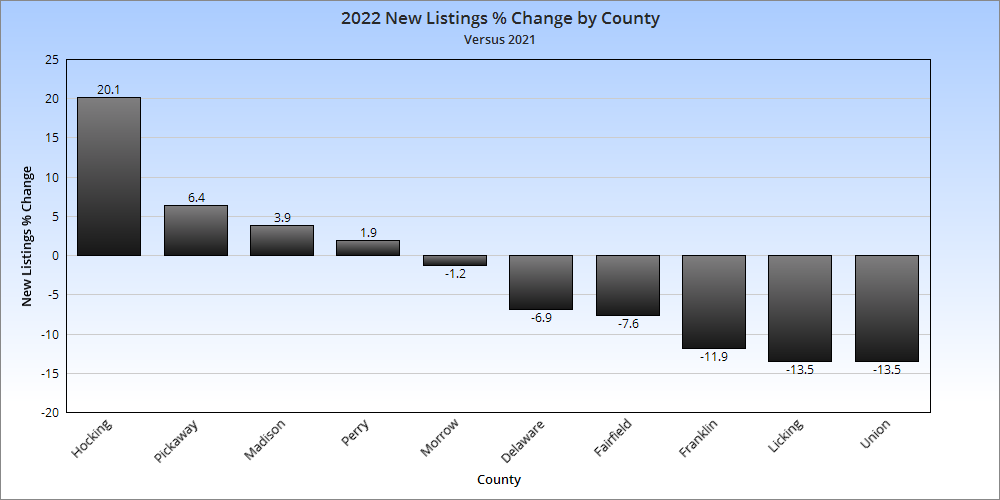
Total Metro New Listings in 2022: 31,652 Total Metro New Listings Change from 2021 to 2022: -3,508 Thousands of fewer homes going to market helped keep prices rising across the metro despite a significant slowdown in overall sales.
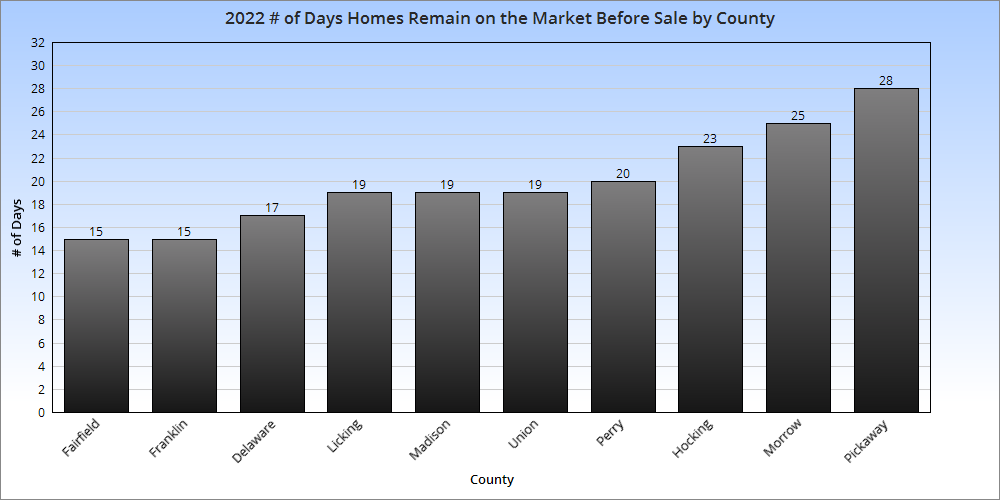
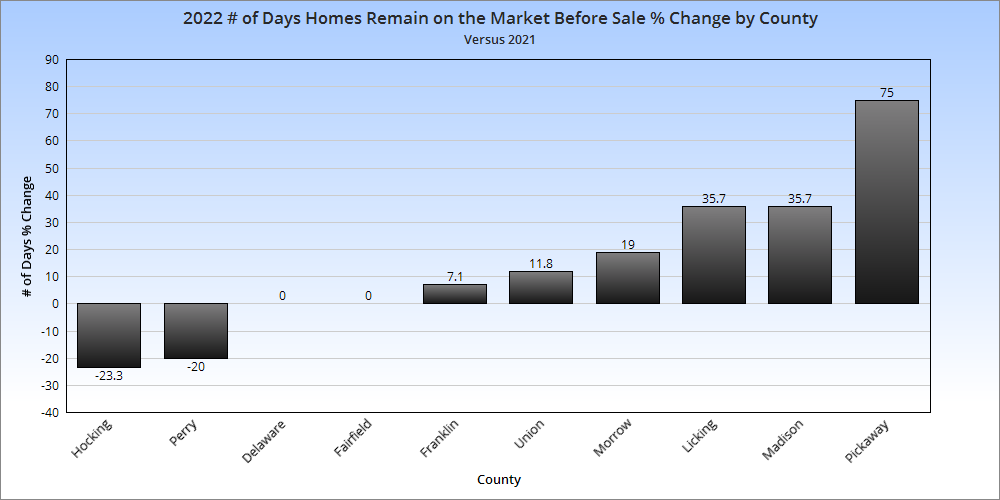
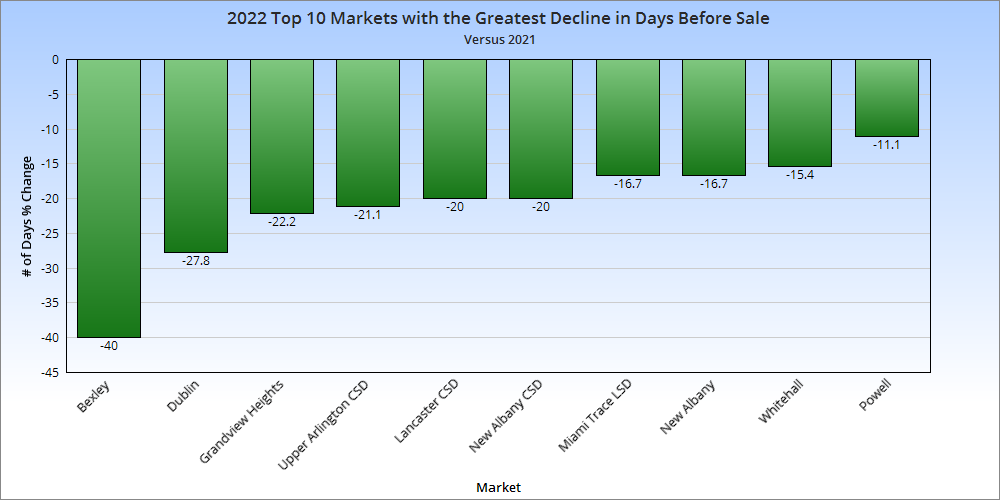
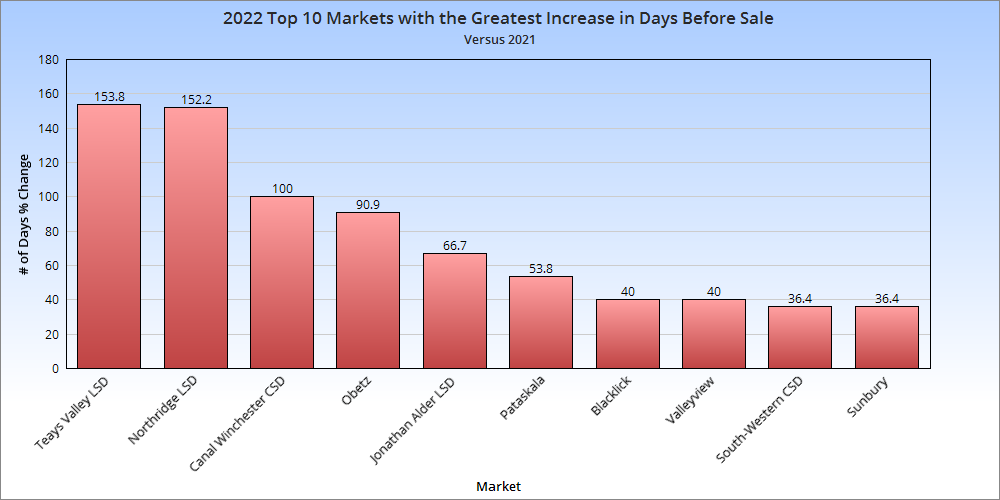
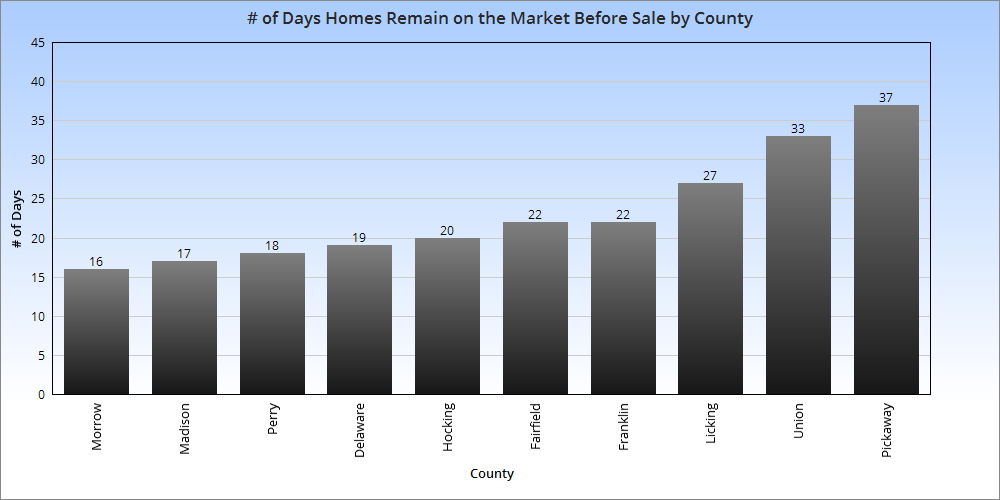
Average # of Days Homes Remain on the Market Before Sale for the Metro Overall in 2022: 20.0 # of Days Homes Remain on the Market Before Sale % Change for the Metro 2021 vs. 2022: +9.3%
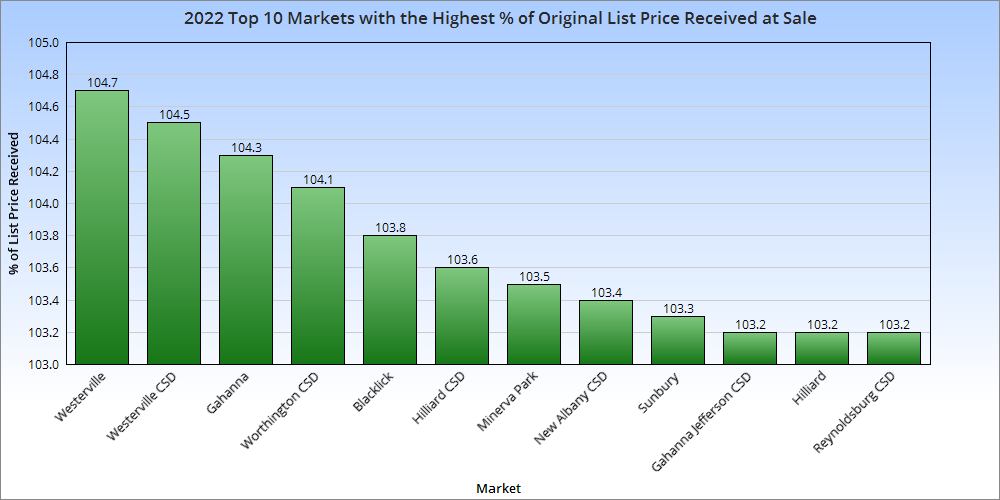
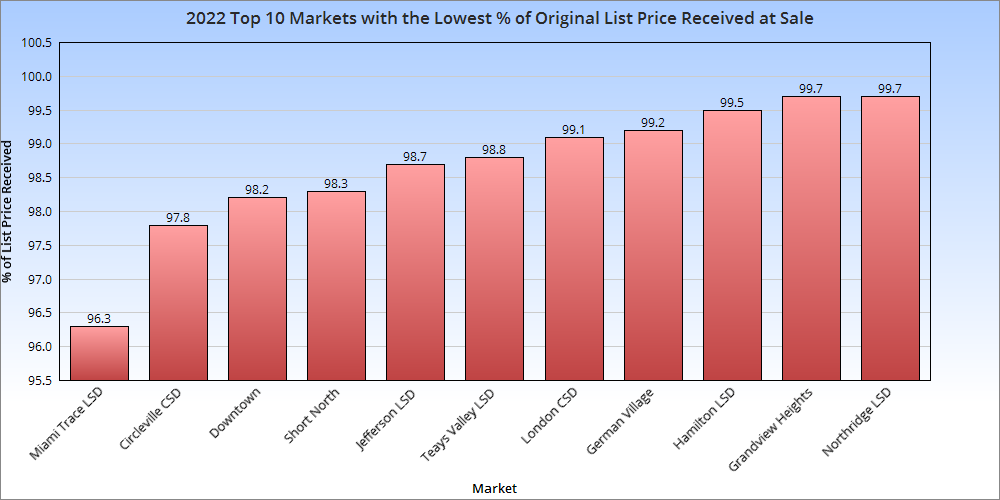
This new data shows whether a market was receiving more or less than the original list price for the homes for sale. Those above 100% were markets that typically had buyer competition to the point where they had to pay more than list. Those below 100% were the opposite, where relatively lower demand allowed some buyers to get a home for under list.
And there you have it, the final housing market update for 2022!
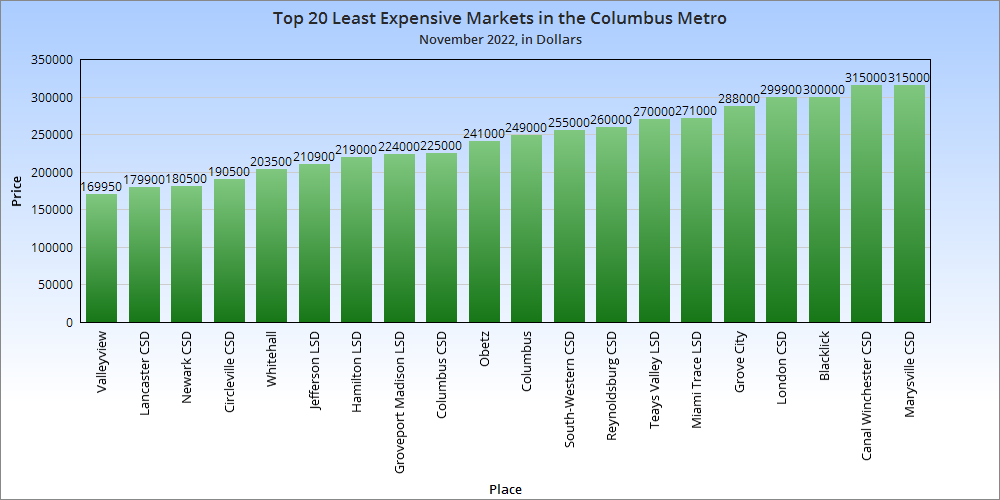
The Housing Market Update November 2022 data from Columbus Realtors showed home sales were down nearly 30% from a year ago, and new listings decreased nearly as much. However, prices remained on their trajectory upwards across the metro area.
Note: LSD= Local School District, CSD= City School District. In both cases, school district boundaries differ from city boundaries.
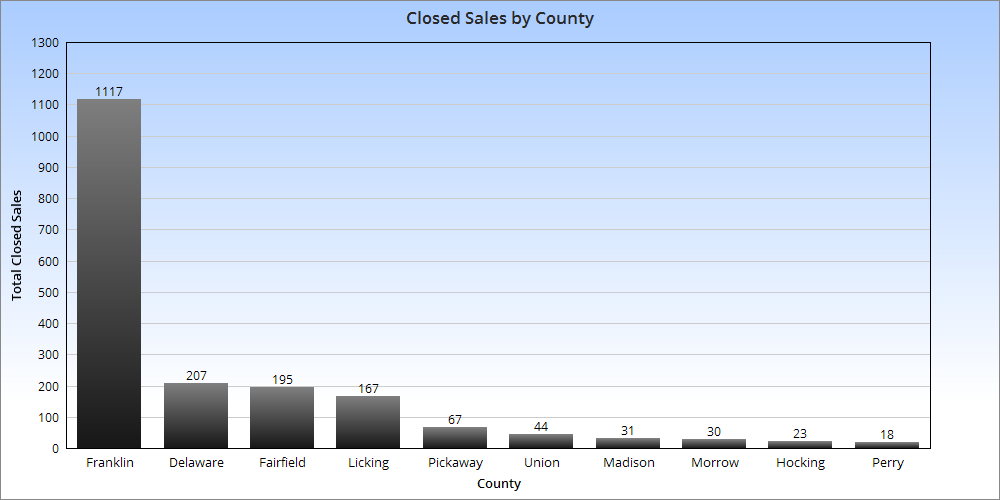
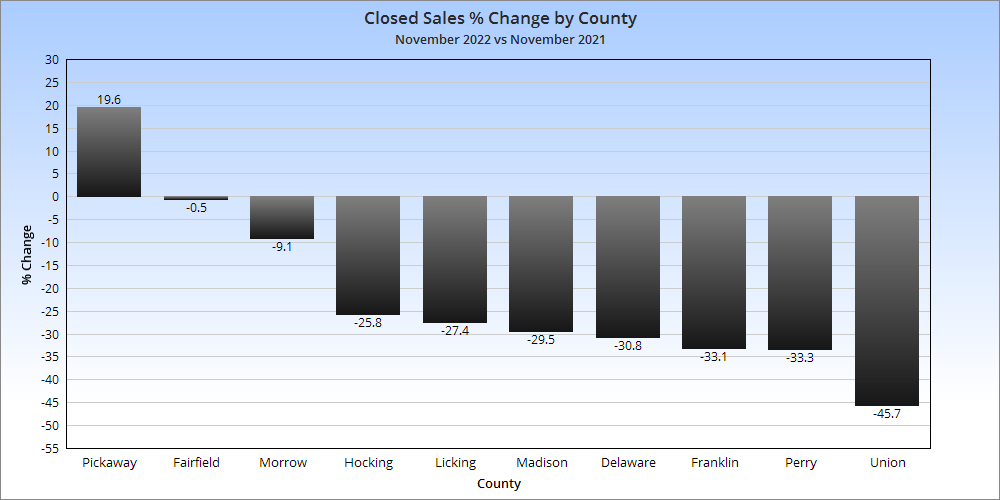
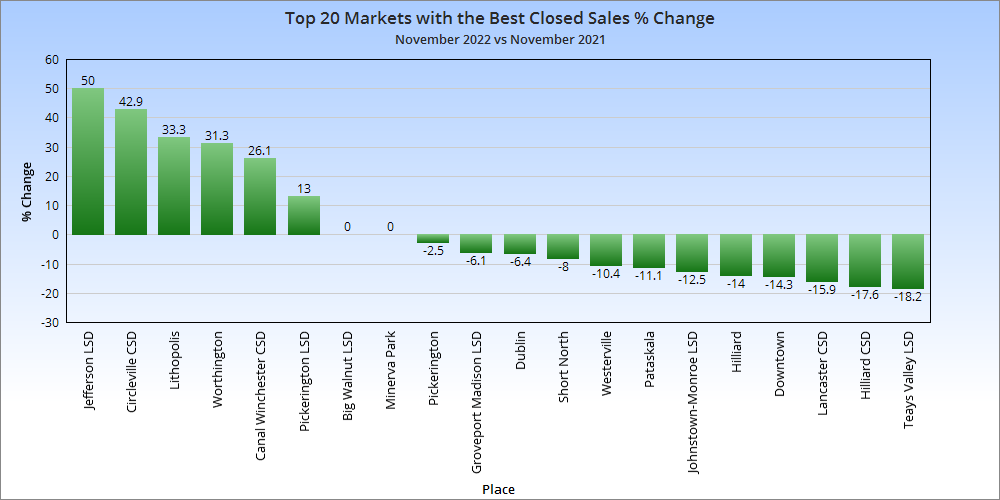
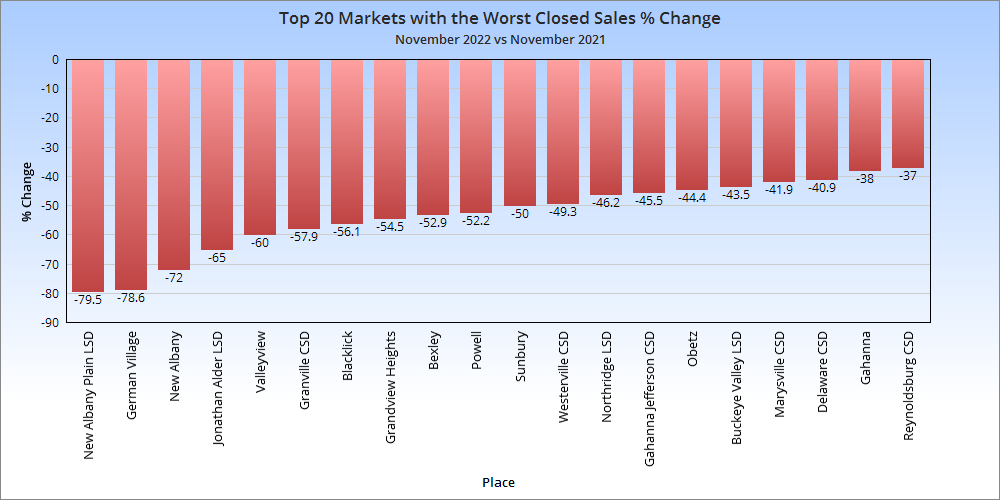
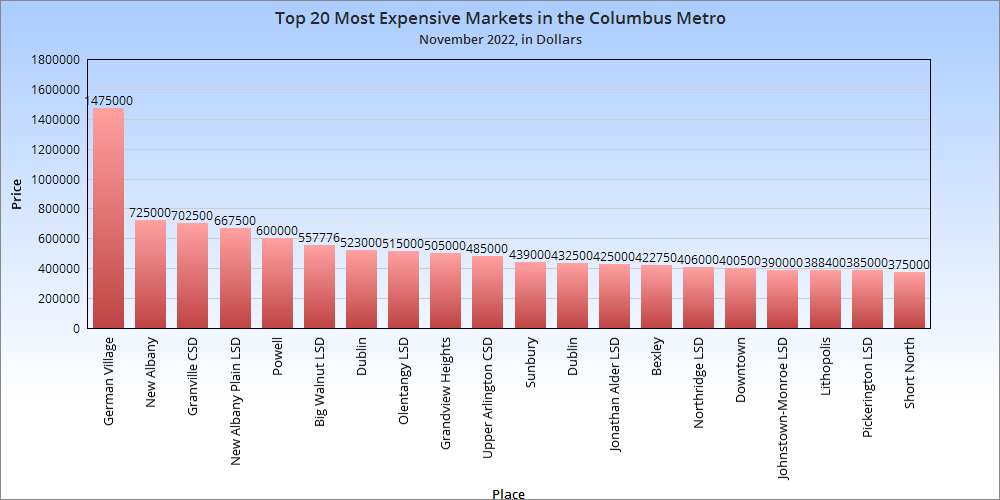
Closed sales are those sales that were completed during the month. 9 of the 10 metro counties saw declines, with 8 of them being fairly significant. Few markets were up year-over-year. The worst-performing were mostly among the metro’s most expensive areas, but there were a few standouts otherwise.
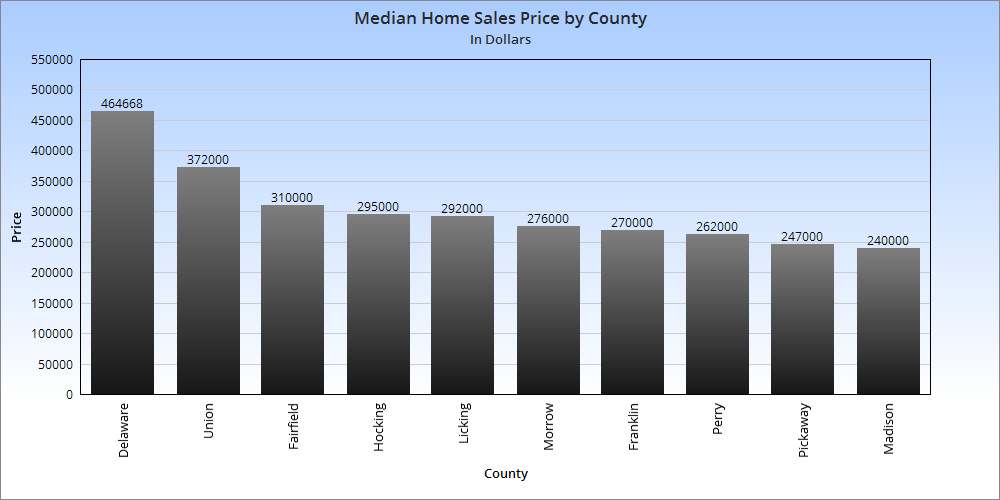
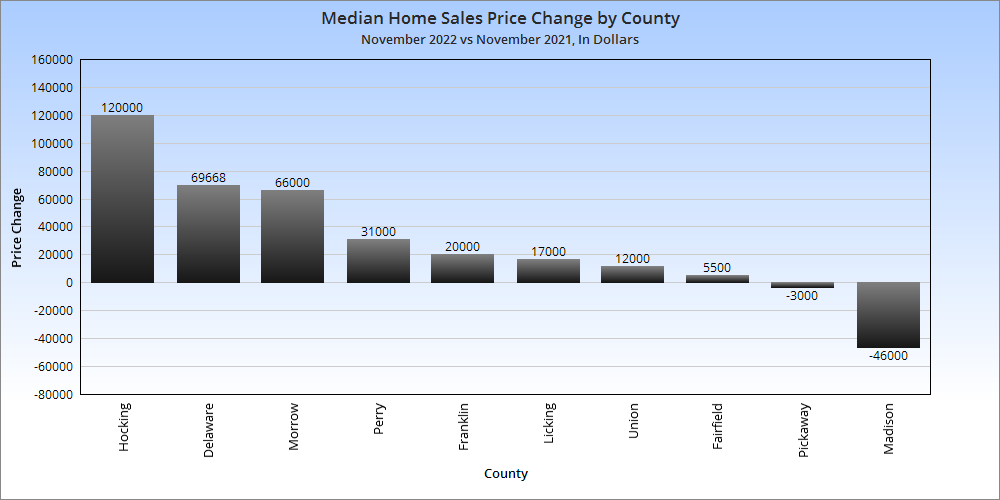
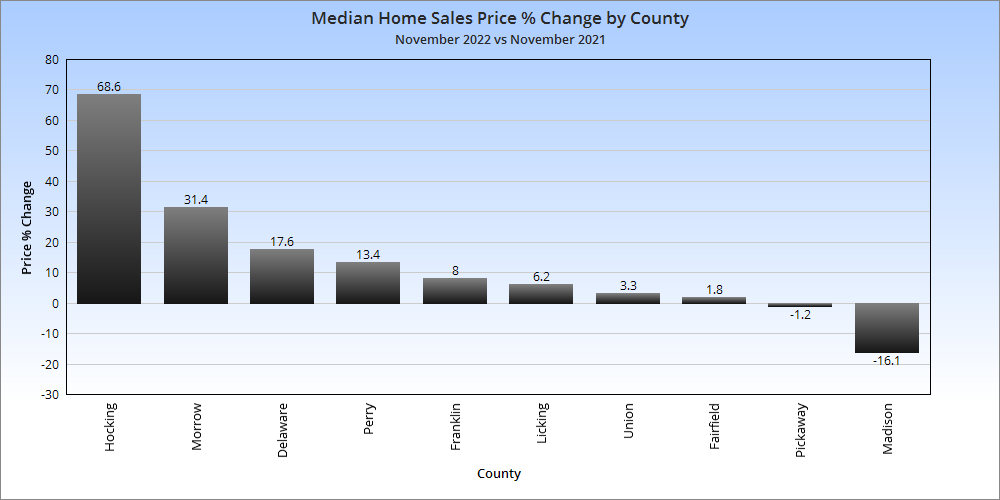
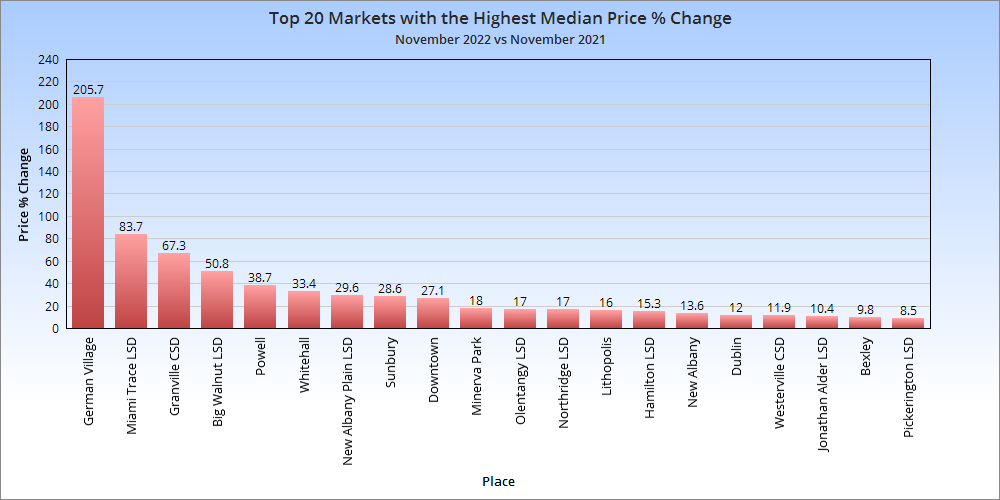
No real surprises except that the greatest increases were in the far southeast metro counties, but that could be because of working with a small supply. Overall Market Median Sales Price in November 2022: $302,867 Based on the 10 Columbus Metro Area counties, the metro price saw a more than $29,000 increase over November, 2021. Overall Market Median Sales Price % Change in November, 2022 versus November, 2021: +10.1% Despite the relative collapse in home sales, prices continued to rise by more than 10% year-over-year.
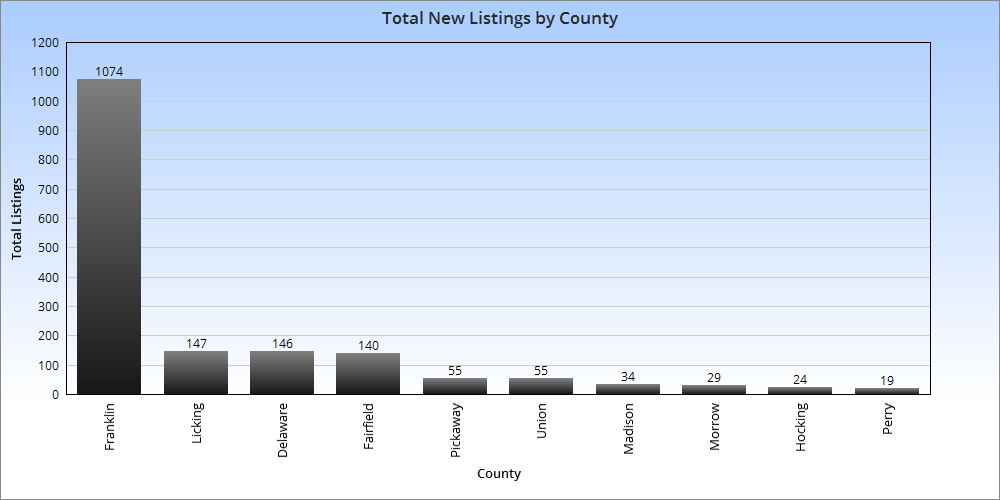
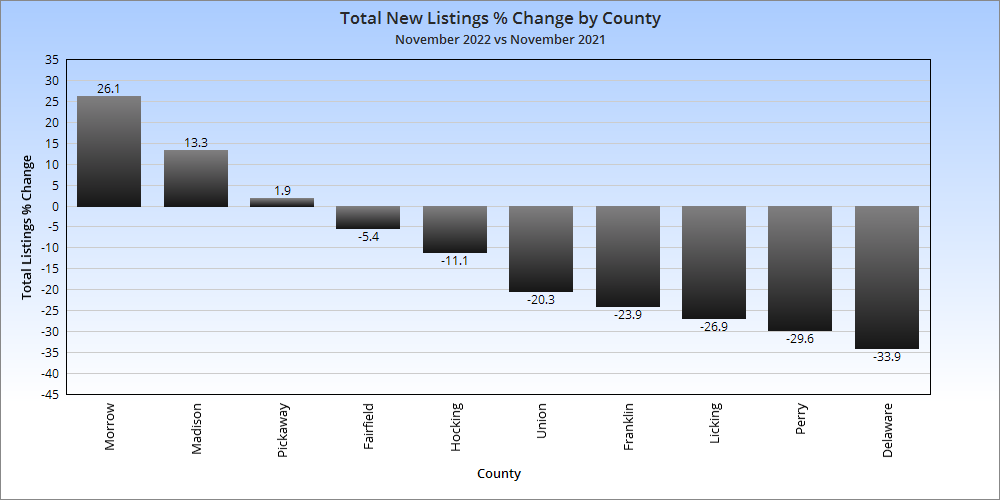
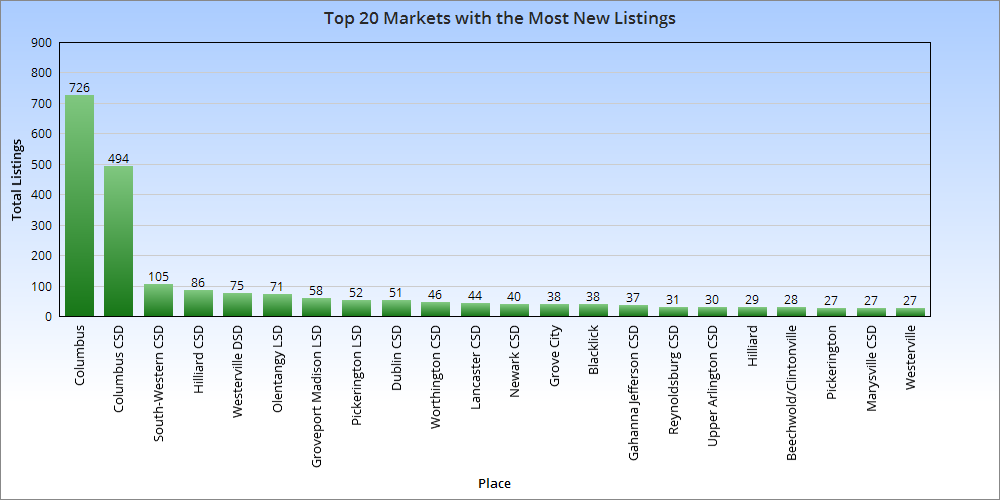
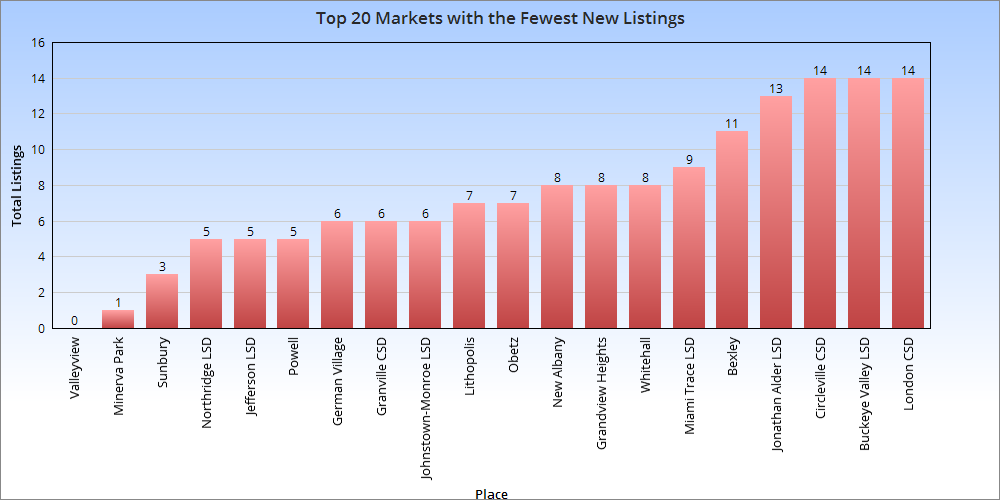
Most counties saw new listing totals drop year-over-year. This may have helped keep prices going up as demand hasn’t evaporated. Total Metro New Listings in November, 2022: 1,723 Total Metro New Listings Change from November, 2021 to November, 2022: -489
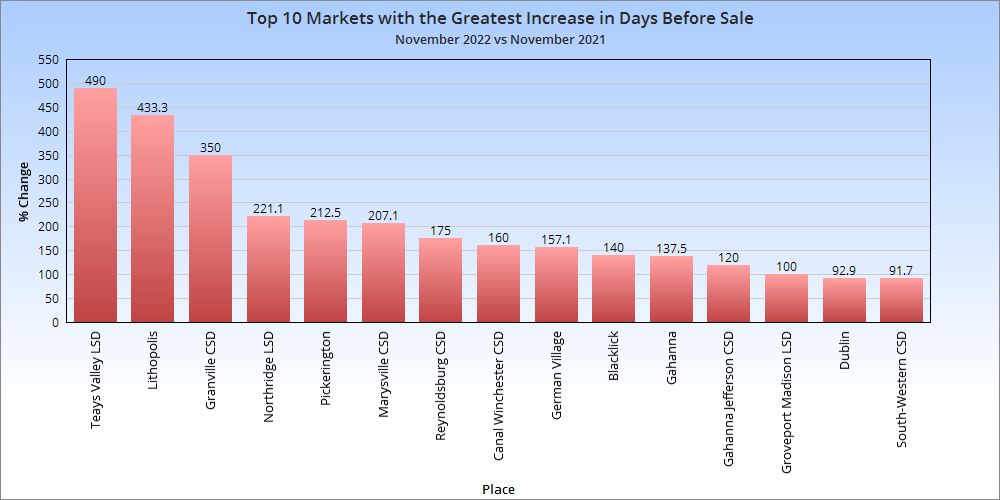
Average # of Days Homes Remain on the Market Before Sale for the Metro Overall in November, 2022: 23.1 # of Days Homes Remain on the Market Before Sale for the Metro November, 2021 vs. November, 2022: +10.5 Homes sold more slowly around the Columbus metro, but only by a few days. The rate of sale is still historically fast.
For the Housing Market Update July 2022, it seems that whatever minor signs of a market slowdown all but disappeared in July, with strong price increases and shrinking supply almost across the board. All data comes from Columbus Realtors.
Note: LSD= Local School District, CSD= City School District. In both cases, school district boundaries differ from city boundaries.
Top 15 Most Expensive Locations By Median Sales Price in July 2022 1. New Albany: $1,001,000 2. New Albany Plain LSD: $836,500 3. German Village: $590,000 4. Powell: $582,500 5. Dublin: $557,000 6. Grandview Heights: $544,500 7. Bexley: $520,000 8. Worthington: $512,000 9. Dublin CSD: $510,000 10. Olentangy LSD: $500,000 11. Big Walnut LSD: $499,990 12. Upper Arlington CSD: $494,950 13. Granville LSD: $471,000 14. Buckeye Valley LSD: $460,000 15. Pickerington: $455,900 New Albany finally blew past the 1 million mark in July, almost 2x the next set of most expensive markets.
Top 15 Least Expensive Locations by Median Sales Price in July 2022 1. Valleyview: $163,000 2. Hamilton LSD: $184,500 3. Newark CSD: $200,000 4. Circleville CSD: $205,000 5. Lancaster CSD: $219,000 6. Miami Trace LSD: $234,900 7. Groveport Madison LSD: $240,000 8. Columbus CSD: $246,000 9. Jefferson LSD: $253,500 10. South Western CSD: $260,500 11. London CSD: $264,000 12. Columbus: $275,000 13. Grove City: $288,000 14. Reynoldsburg CSD: $297,500 15. Northridge LSD: $300,000 Only 2 metro markets remain below $200,000.
Overall Market Median Sales Price in July: $317,880 Based on the 10 Columbus Metro Area counties. This price was slightly lower than in May.
Top 15 Locations with the Highest Median Sales Price % Growth Between July 2021 and July 2022 1. Miami Trace LSD: +60.9% 2. Obetz: +36.8% 3. New Albany: +31.3% 4. Newark CSD: +31.1% 5. Pickerington: +29.0% 6. Teays Valley LSD: +26.4% 7. New Albany Plain LSD: +25.8% 8. Powell: +25.3% 9. Delaware CSD: +23.9% 10. German Village: +23.8% 11. Circleville CSD: +23.1% 12. Worthington: +22.8% 13. Westerville: +21.9% 14. Jefferson LSD: +21.9% 15. Marysville CSD: +20.2% 16. Canal Winchester CSD: +19.1%
Top 15 Locations with the Lowest Median Sales Price % Growth Between July 2021 and July 2022 1. Bexley: -15.4% 2. Short North: -13.0% 3. Northridge LSD: -9.5% 4. Hamilton LSD: -5.8% 5. Valleyview: -5.8% 6. Grove City: -2.3% 7. Sunbury: -0.6% 8. London CSD: +0.3% 9. Upper Arlington CSD: +0.5% 10. Buckeye Valley LSD: +2.2% 11. Columbus CSD: +4.75 12. Dublin: +5.1% 13. Downtown: +5.2% 14. Jonathan Alder LSD: +6.1% 15. South Western CSD: +6.3% 16. Beechwold/Clintonville: +6.5% Downtown finally broke a string of negative months.
Overall Market Median Sales Price % Change July 2022 vs. July 2021:+13.1% Based on 53 metro market locations.
Top 10 Locations with the Most New Listings in July 2022 1. Columbus: 1,278 2. Columbus CSD: 854 3. Olentangy LSD: 204 4. South Western CSD: 181 5. Dublin CSD: 159 6. Westerville CSD: 158 7. Hilliard CSD: 155 8. Pickerington LSD: 109 9. Gahanna Jefferson CSD: 100 10. Newark CSD: 79
Top 10 Locations with the Fewest New Listings in July 2022 1. Valleyview: 0 2. Jefferson LSD: 3 3. Minerva Park: 6 4. Lithopolis: 6 5. Obetz: 6 6. Grandview Heights: 7 7. Northridge LSD: 9 8. Granville LSD: 9 9. Miami Trace LSD: 10 10. New Albany: 10 11. Jonathan Alder LSD: 13 12. Sunbury: 14 13. Germany Village: 15 14. Hamilton LSD: 16 15. Whitehall: 16
Total New Listings in the Columbus Metro in July 2022:+3,239 Overall Metro New Listings % Change July 2022 vs July 2021:-20.3% New listings fell strongly in July versus a year prior as the familiar story of demand far outpacing supply continued in the metro area.
Top 10 Fastest-Selling Locations by # of Days Homes Remain on the Market Before Sale in July 2022 1. Lithopolis: 3 2. Minerva Park: 4 3. Circleville CSD: 5 4. Gahanna: 6 5. Obetz: 6 6. Sunbury: 6 7. Canal Winchester CSD: 7 8. Hilliard: 7 9. Jonathan Alder LSD: 7 10. Pickerington: 7 11. Big Walnut LSD: 8 12. Dublin: 8 13. Hamilton LSD: 8 14. Hilliard CSD: 8 15. Newark CSD: 8 16. Northridge LSD: 8 17. Reynoldsburg CSD: 8 18. Upper Arlington CSD: 8 19. Valleyview: 8 20. Whitehall: 8 21. Worthington CSD: 8 22. Granville LSD: 9 23. Jefferson LSD: 9 24. Pickerington LSD: 9 25. New Albany LSD: 9 26. Powell: 9 27. Delaware CSD: 10 28. Lancaster CSD: 10 29. South Western CSD: 10 30. Westerville CSD: 10 31. Worthington: 10 32. Blacklick: 11 33. Columbus: 11 34. Dublin CSD: 11 35. Gahanna Jefferson CSD: 11 36. London CSD: 11 37. New Albany: 11 38. Beechwold/Clintonville: 12 39. Groveport Madison LSD: 12 Most local markets continue to have very low selling spread between them.
Top 10 Slowest-Selling Locations by # of Days Homes Remain on the Market Before Sale in July 2022 1. Short North: 48 2. German Village: 39 3. Downtown: 37 4. Teays Valley LSD: 35 5. Miami Trace LSD: 30 6. Grandview Heights: 19 7. Grove City: 16 8. Johnstown Monroe LSD: 16 9. Marysville CSD: 15 10. Pataskala: 15 11. Buckeye Valley LSD: 14 12. Columbus CSD: 14 13. Olentangy LSD: 14 14. Bexley: 13 15. Westerville: 13
Top 10 Locations with the Greatest % Decline of # of Days on the Market Before Sale July 2022 vs. July 2021 1. Big Walnut LSD: -63.6% 2. New Albany LSD: -57.1% 3. Buckeye Valley LSD: -53.3% 4. Dublin: -46.7% 5. New Albany: -45.0% 6. Minerva Park: -42.9% 7. Northridge LSD: -42.9% 8. Granville LSD: -40.0% 9. Circleville CSD: -37.5% 10. Hamilton LSD: -33.3% 11. Pickerington: -30.0%
Top 10 Locations with the Lowest % Decline of # of Days on the Market Before Sale July 2022 vs. July 2021 1. Teays Valley LSD: +600.0% 2. Johnstown Monroe LSD: +433.3% 3. German Village: +387.5% 4. Short North: +269.2% 5. Obetz: +200.0% 6. Valleyview: +166.7% 7. Gahanna Jefferson CSD: +120.0% 8. Grove City: +100.0% 9. Reynoldsburg CSD: +100.0% 10. Westerville: +85.7% 11. Blacklick: +83.3%
Total # of Days Homes Remain on the Market Before Sale Across the Metro Overall: 16.2 Overall Metro Days on Market % Change July 2022 vs July 2021: +45.9% Homes spent much longer on the market across the metro than they did the year before, but the pace was still relatively fast.
In this latest edition of the Housing Market Update May 2022, we see that home prices continue to reach record levels in the metro area, and houses are selling faster than ever. With rising mortgage interest rates, will the region eventually see a slowdown?
Note: LSD= Local School District, CSD= City School District. In both cases, school district boundaries differ from city boundaries.
Top 15 Most Expensive Locations By Median Sales Price in May 2022 1. New Albany: $789,900 2. New Albany Plain LSD: $650,000 3. Big Walnut LSD: $572,127 4. Powell: $565,000 5. Upper Arlington CSD: $558,000 6. Dublin: $555,000 7. Grandview Heights: $545,000 8. Granville CSD: $530,000 9. Dublin CSD: $515,000 10. Olentangy LSD: $505,000 11. Buckeye Valley LSD: $495,000 12. Worthington: $481,000 13. German Village: $475,000 14. Bexley: $470,000 15. Pickerington: $444,000 16. Canal Winchester CSD: $430,000 Several suburbs now have median prices at or above half a million dollars, with several others not too far behind.
Top 15 Least Expensive Locations by Median Sales Price in May 2022 1. Lancaster CSD: $175,000 2. Miami Trace LSD: $180,000 3. Newark CSD: $184,000 4. Circleville CSD: $187,500 5. Whitehall CSD: $205,000 6. Jefferson LSD: $220,000 7. London CSD: $227,450 8. Groveport Madison LSD: $243,000 9. Hamilton LSD: $256,700 10. Obetz: $256,700 11. Columbus CSD: $257,500 12. Columbus: $277,750 13. Reynoldsburg CSD: $280,500 14. Minerva Park: $291,500 15. South Western CSD: $295,450 On the opposite side of things, even some of the cheapest markets are approaching the $300K mark. Columbus itself remains *relatively* affordable in comparison to the market overall.
Overall Market Median Sales Price in May: $303,460 Based on the 10 Columbus Metro Area counties.
Top 15 Locations with the Highest Median Sales Price % Growth Between May 2021 and May 2022 1. Canal Winchester CSD: +65.4% 2. Big Walnut LSD: +50.4% 3. Whitehall: +48.6% 4. Northridge LSD: +42.6% 5. Groveport Madison LSD: +39.0% 6. Grandview Heights: +38.3% 7. Granville CSD: +31.7% 8. Gahanna: +27.6% 9. Teays Valley LSD: +26.4% 10. Pataskala: +26.3% 11. Pickerington: +25.1% 12. Downtown: +24.3% 13. Johnstown-Monroe LSD: +23.5% 14. Powell: +22.8% 15. Sunbury: +22.5%
Top 15 Locations with the Lowest Median Sales Price % Growth Between May 2021 and May 2022 1. German Village: -24.6% 2. Miami Trace LSD: -19.3% 3. Obetz: -14.0% 4. Bexley: -5.5% 5. Delaware CSD: -4.7% 6. New Albany: -2.5% 7. Minerva Park: -2.2% 8. Lancaster CSD: -0.6% 9. Newark CSD: -0.1% 10. Jonathan Alder LSD: 0.0% 11. Short North: 0.5% 12. London CSD: +1.1% 13. Westerville: +2.4% 14. Circleville CSD: +3.0% 15. Beechwold/Clintonville: +3.5% So far, the “Intel Effect” has yet to kick in in places like Newark and some Northeast Side communities. Only Johnstown is seeing a significant price increase. This may have to do with some of these places already being overvalued, especially New Albany.
Overall Market Median Sales Price % Change May 2022 vs. May 2021:+14.5% Based on 53 metro market locations.
Top 10 Locations with the Most New Listings in May 2022 1. Columbus: 1,337 2. Columbus CSD: 898 3. Olentangy LSD: 214 4. South Western CSD: 210 5. Hilliard CSD: 162 6. Dublin CSD: 146 7. Westerville CSD: 139 8. Worthington CSD: 94 9. Dublin: 90 10. Lancaster CSD: 88
Top 10 Locations with the Fewest New Listings in May 2022 1. Valleyview: 0 2. Lithopolis: 2 3. Minerva Park: 5 4. Obetz: 6 5. Jefferson LSD: 12 6. Northridge LSD: 14 7. Johnstown-Monroe LSD: 15 8. Miami Trace LSD: 18 9. Sunbury: 20 10. Granville CSD: 20 11. German Village: 21
Total New Listings in the Columbus Metro in May 2022:+3,362 Overall Metro New Listings % Change May 2022 vs May 2021:-3.1% New listings fell in May year-over-year even though the late spring is often a time when more homes go onto the market. Franklin County had one of the largest declines in inventory, dropping about 6.9%.
Top 10 Fastest-Selling Locations by # of Days Homes Remain on the Market Before Sale in May 2022 1. Grandview Heights: 3 2. Canal Winchester CSD: 4 3. Hilliard: 4 4. Miami Trace LSD: 4 5. Minerva Park: 4 6. Westerville: 4 7. Westerville CSD: 4 8. German Village: 5 9. Hilliard CSD: 5 10. Marsyville CSD: 5 11. Powell: 5 12. Reynoldsburg CSD: 5 13. Sunbury: 5 14. Worthington: 5 15. Worthington CSD: 5 16. Bexley: 6 17. Dublin: 6 18. Groveport Madison LSD: 6 19. Jefferson LSD: 6 20. Pickerington: 6 21. Hamilton LSD: 7 22. Lancaster CSD: 7 23. Newark CSD: 7 24. Pickerington LSD: 7 25. Upper Arlington CSD: 7 26. Whitehall: 7 27. Beechwold/Clintonville: 8 28. Gahanna: 8 29. Delaware CSD: 9 30. South Western CSD: 9 31. Blacklick: 10 32. Columbus: 10 33. Johnstown-Monroe LSD: 10 34. Gahanna Jefferson LSD: 12 35. Dublin CSD: 13 36. Grove City: 13
The “Top 10” became the Top 36 just given that most of the local markets are selling so similarly quickly. There is relatively little spread between the fastest and slowest-selling markets, with some obvious exceptions.
Top 10 Slowest-Selling Locations by # of Days Homes Remain on the Market Before Sale in May 2022 1. Northridge LSD: 84 2. Downtown: 75 3. New Albany: 29 4. Buckeye Valley LSD: 28 5. Granville CSD: 27 6. Teays Valley LSD: 27 7. London CSD: 26 8. Short North: 25 9. Jonathan Alder LSD: 22 10. Big Walnut LSD: 20 11. New Albany LSD: 19 12. Obetz: 19 13. Pataskala: 19
Top 10 Locations with the Greatest % Decline of # of Days on the Market Before Sale May 2022 vs. May 2021 1. Bexley: -76.0% 2. Jefferson LSD: -73.9% 3. Lancaster CSD: -72.0% 4. Dublin: -68.4% 5. Johnstown-Monroe LSD: -64.3% 6. Grandview Heights: -62.5% 7. Reynoldsburg CSD: -58.3% 8. Short North: -51.0% 9. Hamilton LSD: -50.0% 10. Hilliard: -50.0% 11. Westerville: -50.0% 12. Hilliard CSD: -44.4%
Top 10 Locations with the Lowest % Decline of # of Days on the Market Before Sale May 2022 vs. May 2021 1. Northridge LSD: +1,300.0% 2. Jonathan Alder LSD: +633.3% 3. Valleyview: +400.0% 4. London CSD: +188.9% 5. New Albany: +141.7% 6. New Albany LSD: +111.1% 7. Downtown: +92.3% 8. Granville CSD: +80.0% 9. Circleville CSD: +77.8% 10. Teays Valley LSD: +68.8%
% Change for the # of Days Homes Remain on the Market Before Sale Across the Metro Overall: 15.6 Overall Metro Days on Market % Change May 2022 vs May 2021: -1.3%
Columbus Realtors offers monthly housing reports and other data back several years.
The local housing market update March 2022 has been release by Columbus Realtors. Here are the numbers!
Note: LSD= Local School District, CSD= City School District. In both cases, school district boundaries differ from city boundaries.
Top 15 Most Expensive Locations By Median Sales Price in March 2022 1. New Albany: $682,500 2. German Village: $667,500 3. Powell: $638,000 4. New Albany Plain LSD: $535,000 5. Grandview Heights: $535,000 6. Upper Arlington CSD: $525,000 7. Big Walnut LSD: $520,000 8. Olentangy LSD: $500,000 9. Dublin: $481,000 10. Short North: $480,000 11. Granville CSD: $460,000 12. Dublin CSD: $430,000 13. Jonathan Alder LSD: $413,500 14. Bexley: $410,000 15. Pickerington: $408,000 16. Worthington: $408,000
Top 15 Least Expensive Locations by Median Sales Price in March 2022 1. Whitehall: $160,250 2. Circleville CSD: $162,500 3. Newark CSD: $180,000 4. Lancaster CSD: $180,000 5. Hamilton LSD: $185,000 6. Obetz: $209,000 7. Miami Trace: $214,000 8. Columbus CSD: $234,000 9. Groveport Madison LSD: $237,500 10. Jefferson LSD: $240,950 11. Columbus: $248,000 12. London CSD: $250,000 13. South-Western CSD: $260,000 14. Blacklick: $270,000 15. Reynoldsburg CSD: $286,250
Overall Market Median Sales Price in March: $279,265 Based on the 10 Columbus Metro Area counties.
Top 15 Locations with the Highest Median Sales Price % Growth Between March 2021 and March 2022 1. Johnstown-Monroe LSD: +60.0% 2. Miami Trace LSD: +40.9% 3. German Village: +40.4% 4. Reynoldsburg CSD: +39.5% 5. Teays Valley LSD: +36.9% 6. Big Walnut LSD: +35.1% 7. Jefferson LSD: +30.2% 8. Jonathan Alder LSD: +29.2% 9. Pataskala: +28.6% 10. Northridge LSD: +28.5% 11. Groveport Madison LSD: +28.4% 12. Canal Winchester CSD: +25.6% 13. Hilliard CSD: +24.7% 14. Delaware CSD: +24.3% 15. Newark CSD: +23.3%
Top 15 Locations with the Lowest Median Sales Price % Growth Between March 2021 and March 2022 1. Circleville CSD: -22.6% 2. Lithopolis: -15.6% 3. Obetz: -8.1% 4. Buckeye Valley LSD: -3.0% 5. Bexley: -0.7% 6. London CSD: -0.4% 7. New Albany Plain LSD: +2.2% 8. Dublin CSD: +2.6% 9. Blacklick: +2.7% 10. Dublin: +4.1% 11. Grove City: +4.4% 12. New Albany: +4.7% 13. Sunbury: +5.5% 14. Worthington CSD: +9.7% 15. Westerville: +10.1%
Curiously, New Albany has not yet seen significant housing cost increases despite the news of the Intel development announced a few months ago, but that may just be due to the fact that housing prices there exceed all other markets by a good margin already.
Overall Market Median Sales Price % Change March 2022 vs. March 2021:+19.6% Based on 52 metro market locations.
Top 10 Locations with the Most New Listings in March 2022 1. Columbus: 1,161 2. Columbus CSD: 773 3. South Western CSD: 205 4. Olentangy LSD: 151 5. Westerville CSD: 144 6. Hilliard CSD: 121 7. Dublin CSD: 113 8. Pickerington LSD: 94 9. Worthington CSD: 85 10. Grove City: 84
Top 10 Locations with the Fewest New Listings in March 2022 1. Valleyview: 1 2. Minerva Park: 1 3. Lithopolis: 3 4. Sunbury: 10 5. Northridge LSD: 10 6. Obetz: 12 7. Johnstown Monroe LSD: 12 8. German Village: 13 9. Powell: 13 10. Jefferson LSD: 14 11. Whitehall: 14
Total New Listings in the Columbus Metro in March 2022:+2,901 Overall Metro New Listings % Change March 2022 vs March 2021:+3.7%
New listings did increase in March versus a year ago, but only slightly. Listings tend to increase as the weather warms up.
Top 10 Fastest-Selling Locations by # of Days Homes Remain on the Market Before Sale in March 2022 1. Lithopolis: 2 2. Miami Trace LSD: 3 3. Minerva Park: 3 4. Pickerington: 4 5. German Village: 5 6. Westerville: 5 7. Worthington: 5 8. Worthington CSD: 5 9. Dublin: 7 10. Gahanna: 7 11. Groveport Madison LSD: 7 12. New Albany: 7
Top 10 Slowest-Selling Locations by # of Days Homes Remain on the Market Before Sale in March 2022 1. Northridge LSD: 78 2. Downtown: 60 3. Granville CSD: 52 4. Short North: 51 5. Grandview Heights: 38 6. Oberz: 27 7. Circleville CSD: 25 8. Delaware CSD: 22 9. Hamilton LSD: 22 10. Johnstown Monroe LSD: 22
Top 10 Locations with the Greatest % Decline of # of Days on the Market Before Sale March 2022 vs. March 2021 1. Lithopolis: -96.6% 2. Miami Trace LSD: -85.7% 3. Pickerington: -84.6% 4. Dublin: -81.1% 5. Worthington CSD: -76.2% 6. Big Walnut LSD: -75.5% 7. Worthington: -72.2% 8. German Village: -70.6% 9. Westerville: -68.8% 10. Powell: -67.3%
Top 10 Locations with the Lowest % Decline of # of Days on the Market Before Sale March 2022 vs. March 2021 1. Canal Winchester CSD: +466.7% 2. Johnstown Monroe LSD: +450.0% 3. Northridge LSD: +254.5% 4. Granville CSD: +126.1% 5. Hilliard: +100.0% 6. Hamilton LSD: +69.2% 7. Obetz: +50.0% 8. Whitehall: +44.4% 9. London CSD: +30.0% 10. Grove City: +28.6% 11. Teays Valley LSD: +28.6%
% Change for the # of Days Homes Remain on the Market Before Sale Across the Metro Overall: 20.4 Overall Metro Days on Market % Change March 2022 vs March 2021: -12.1%