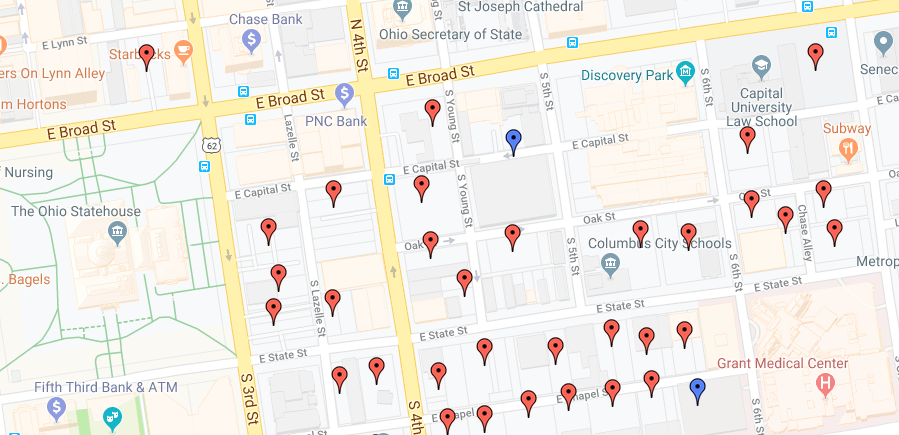
I was recently looking at real estate listings for the Near East Side and noticed what I think is a very unfortunate trend. Many historic homes in the neighborhoods of Olde Towne East and King-Lincoln are being ‘stripped and flipped’. Flippers buy the homes, strip them of their historic features, throw around endless gallons of white paint and call it a day.
These neighborhoods have some of the best surviving historic housing in all of Columbus. This is true despite being a focus of “urban renewal” demolitions for many years.
For a long time, the NES was being revitalized very slowly, with only piecemeal restorations of individual homes by private owners. Not without its own controversy, the early years even spawned a 2003 documentary called Flag Wars about the gentrification process in the area.
Controversy or not, this process had been the catalyst of restoring many historic homes. In recent years, as the neighborhoods have become hotter for investment, restoration has taken a back seat. The Columbus urban housing market has become ever tighter, and it’s become clear that many houses are being purchased by people that have little or no respect for the area’s historic heritage.
Let’s take a look first, however, at a few of what I would argue are fantastic examples of historic preservation, where the legacy of the architecture has mostly been respected.
1049 Franklin Avenue
This home, built in the 1890s, was updated in 2017.
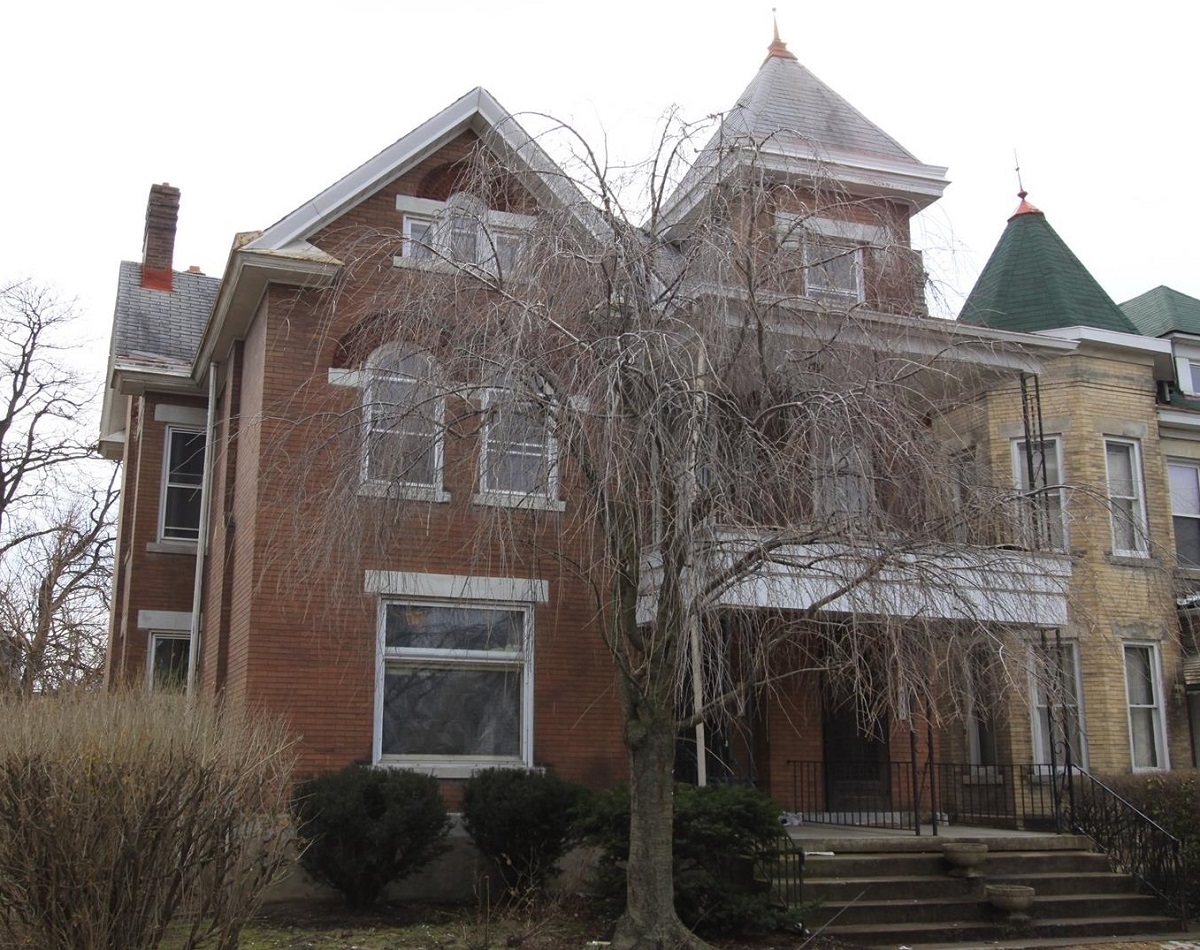
Photo taken in 2010.
The 2010 photo of the 2-unit shows the home mostly intact, with really only some restoration needed, particularly for the porch area. The double porch is not original to the house, which is listed as a single-family home in the historic record. The owners converted it into a duplex in 1943.
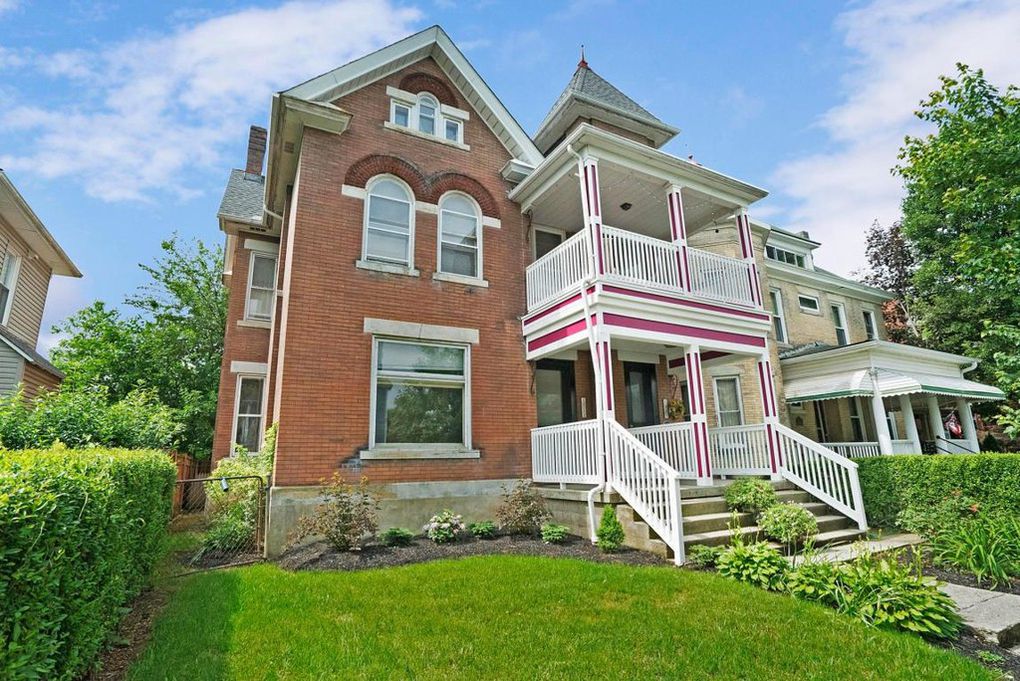
Photo taken in 2018.
The 2018 shows a mostly unchanged look aside from the porch. The renovation managed to turn a non-original part of the house into a beautiful feature while still maintaining the outward integrity of the home’s true age. While I don’t have before photos of the inside, the after ones show that equal care was given to the interior.
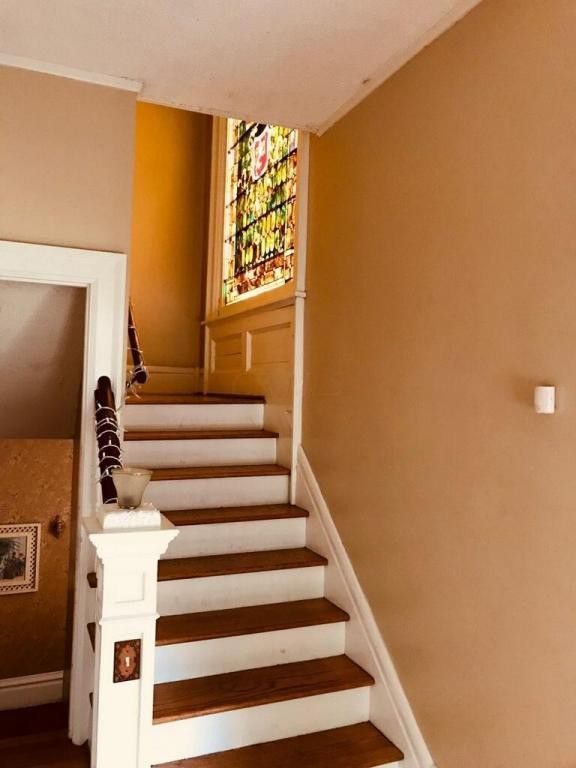
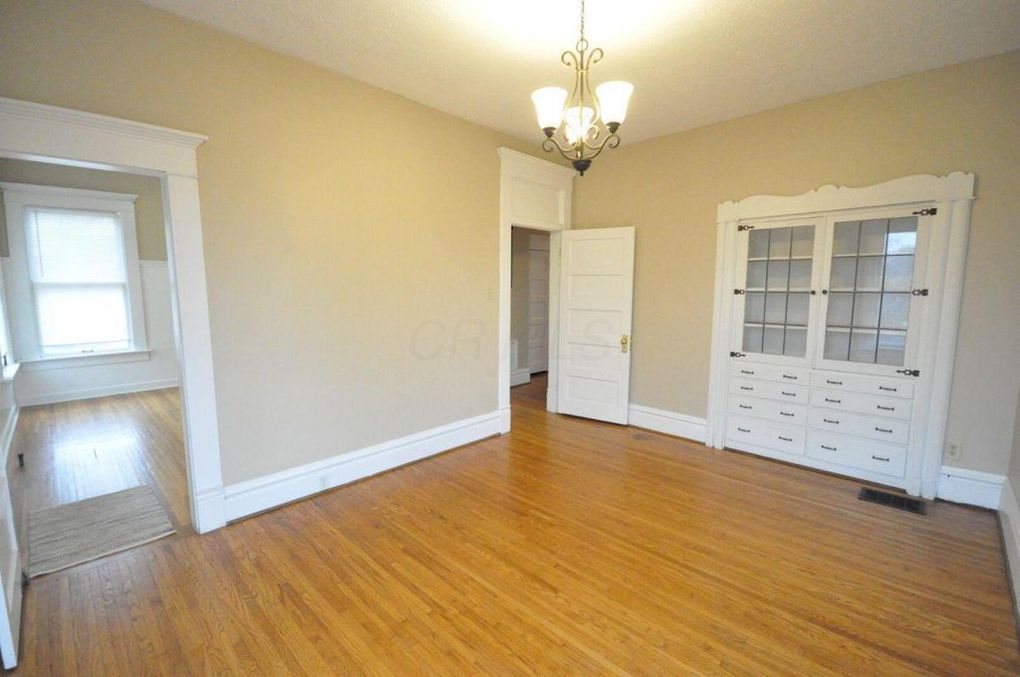
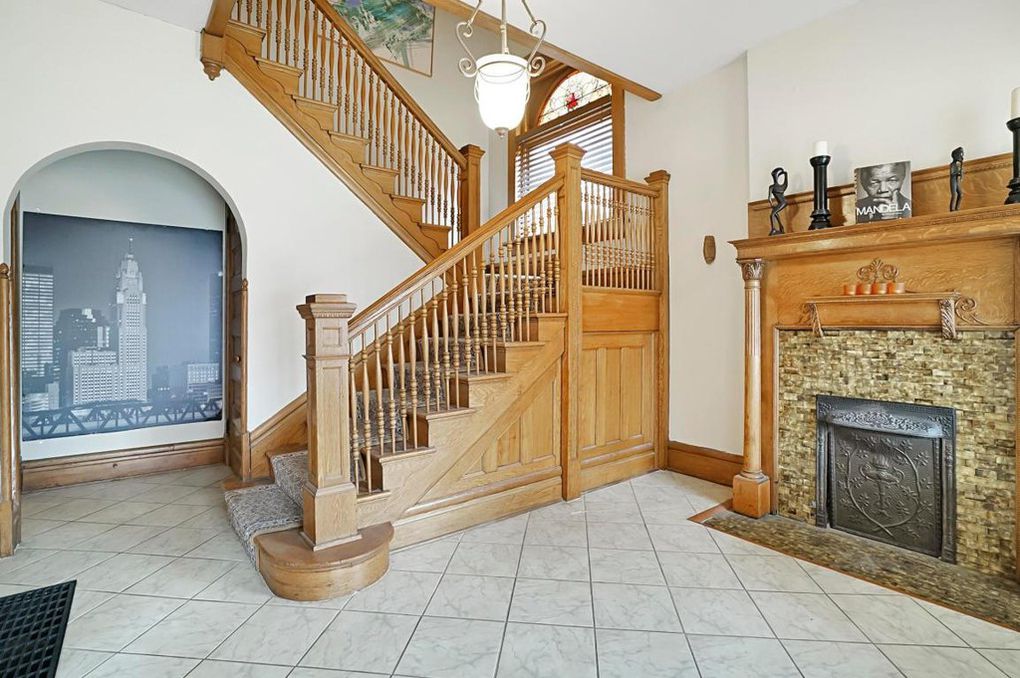
As these pictures show, the home has been updated without losing its character. Original hardwood floors have been restored, woodwork hasn’t all been whitewashed and details like built-ins and stained-glass windows remain intact.
248 South 17th Street
This single-family home from 1894 is another great example of a historic home being updated without extensive change.
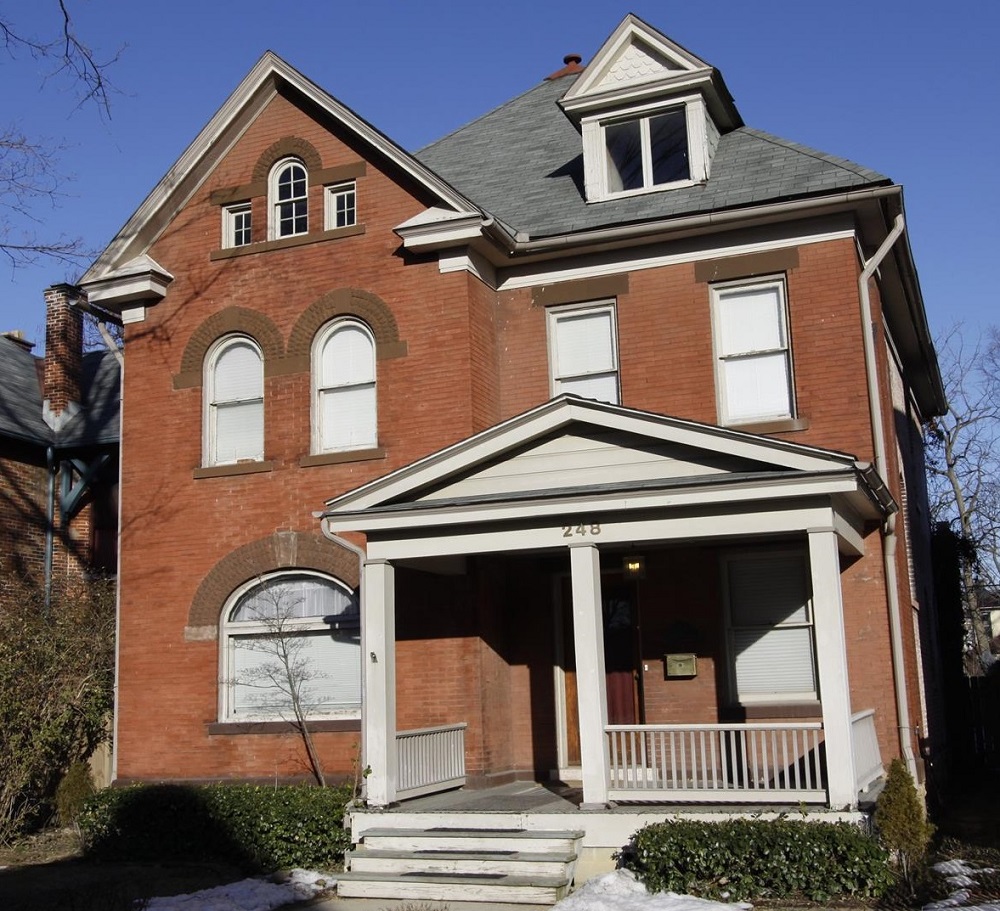
Photo taken in 2010.
The 2010 photo shows the house needs some updated curb appeal, but not much else.
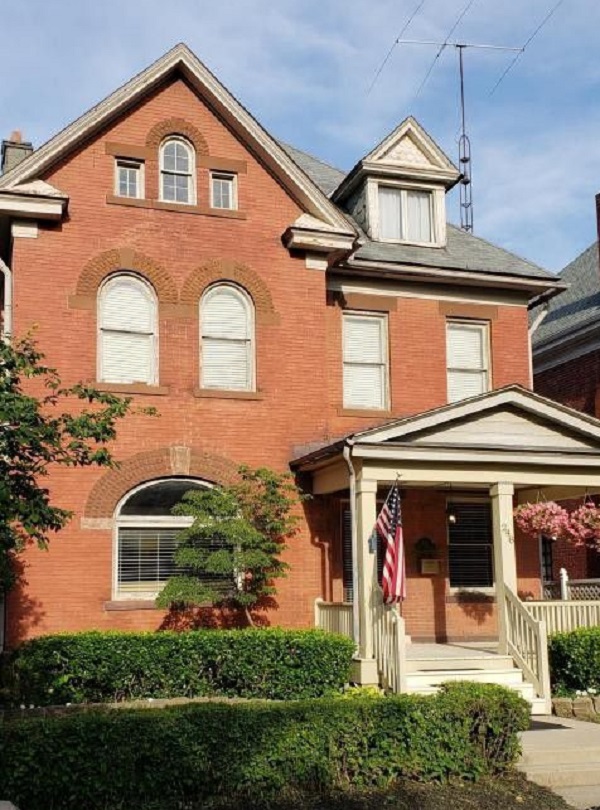
Photo taken in 2018.
In 2018, the curb appeal is there and the house looks fresh.

Again, the home has clearly been renovated, but it is also crystal clear that it’s a historic home.
So these are a few examples of the good, where the homes were respected for what they are.
Now let’s look at a few examples where the owners attempted to make the homes into something else, with minimal historic elements maintained or where the character of the homes was changed. These examples represent the majority of current renovations.
240 South 18th Street
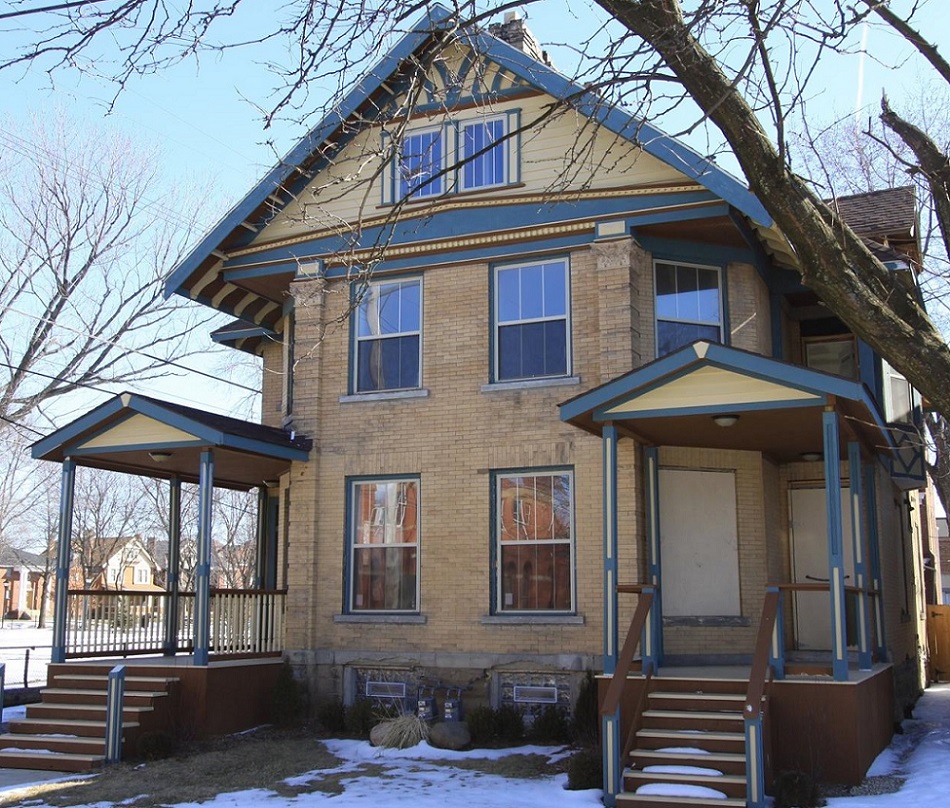
Photo taken in 2010.
In the 2010 photo of this 1900, 2-unit home, the right unit is boarded up, but otherwise the exterior appears to be in great shape.
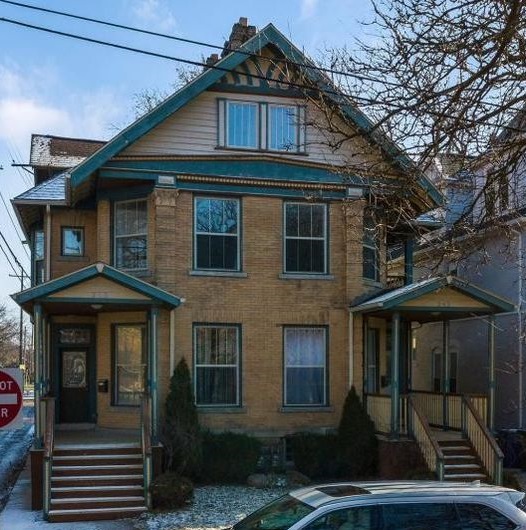
Photo taken in 2018.
In 2018, it appears that there has been virtually no change to the exterior except the boards have come off.
The same cannot be said for the interior.
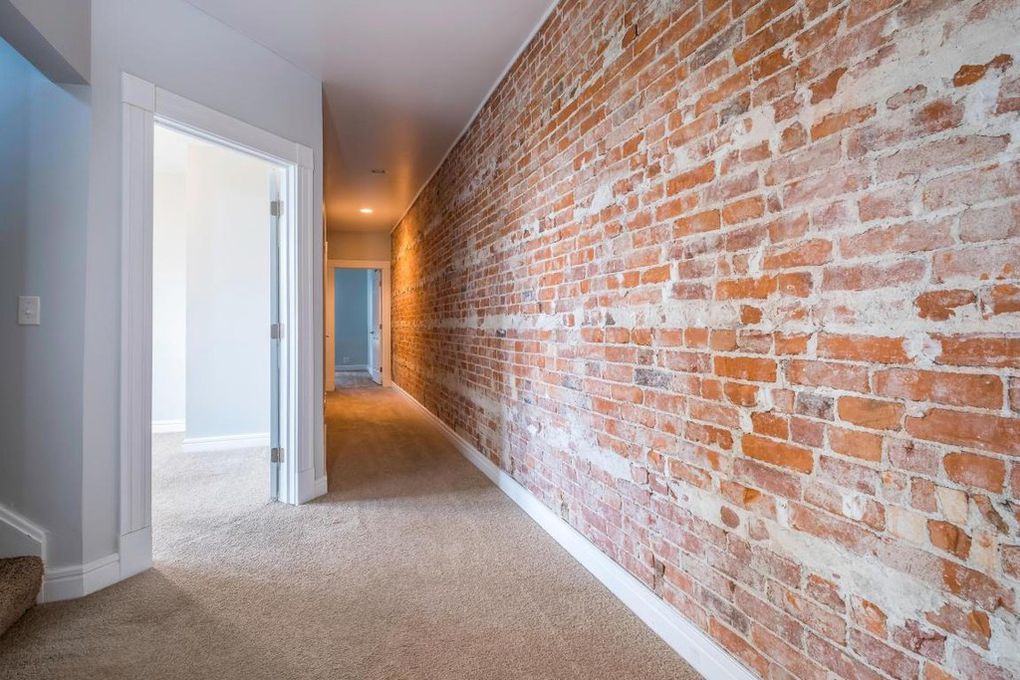
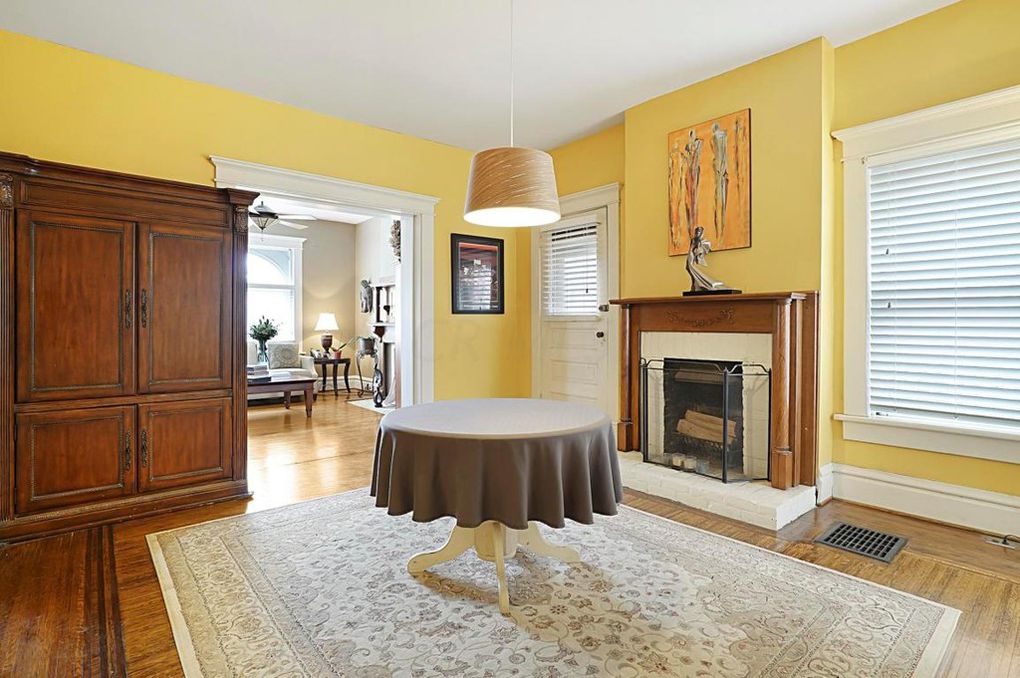
The renovation is not necessarily bad, but you get the feeling that the owner thought exposing brick somehow equals an appreciation for character. Instead, because the original floors, woodwork, doors, mantles, etc. have all been replaced, removed or covered up, it comes off less as a historic home, but more of an industrial loft that you might find Downtown. This is typical of the vast majority of renovations in the neighborhood. Historic character is an afterthought.
55 Hoffman Avenue
This early 1900s home has a unique exterior that was changed little between 2010 and 2018, other than receiving a new paint job and landscaping.
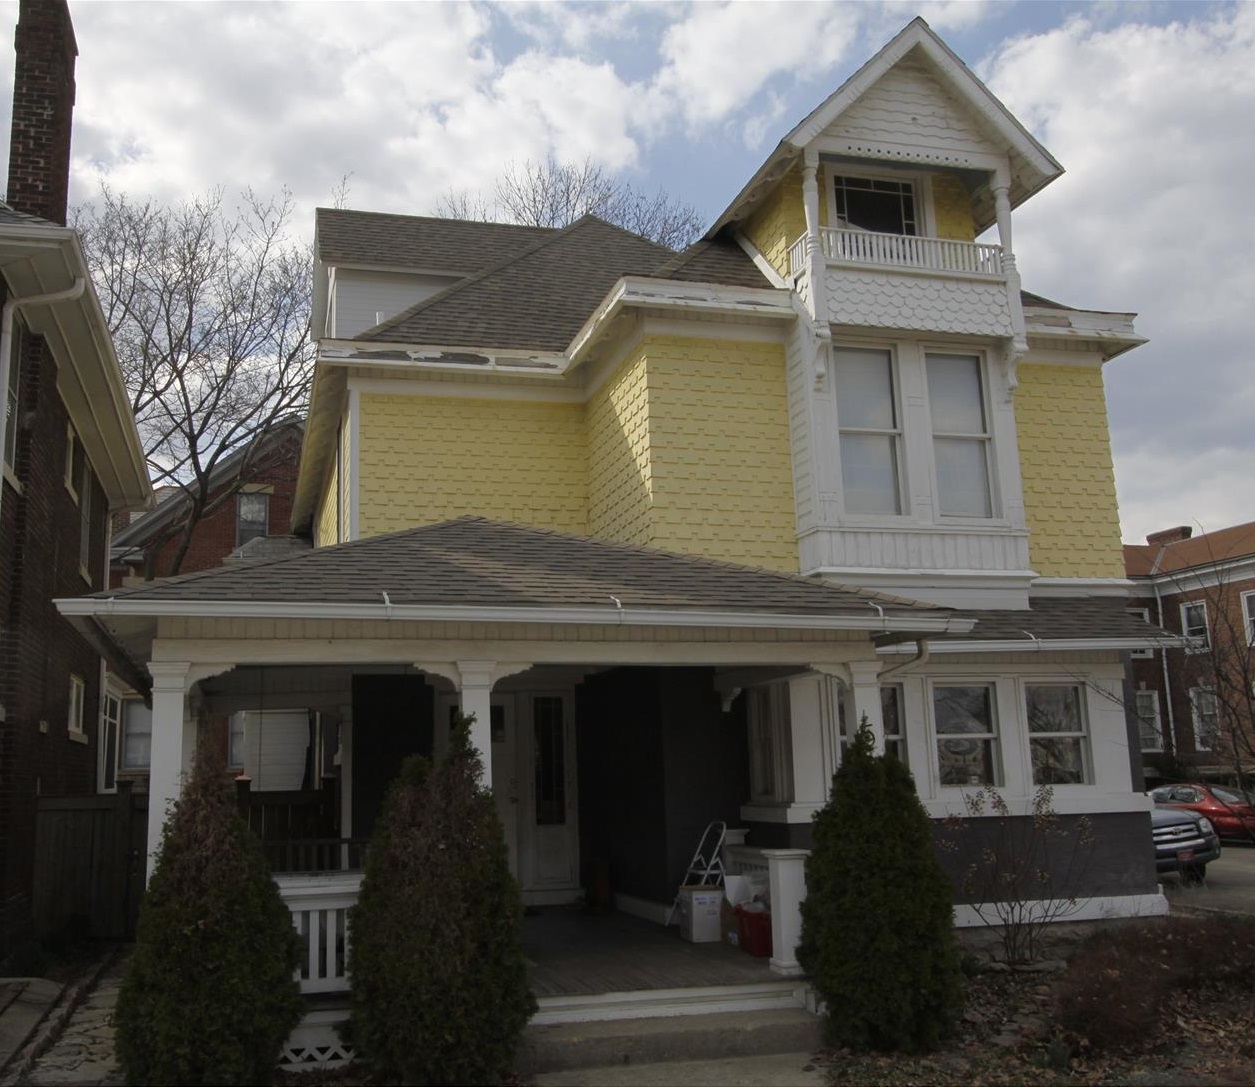
Photo taken in 2010.
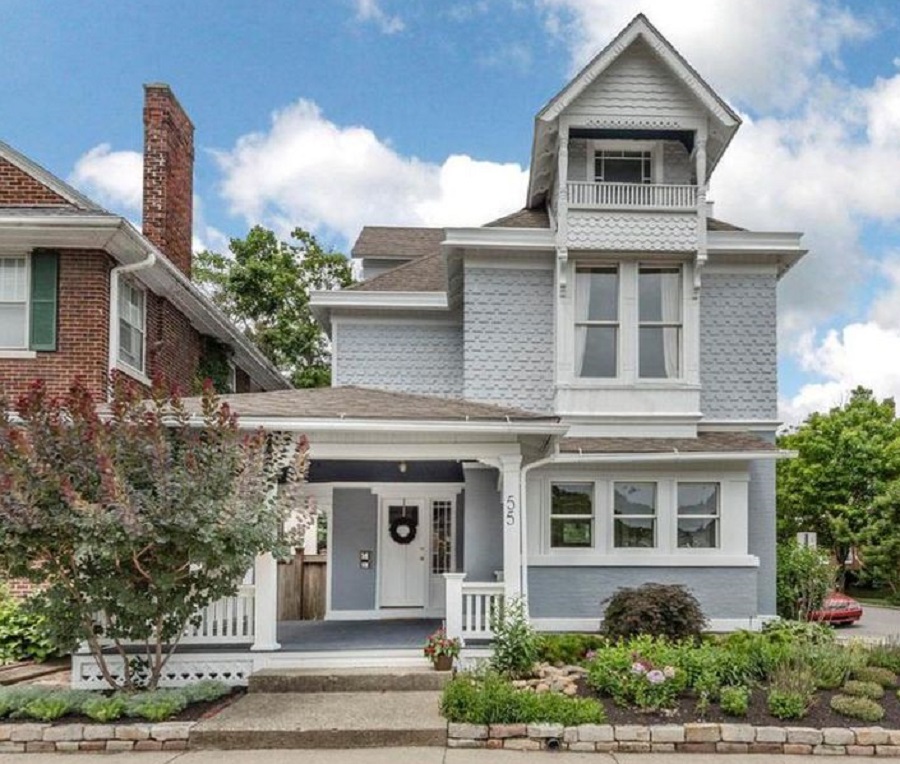
Photo taken in 2018.
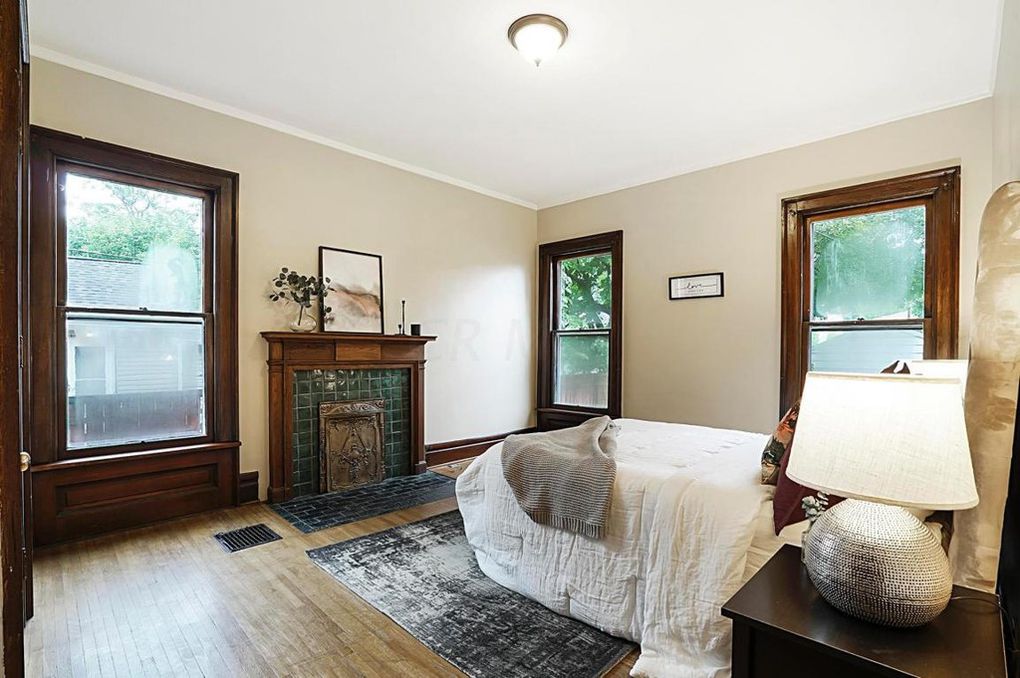
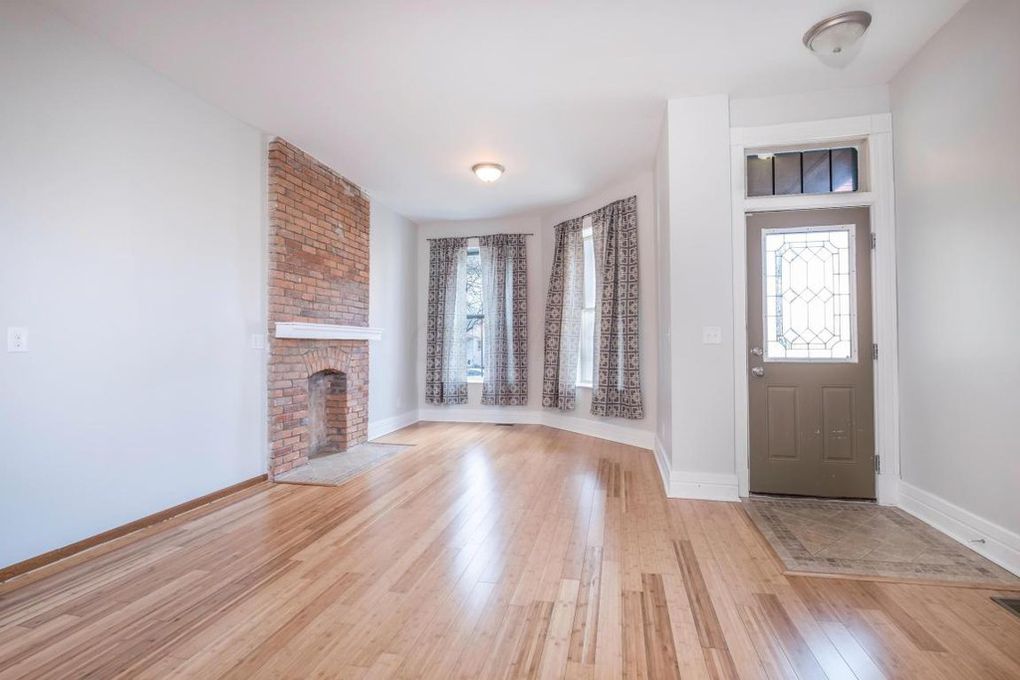
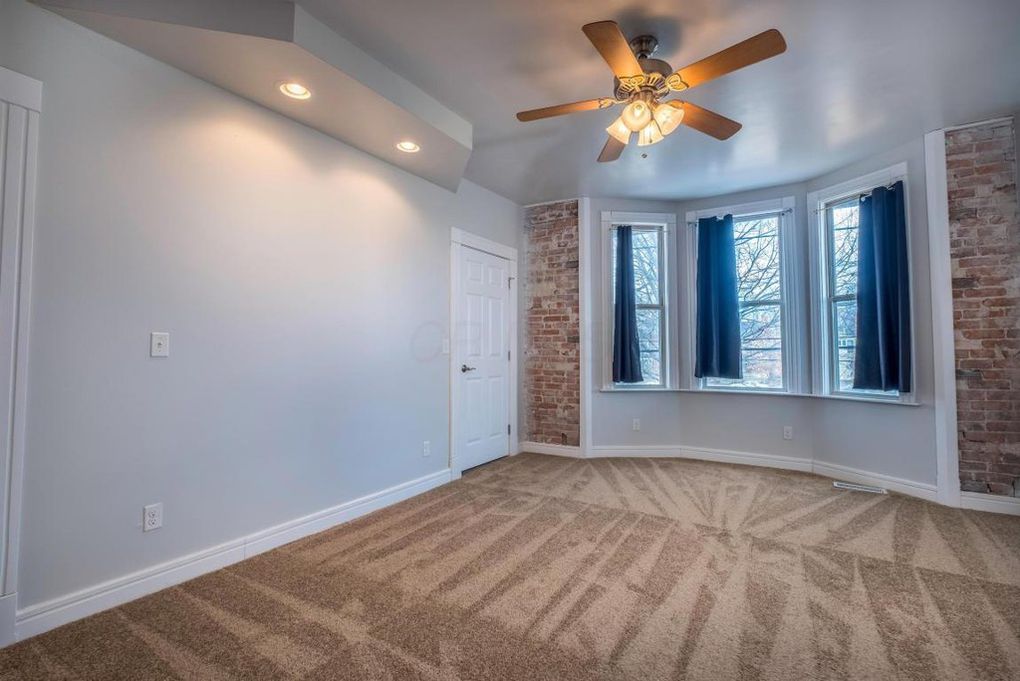
Inside the changes have been more drastic.
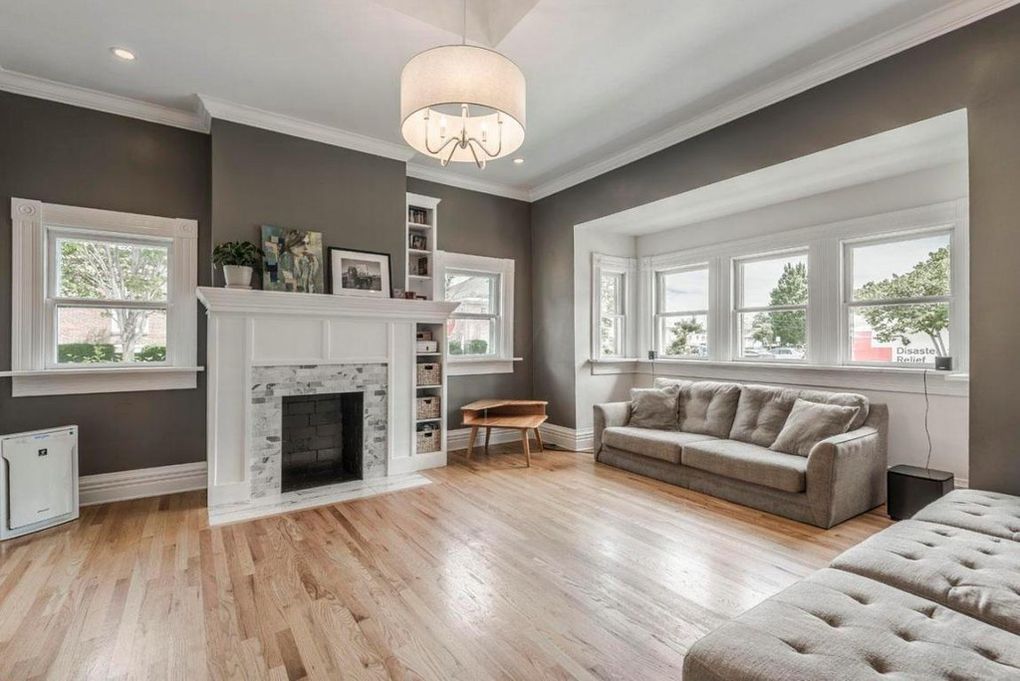
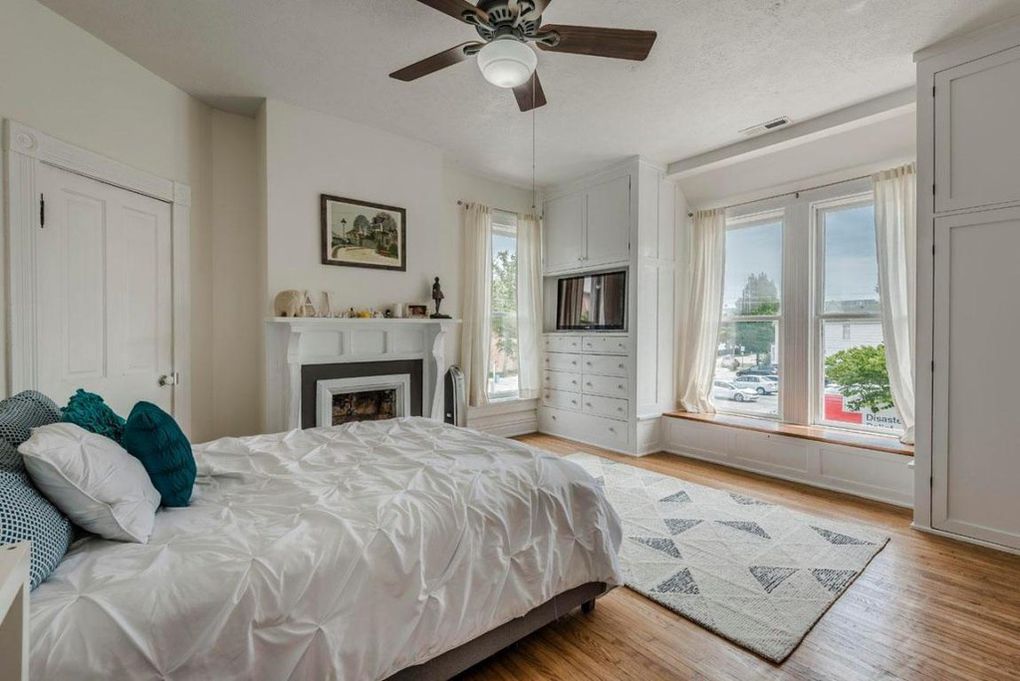
I feel like this renovation is somewhat a transition between the first set of homes and the 240 S. 18th example. The renovation is much more extensive than the first set, but not quite as bad as 240 S. 18th. However, it shows the popular use of whitewashing everything to make the interiors look modern. The historic character that remains is mostly maintained due to the configuration of walls, windows and woodwork rather than anything specific about decoration or color choices.
The 2 homes above are not the worst, in that they maintain at least some historic elements even if they might have gone a little too far in the modern updating. The next examples are the Frankenstein monsters of the group, where the renovations basically gutted every last historic detail of the interiors, and even significantly altered the exteriors.
422 South Ohio Avenue
This late 1890s home was in very bad condition in 2010, as the photo shows The house had completely lost its original front porch, windows were missing and the home was a candidate for demolition.
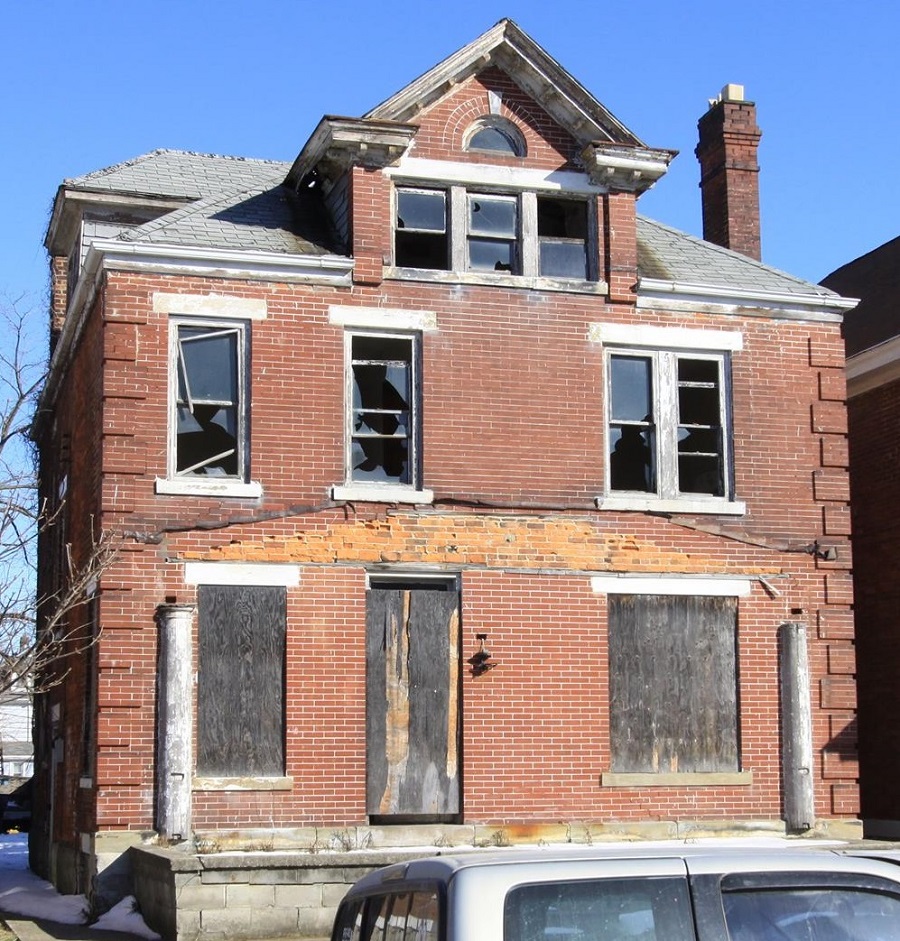
Photo taken in 2010.
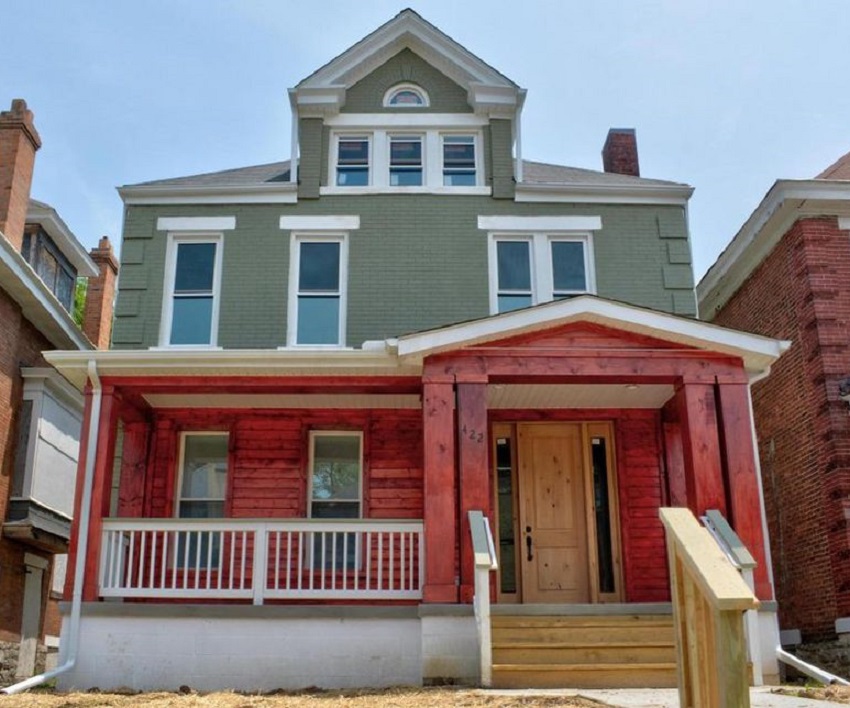
Photo taken in 2018.
What?? The new porch looks like something taken from some mountain retreat with its oversized wooden beams. It looks completely inappropriate to the home. Yes, the house needed a new porch, but come on. It’s not only the wrong architecture, the color scheme clashes and comes across as tacky.
The interiors are even worse, as they do not even try to match the exterior style.
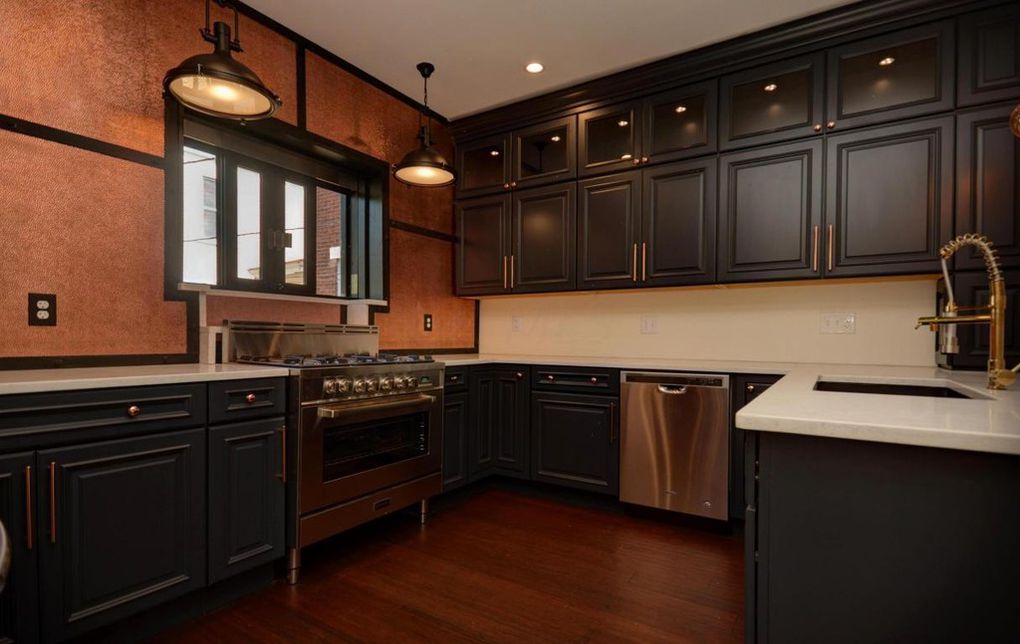
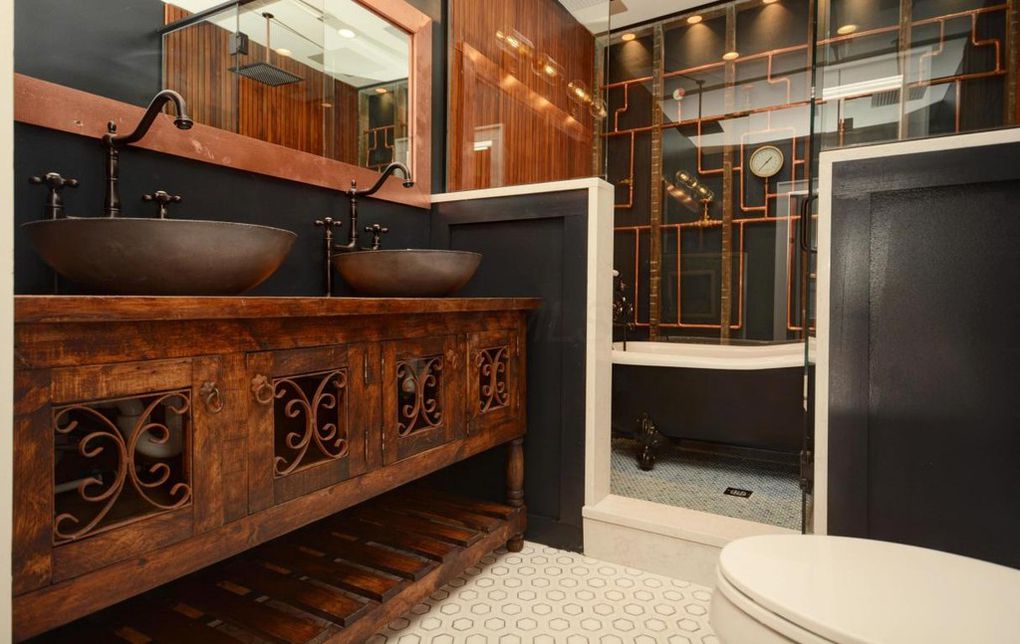
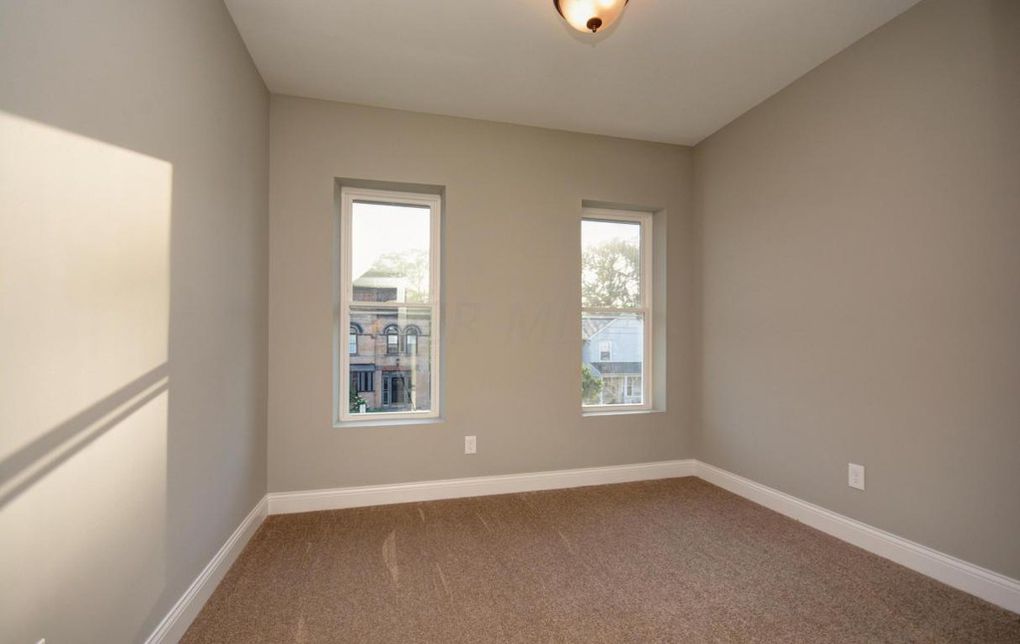
This looks like something from a Tim Burton movie. Some rooms are heavily industrial and quirky, others are featureless and bland. A few even manage to maintain a some historical elements. Now, given the poor state of this home several years ago, the interiors were probably heavily damaged and it was likely a blank slate. This design reeks of someone who didn’t quite know how to create a cohesive look, though.
505 Linwood Avenue
Now, this is not an old home, as it was built in 2017. Therefore, this is not a case of renovation or restoration at all. However, it falls into the Frankenstein category for simply not keeping with the architecture of the neighborhood at all.
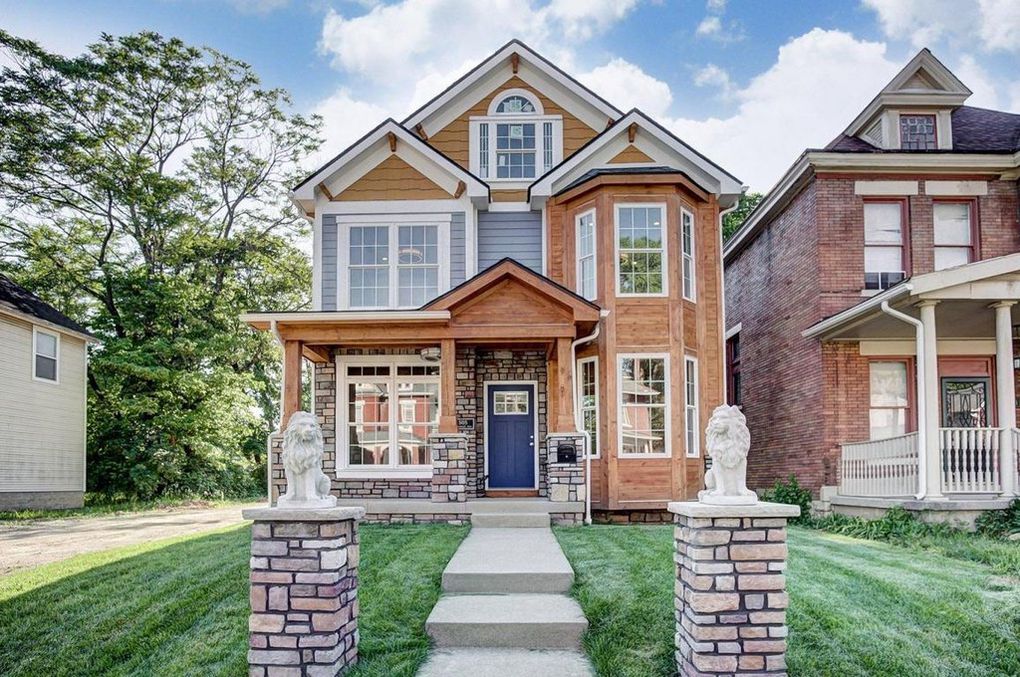
Photo taken in 2017.
So what’s the style of this? It has some design elements of historic homes, like the punched out windows, but the exterior once again is designed like some kind of modern cabin. And then you have those ridiculous lion columns.
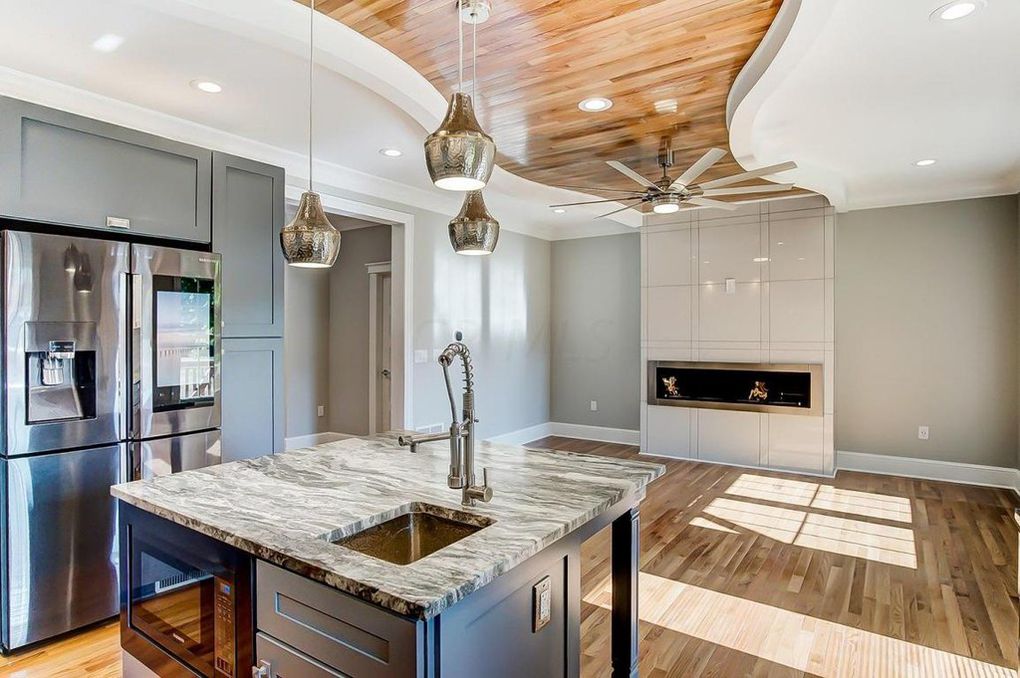
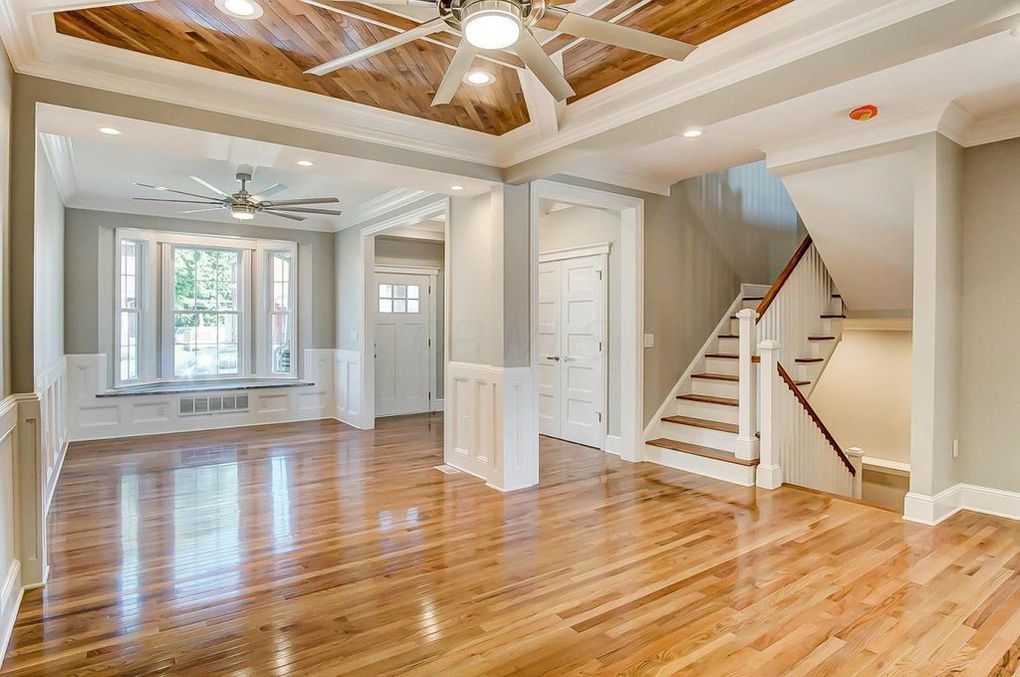
I honestly don’t hate the interior. It has a unique, interesting design to it. It just doesn’t seem to go with the outer look at all, and the whole thing seems so random.
Luckily, the last 2 examples are not the norm, but the rare exception. Still, the fact that most homes fall into the 2nd category is not encouraging. Many people may find no issue in that group. Most of the renovations aren’t distasteful exactly, but to me, something is being lost. Trying to turn these homes into the equivalent of a loft apartment rather than appreciating the elegance that a historic home offers misses the point of owning an old home. Once those original details are lost, they’re never coming back.