The city and area may have its first accumulating snow this evening into Sunday, according to the Wilmington National Weather Service. Some may think that it’s a bit early for this to be happening, but in fact, there have been many years with far earlier first snowfalls. So what exactly were the earliest first snows in Columbus?
The earliest recorded measurable snowfall in Columbus occurred on October 10, 1906. A strong cold front brought rain on the 9th that changed to snow showers during the early morning hours of the 10th. The snow only amounted to 0.1″, but it was enough to be counted as officially the earliest measurable snowfall on record.
So the first traces of snow have occurred nearly a full month and a half prior to today’s date. In 2014, the first trace of snow occurred just a few weeks after the end of summer!
The average first snow in Columbus is typically between the 2nd and 3rd week of November, so really, this year’s first snow is arriving more or less right on schedule. Accumulations are predicted to be 1″ or less. Historic climatology records are available for all periods.
Today’s Spring 2021 weather review shows that the season represented a significant departure from other recent years in that it was drier than average. In fact, there were fewer measurable precipitation days during the season than any other spring since 1879. Snowfall was also well below normal aside from a rare late April event. Temperatures swung wildly, with highs generally well above normal and lows slightly below normal.
1991-2020 Spring Normals Average High: 63.1 Average Low: 42.2 Mean: 52.7 Precipitation: 11.46″ Snowfall: 4.6″
2021 March-May Average High: 65.2 9th Warmest Average Low: 42.0 Tied for 29th Warmest Mean: 53.6 +0.9 20th Warmest Precipitation: 9.59″ 62nd Driest Snowfall: 1.2″ Ties for 12th Least Snowiest Average Daily Snow Depth: 0.0″ Largest Snowstorm: 1.2″ on April 21st # of 32 or Below Highs: 0 Tied for 1st Fewest # of 32 or Below Lows: 20 Tied for 12th Fewest # of 80 or Above Highs: 14 Tied for 12th Most # of 70 or Above Lows: 0 Tied for 1st Fewest # of Measurable Precipitation Days: 27 1st Fewest on Record # of Measurable Snowfall Days: 1 Tied for 2nd Fewest
Average High By Month March 2021: 59.0 7th Warmest April 2021: 64.4 Tied for 29th Warmest May 2021: 72.1 Tied for 44th Coldest
Average Low By Month March 2021: 34.7 27th Warmest April 2021: 42.0 Tied for 35th Warmest May 2021: 49.2 27th Coldest
Mean By Month March 2021: 46.9 12th Warmest April 2021: 53.2 Tied for 28th Warmest May 2021: 60.6 Tied for 32nd Coldest
Precipitation By Month March 2021: 2.85″ 54th Driest April 2021: 3.28″ 60th Wettest May 2021: 3.46″ 61st Driest
Snowfall By Month March 2021: 0.0″ Tied for Least Snowy April 2021: 1.2″ 14th Least Snowy May 2021: 0.0″ Tied for Least Snowy- Only a handful of years have had a trace or more of snow in May.
Average Snow Depth By Month March 2021: 0.0″ April 2021: 0.0″ May 2021: 0.0″
Maximum High By Month March 2021: 75 on the 24th April 2021: 83 on the 27th May 2021: 91 on the 25th
Minimum High By Month March 2021: 40 on the 15th April 2021: 37 o the 1st Mays 2021: 51 on the 9th
Maximum Low By Month March 2021: 56 on the 11th April 2021: 65 on the 28th May 2021: 69 on the 24th
Maximum Low Records -The 65 on April 28th tied the record for the date with 1914.
Minimum Low By Month March 2021: 19 on the 5th April 2021: 21 on the 2nd May 2021: 34 on the 1st
Highest Daily Precipitation By Month March 2021: 1.12″ on the 18th April 2021: 1.88″ on the 29th May 2021: 1.43″ on the 9th
Precipitation Records -The 1.88″ on April 29th was a record for the date, beating the old record of 1.82″ set in 1996. -The 1.43″ on May 9th was a record for the date, beating the old record of 1.12″ set in 1909.
Highest Daily Snowfall By Month March 2021: 0.0″ April 2021: 1.2″ on the 21st May 2021: 0.0″
Deepest Snow Depth By Month March 2021: 0.0″ April 2021: 1″ on the 21st May 2021: 0.0″
What are the worst heat waves in history? The climate in Ohio is gradually getting warmer and wetter, and persistent record heat is becoming ever more common, but do recent heatwaves compare to those of the past? Let’s find out.
To find out what the worst heatwaves were, I looked at average temperatures for different consecutive time periods- 2 days, 3 days, 7 days, 10 days, 14 days and 30 days. Unsurprisingly, some historically hot summers popped up, particularly from the 1930s.
Top 10 2-Day Periods with the Warmest Average High Temperature 1. 7/21-7/22/1934: 104.5 2. 7/20-7/21/1934, 7/8-7/9/1936, 7/11-7/12/1936, 7/13-7/14/1936: 103.5 3. 7/24-7/25/1934, 7/25-7/26/1934, 7/9-7/10/1936: 103.0 4. 7/3-7/4/1911, 8/5-8/6/1918, 7/10-7/11/1936: 102.5 5. 7/9-7/10/1881, 7/12-7/13/1936: 102.0 6. 7/3-7/4/1897, 7/21-7/22/1901, 6/27-6/28/1944: 101.5 7. 7/6-7/7/2012: 101.0 8. 7/8-7/9/1881, 7/4-7/5/1911, 6/28-6/29/1934, 7/14-7/15/1936: 100.5 9. 7/7-7/8/1881, 8/6-8/7/1918, 7/20-7/21/1930, 7/26-7/27/1941, 7/7-7/8/1988, 7/8-7/9/1988, 7/15-7/16/1988: 100.0 10. 7/10-7/11/1881, 7/17-7/18/1887, 7/2-7/3/1911, 8/4-8/5/1918, 7/19-7/20/1930, 7/26-7/27/1936, 9/1-9/2/1953, 9/2-9/3/1953, 7/13-7/14/1954, 8/3-8/4/1955, 7/5-7/6/2012: 99.5
Top 10 3-Day Periods with the Warmest Average High Temperature 1. 7/20-7/22/1934, 7/9-7/11/1936, 7/12-7/14/1936: 103.3 2. 7/24-7/26/1934, 7/8-7/10/1936, 7/10-7/12/1936, 7/11-7/13/1936: 102.7 3. 7/8-7/10/1881: 101.3 4. 7/2-7/4/1911, 8/5-8/7/1918, 7/21-7/23/1934, 7/7-7/9/1936: 101.0 5. 7/3-7/5/1911, 7/13-7/15/1936: 100.7 6. 7/7-7/9/1881, 7/10-7/12/1881, 8/4-8/6/1918: 100.3 7. 7/9-7/11/1881, 7/23-7/25/1934, 7/7-7/9/1988, 7/5-7/7/2012: 100.0 8. 7/3-7/5/1897, 7/19-7/21/1934, 7/22-7/24/1934, 7/4-7/6/2012: 99.7 9. 7/6-7/8/1881, 7/19-7/21/1930, 9/1-9/3/1953: 99.3 10. 7/26-7/28/1941, 6/26-6/28/1944, 8/30-9/1/1953, 8/31-9/2/1953, 8/2-8/4/1955, 7/6-7/8/1988: 99.0
Top 10 7-Day Periods with the Warmest Average High Temperature 1. 7/8-7/14/1936: 103.1 2. 7/9-7/15/1936: 102.1 3. 7/20-7/26/1934, 7/7-7/13/1936: 101.7 4. 7/10-7/16/1936: 100.7 5. 7/19-7/25/1934, 7/11-7/17/1936: 100.3 6. 7/6-7/12/1881, 7/6-7/12/1936: 100.0 7. 7/21-7/27/1934: 99.4 8. 7/7-7/13/1881: 99.1 9. 7/5-7/11/1881: 99.0 10. 7/4-7/10/1881, 8/28-9/3/1953: 98.6
Top 10 10-Day Periods with the Warmest Average High Temperature 1. 7/8-7/17/1936: 101.0 2. 7/7-7/16/1936: 100.8 3. 7/6-7/15/1936: 100.2 4. 7/9-7/18/196: 99.8 5. 7/5-7/14/1936: 99.2 6. 7/4-7/13/1881: 98.0 7. 7/10-7/19/1936: 97.9 8. 7/3-7/12/1881: 97.8 9. 7/5-7/14/1881, 7/17-7/26/1934, 7/18-7/27/1934, 7/19-7/28/1934: 97.7 10. 7/6-7/15/1881: 97.4
Top 10 14-Day Periods with the Warmest Average High Temperature 1. 7/5-7/18/1936, 7/6-7/19/1936: 97.9 2. 7/4-7/17/1936: 97.6 3. 7/7-7/20/1936: 97.5 4. 7/3-7/16/1936: 97.1 5. 7/8-7/21/1936: 96.5 6. 7/2-7/15/1936: 96.0 7. 7/2-7/15/1881, 7/4-7/17/1881, 7/9-7/22/1936: 95.6 8. 7/13-7/26/1934: 95.5 9. 7/14-7/27/1934, 7/15-7/28/1934, 7/1-7/14/1936: 95.4 10. 7/16-7/29/1901, 7/17-7/30/1901: 95.1
Top 10 30-Day Periods with the Warmest Average High Temperature 1. 6/29-7/28/1936: 92.7 2. 6/28-7/27/1936: 92.6 3. 6/27-7/26/1934: 92.5 4. 6/26-7/25/1934, 6/30-7/29/1936: 92.3 5. 6/28-7/27/1934: 92.2 6. 7/6-8/4/1936, 7/13-8/11/1955: 92.1 7. 7/10-8/8/1955, 6/28-7/27/2012: 92.0 8. 6/25-7/24/1934, 6/27-7/26/1936, 7/1-7/30/1936, 7/2-7/31/1936, 7/5-8/3/1936, 7/7-8/5/1936, 7/14-8/12/1955, 6/27-7/26/2012: 91.9 9. 6/29-7/28/1934, 6/26-7/25/1936, 7/3-8/1/1936, 7/4-8/2/1936, 7/8-8/6/1955, 7/9-8/7/1955, 6/18-7/17/2012, 6/20-7/19/2012: 91.8 1. 6/25-7/24/1936, 7/23-8/21/1955: 91.7
The heat waves in 1934 and 1936 dominated for high temperatures, and for the most part, nothing before or since has really come close. 1881, 1901, 1918, 1955 and 2012, among others, all make appearances.
Now that we’ve see the worst periods for high temperature, let’s look at the worst for the mean temperature, which is the average between the high and low. Because this measurement includes the low temperatures, it could be considered the definitive look at what the absolute hottest heat waves in history really were.
Top 10 2-Day Periods with the Warmest Average Temperature 1. 7/21-7/22/1934: 92.0 2. 7/9-7/10/1881: 91.5 3. 7/9-7/10/1936: 90.5 4. 7/20-7/21/1934: 90.3 5. 7/25-7/26/1934, 7/13-7/14/1936: 90.0 6. 7/10-7/11/1881, 7/3-7/4/1911: 89.8 7. 8/5-8/6/1918, 7/20-7/21/1930: 89.3 8. 7/10-7/11/1936: 89.0 9. 7/4-7/5/1911, 7/24-7/25/1934, 7/12-7/13/1936, 7/30-7/31/1999: 88.8 10. 7/11-7/12/1881, 8/6-8/7/1918, 7/8-7/9/1936, 7/11-7/12/1936: 88.5
Top 10 3-Days Periods with the Warmest Average Temperature 1. 7/20-7/22/1934: 90.5 2. 7/8-7/10/1881: 90.3 3. 7/9-7/11/1881: 90.0 4. 7/10-7/12/1881, 7/9-7/11/1936: 89.8 5. 7/12-7/14/1936: 89.5 6. 7/21-7/23/1934: 89.3 7. 7/7-7/9/1881: 89.0 8. 8/5-8/7/1918, 7/24-7/26/1934, 7/8-7/10/1936, 7/10-7/12/1936: 88.8 9. 7/11-7/13/1936: 88.7 10. 7/3-7/5/1911, 7/13-7/15/1936: 88.5
Top 10 7-Day Periods with the Warmest Average Temperature 1. 7/8-7/14/1936, 7/9-7/15/1936: 89.1 2. 7/6-7/12/1881: 89.0 3. 7/20-7/26/1934: 88.9 4. 7/7-7/13/1881: 88.6 5. 7/5-7/11/1881, 7/10-7/16/1936: 87.9 6. 7/19-7/25/1934: 87.7 7. 7/8-7/14/1881: 87.6 8. 7/21-7/27/1934: 87.5 9. 7/7-7/13/1936: 87.4 10. 7/4-7/10/1881: 86.9
Top 10 10-Day Periods with the Warmest Average Temperature 1. 7/8-7/17/1936: 87.4 2. 7/7-7/16/1936: 87.2 3. 7/5-7/14/1881, 7/6-7/15/1881, 7/9-7/18/1936: 87.1 4. 7/4-7/13/1881: 86.9 5. 7/6-7/15/1936, 7/7-7/16/1881: 86.6 6. 7/3-7/12/1881: 86.2 7. 7/19-7/28/1934: 86.0 8. 7/18-7/27/1934, 7/10-7/19/1936: 85.7 9. 7/20-7/29/1934, 7/5-7/14/1936: 85.6 10. 7/8-7/17/1881, 7/17-7/26/1934: 85.4
Top 10 14-Day Periods with the Warmest Average Temperature 1. 7/3-7/16/1881, 7/4-7/17/1881: 85.1 2. 7/6-7/19/1936: 85.0 3. 7/5-7/18/1936: 84.9 4. 7/7-7/20/1936: 84.6 5. 7/2-7/15/1881, 7/5-7/18/1881, 7/4-7/17/1936: 84.5 6. 7/3-7/16/1936: 84.3 7. 7/6-7/19/1881, 7/8-7/21/1936, 7/18-7/31/1940: 83.9 8. 7/13-7/26/1934, 7/14-7/27/1934, 7/15-7/28/1934: 83.8 9. 7/2-7/15/1936: 83.7 10. 7/1-7/14/1881: 83.6
1934 and 1936 still dominate, but other years show up more often as well. Only 2012 shows up with anything in the last 60 years, though. That year also saw one of the worst wind events in Ohio history, partially fueled by the heat of that summer: North American Derecho of 2012
Finally, let’s look at periods that featured consecutive days with highs of 90 degrees or higher. What are the longest?
# of Consecutive Days with Highs 90 or Above 1. 7/3-7/16/1881: 14 2. 7/18-7/30/1940: 13 3. 6/24-7/5/1934, 7/7-7/18/1936, 6/28-7/9/1949, 7/21-8/1/1999, 6/29-7/10/2020: 12 4. 7/20-7/30/1901, 8/4-8/14/1918, 8/25-9/4/1953, 8/8-8/18/1988, 6/28-7/8/2012: 11 5. 7/27-8/5/1887, 9/7-9/16/1897, 7/29-8/7/1955, 6/13-6/22/1994: 10
A short video and article from 2016 about the 1936 heatwave, still the hottest in history. 1936 Heat Wave
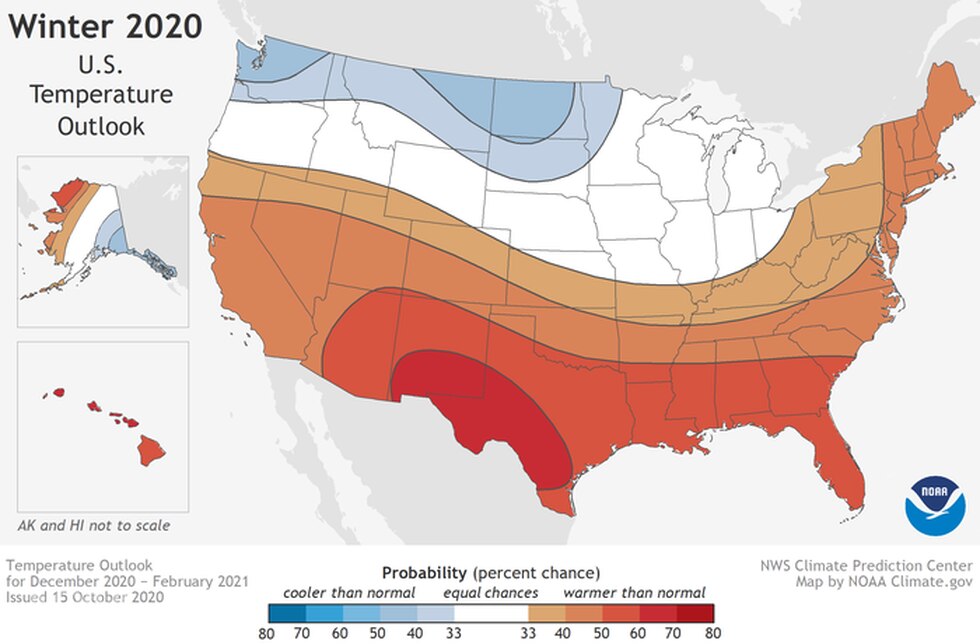
The NOAA temperature outlook for winter 2020-2021.
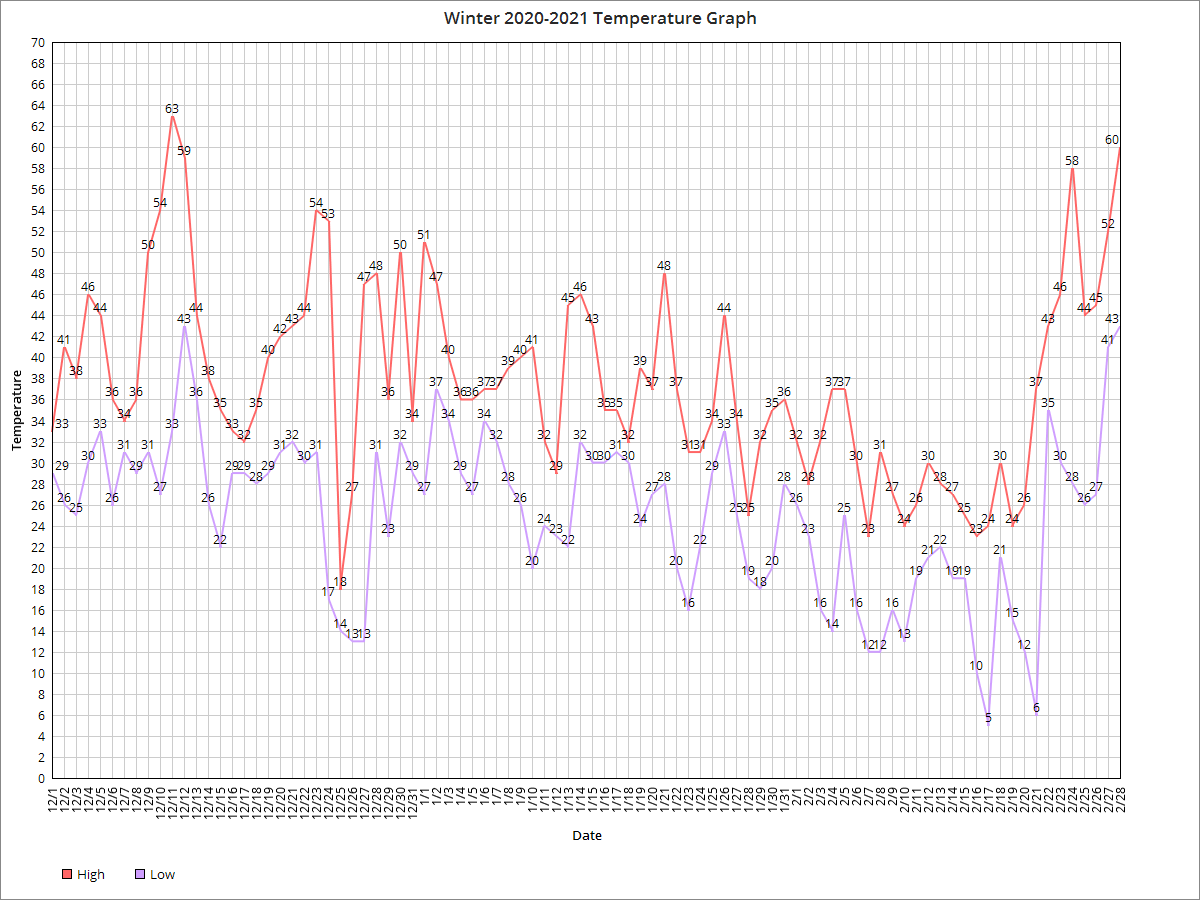
The Winter 2020-2021 Review is the latest edition in the series. Overall, December and February brought some of the worst winter weather Columbus had seen in several years. Meanwhile, January and March were unusually quiet. Temperatures through January were fairly to slightly above average, while February was well below normal. March and April provided little winter weather, and March had no snowfall whatsoever.
Let’s break the winter down.
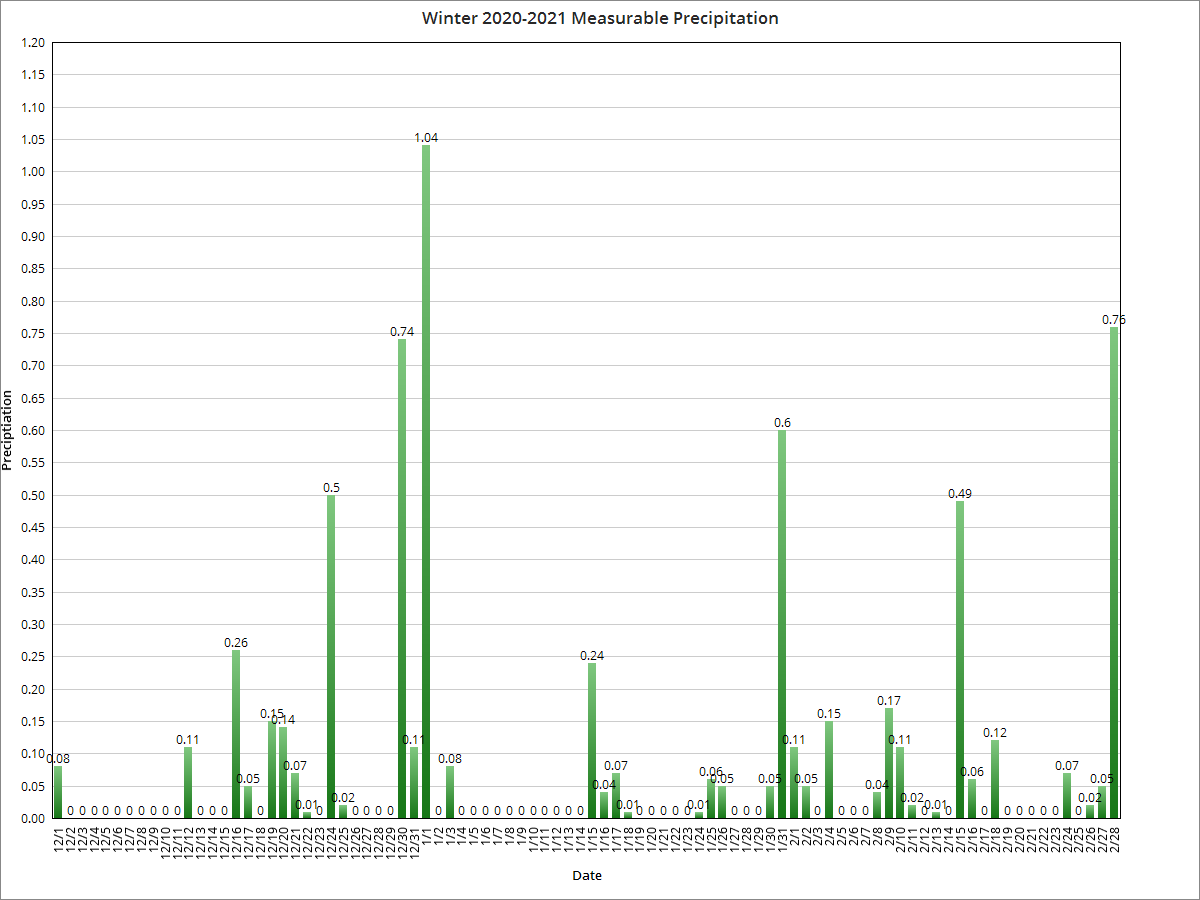
December-February Only Average High: 37.8 42nd Coldest Average Low: 25.1 34th Warmest Mean: 31.4 42nd Warmest Precipitation: 6.72″ 38th Driest Snowfall: 24.7″ 31st Snowiest Average Daily Snow Depth: 1.0″ 15th Highest Largest Snowstorm: 5″ on 1/30-2/1/2021. This was a long-duration storm that moved only very slowly through the region. # of 32 or Below Highs: 28 22nd Most # of 32 or Below Lows: 79 10th Most # of Measurable Precipitation Days: 38 14th Fewest # of Measurable Snowfall Days: 23 14th Most
Overall, winter 2020-21 was somewhat average- not too cold, not too warm, not too wet, not too dry, not too snowy, but not snowless.
Entire Cold Season: October-April Average High: 51.2 15th Warmest Average Low: 33.6 22nd Warmest Mean: 42.4 15th Warmest Precipitation: 20.39″ 56th Wettest Snowfall: 27.8″ 43rd Snowiest Average Snow Depth: 0.4″ 5th Lowest Largest Snowstorm: 5″ on 1/30-2/1/2021 # of 32 or Below Highs: 28 18th Fewest # of 32 or Below Lows: 107 27th Most # of Measurable Precipitation Days: 76 11th Fewest # of Measurable Snowfall Days: 25 16th Fewest
The overall cold season was generally warm, but still managed to provide near normal to slight above normal snowfall for the region.
Average High By Month October 2020: 63.3 31st Coldest November 2020: 57.6 8th Warmest December 2020: 41.5 38th Warmest January 2021: 37.5 49th Warmest February 2021: 33.9 20th Coldest March 2021: 59.0 7th Warmest April 2021: 64.4 29th Warmest
Average Low By Month October 2020: 45.6 35th Warmest November 2020: 37.3 18th Warmest December 2020: 27.7 36th Warmest January 2021: 26.6 22nd Warmest February 2021: 20.4 35th Coldest March 2021: 34.7 27th Warmest April 2021: 42.0 35th Warmest
Mean By Month October 2020: 54.5 38th Coldest November 2020: 47.4 10th Warmest December 2020: 34.6 36th Warmest January 2021: 32.1 39th Warmest February 2021: 27.2 30th Coldest March 2021: 46.9 12th Warmest April 2021: 53.2 28th Warmest
Precipitation By Month October 2020: 4.19″ 16th Wettest November 2020: 3.35″ 45th Wettest December 2020: 2.24″ 44th Driest January 2021: 2.25″ 50th Driest February 2021: 2.23″ 64th Wettest March 2021: 2.85″ 54th Driest April 2021: 3.28″ 60th Wettest
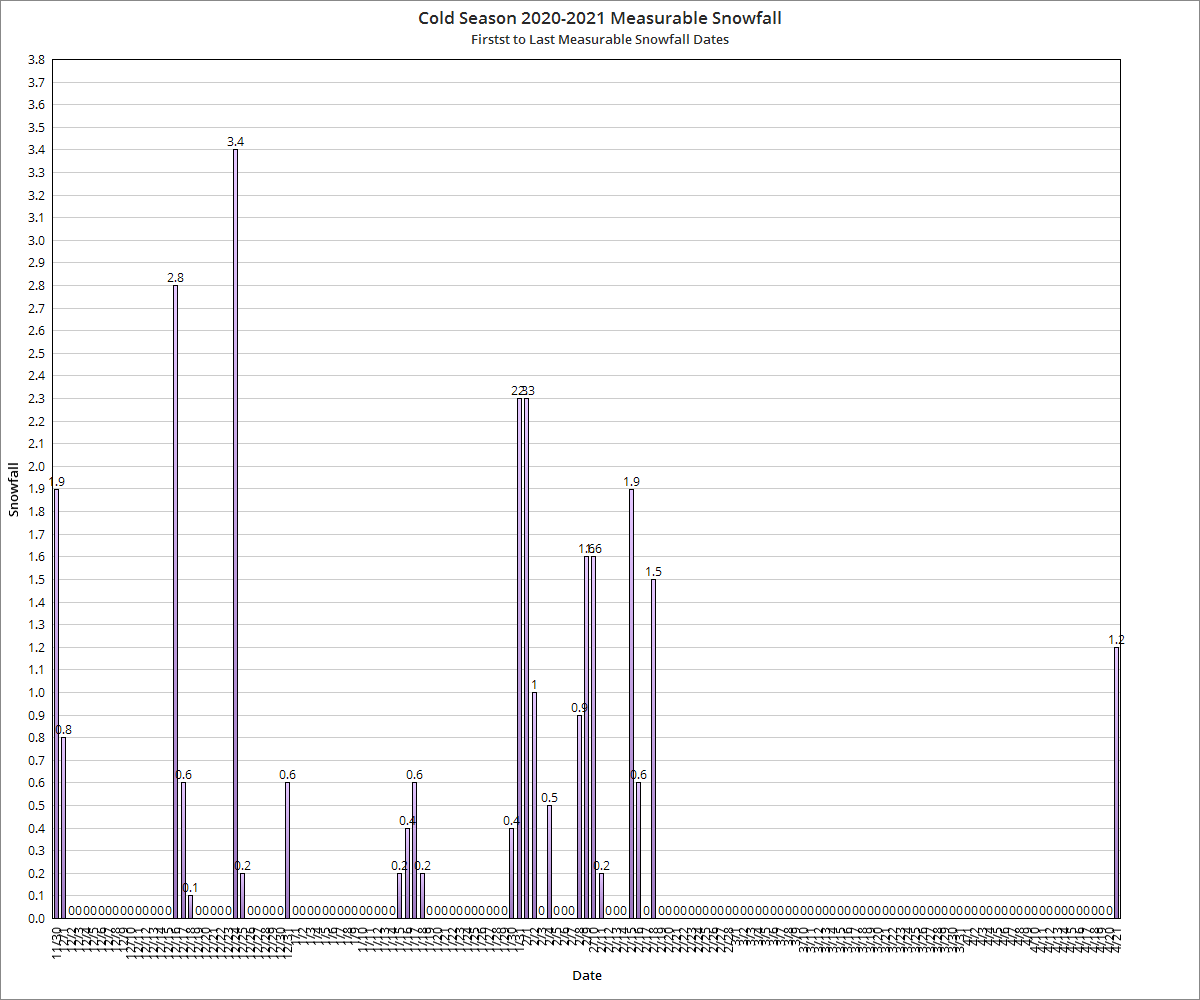
Snowfall By Month October 2020: 0.0″ Tied for Least Snowy November 2020: 1.9″ 21st Least Snowy December 2020: 8.5″ 22nd Snowy January 2021: 4.1″ 29th Least Snowy February 2021: 12.1″ 15th Snowiest March 2021: 0.0″ Tied for Least Snowy April 2021: 1.2″ 14th Least Snowy
March’s lack of snowfall tied the record for the only time in history the month did not even have a trace of snowfall.
Average Snow Depth By Month October 2020: 0.0″ November 2020: 0.0″ December 2020: 0.7″ January 2021: 0.1″ February 2021: 2.4″ March 2021: 0.0″ April 2021: 0.0″
Maximum High By Month October 2020: 80 on the 22nd November 2020: 78 on the 8th and 10th December 2020: 63 on the 11th January 2021: 51 on the 1st February 2021: 60 on the 28th March 2021: 75 on March 24th April 2021: 83 on April 27th
Maximum High Records -78 on November 8th was a record high for the date, beating the old record of 74 set in 1945. -76 on November 9th tied the daily record high with 1975. -78 on November 10th was a record high for the date, beating the old record of 72 set in 1949.
Minimum High By Month October 2020: 48 on the 30th November 2020: 43 on the 18th December 2020: 18 on the 25th January 2021: 25 on the 28th February 2021: 23 on the 7th and 16th March 2021: 40 on the 15th April 2021: 37 o the 1st
Maximum Low By Month October 2020: 62 on the 11th November 2020: 55 on the 10th December 2020: 43 on the 12th January 2021: 37 on the 2nd February 2021: 43 on the 28th March 2021: 56 on the 11th April 2021: 65 on the 28th
Maximum Low Records -The 65 on April 28th tied the record set in 1914.
Minimum Low By Month October 2020: 30 on the 31st November 2020: 25 on the 18th December 2020: 13 on the 26th and 27th January 2021: 16 on the 23rd February 2021: 5 on the 17th March 2021: 19 on the 5th April 2021: 21 on the 2nd
Highest Daily Precipitation By Month October 2020: 1.25″ on the 29th November 2020: 0.89″ on the 25th December 2020: 0.74″ on the 30th January 2021: 1.04″ on the 1st February 2021: 0.76″ on the 28th March 2021: 1.12″ on the 18th April 2021: 1.88″ on the 29th
Precipitation Records -0.76″ on February 28th was the record for the date, beating the old record of 0.56″ set in 1954. -The 1.88″ on April 29th was a record for the date, beating the old record of 1.82″ set in 1996.
Highest Daily Snowfall By Month October 2020: 0.0″ November 2020: 1.9″ on the 30th December 2020: 3.4″ on the 24th January 2021: 2.3″ on the 31st February 2021: 2.3″ on the 1st March 2021: 0.0″ April 2021: 1.2″ on the 21st
Snowfall Records -2.8″ on December 16th was a record for the date, beating the old record of 1.8″ set in 1953. -3.4″ on December 24th was a record for the date, beating the old record of 2.7″ set in 1980.
Deepest Snow Depth By Month October 2020: 0″ November 2020: 0″ December2020: 4″ on the 26th January 2021: 3″ on the 31st February 2021: 5″ on the 18th-21st March 2021: 0.0″ April 2021: 1″ on the 21st
Much to the potential annoyance of many, parts of Ohio- including Columbus are predicted to see a late-season snowfall Tuesday night into Wednesday morning. As late as it may seem, Columbus has seen even later season snowfalls since 1878. Though rare, these events do happen, and have sometimes been significant.
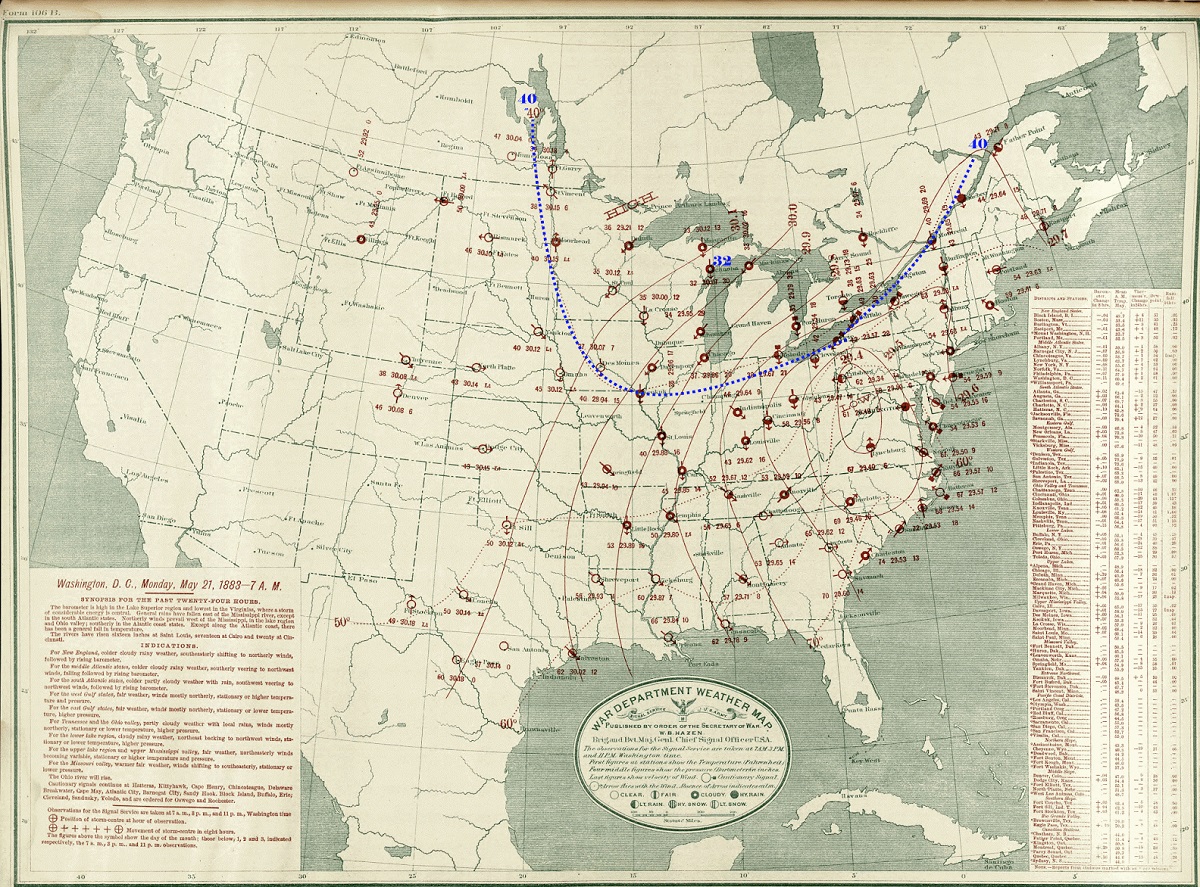
The US weather map on the morning of May 21, 1883.
The absolute latest measurable snow occurred on May 21st, 1883, when 0.4″ fell. The amount was not impactful, but the date certainly was. People are normally thinking about summer by then, but instead got a nasty taste of winter. The present-day I-71 corridor in the state generally had had an inch or less- Cincinnati had upwards of 2″, with 3″ near Hamilton. However, areas just to the north and west were hammered with the heaviest May snow ever recorded.
An excerpt from the book “Thunder in the Heartland” by Thomas W. Schmidlin: “A drizzling rain on Monday morning, 21 May, turned to snow at 9AM, and the air was filled with large, damp flakes all day. The Sidney Journal reported that ‘though it thawed, it lay six inches deep on Tuesday morning.’ Considering that much of the snow melted as it fell, a total of fifteen to twenty inches was estimated for Sidney. Snow depts of ten inches were measured on the north side of buildings at Houston in Shelby County.”
The Columbus Dispatch reported that snow fell in every major city from Lancaster north and west. Crops and trees were damaged by the heavy, wet snow across Western Ohio during the event. Temperatures at most locations were at or above freezing during the snow, so it did not stick around long after. Just 3 days later, it hit 80 degrees in Columbus.
Dates of Measurable Snowfalls After April 15th 1. May 21, 1883: 0.4″ 2. May 9, 1923: 0.3″ 3. May 7, 1989: 0.8″ 4. April 30, 1908: 2.4″ 5. April 24, 2005: 3.0″ 6. April 22, 1893: 0.8″ 6. April 22, 1901: 0.1″ 7. April 21, 1934: 0.4″ 7. April 21, 1936: 0.2″ 7. April 21, 1953: 0.2″ 8. April 20, 1910: 2.4″ 8. April 20, 1962: 0.1″ 9. April 19, 1887: 0.1″ 9. April 19, 1907: 0.4″ 9. April 19, 1969: 0.5″ 9. April 19, 2019: 0.3″ 10. April 18, 1983: 0.1″ 10. April 18, 1984: 0.3″ 11. April 17, 1961: 1.0″ 11. April 17, 2001: 0.6″ 12. April 16, 1935: 0.4″ 12. April 16, 1956: 0.3″ 12. April 16, 1996: 0.1″
Trace amounts have occurred many additional times after April 15th, including into early May. Measurable snow, however, has only occurred 23 times after April 15th since 1878. So snow after that date has occurred roughly once out of every 6.2 years. That rate is not going to be matched this time, as measurable snow fell on April 19th last year. Snow is predicted sometime tomorrow night, the 20th. If it ends up being measurable, it would fall into the tie of 8th latest such ever recorded.