I talked about housing permits before- almost a decade ago now- and thought it would be a good time to update and expand the information. The following graphs detail Columbus area housing permits as they pertain to new residential units being permitted for construction.
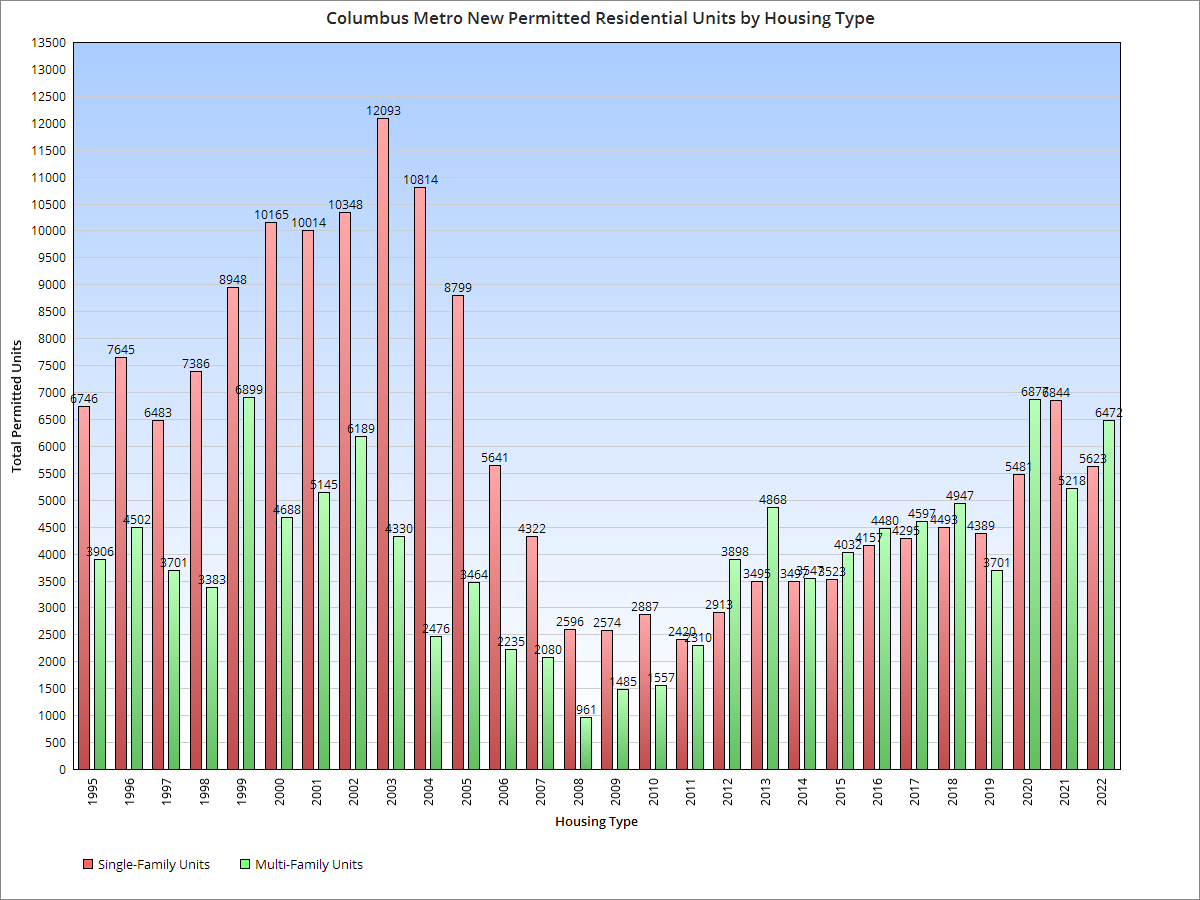
Up first, the below graph shows all permitted units by type for the entire metro area since 1995. What most stands out about the graph is how single-family construction dominated until the late 2000s. When the Great Recession hit, it completely changed that dynamic. Since then, multi-family units have mostly been on top in most years, perhaps because more money could be made with them with less financial risk.
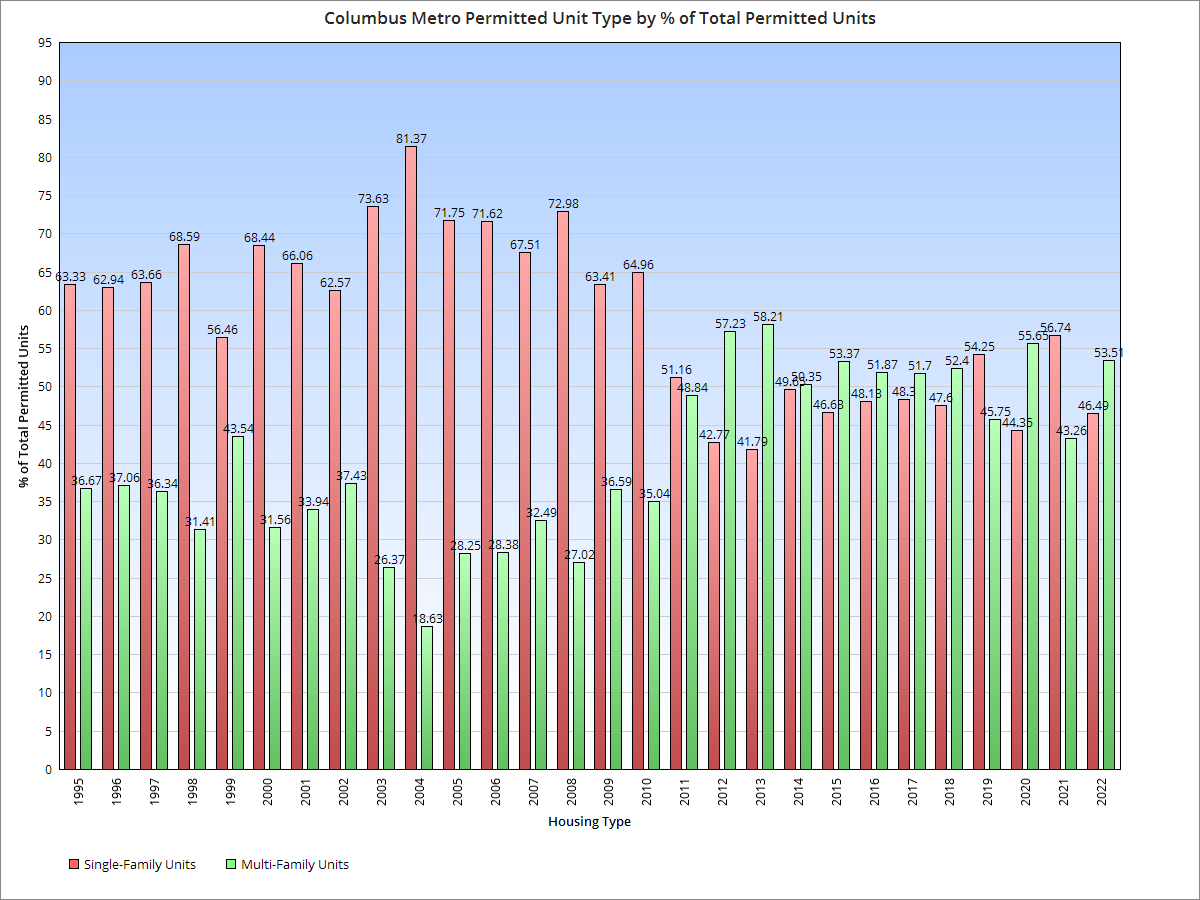
Here is the permitted housing type as a % of total permitted units. Between 1995-2010 the average breakdown was 67.46% Single-Family and 32.54% Multi-Family. Since 2010, the breakdown has been 48.16% Single-Family and 51.84% Multi-Family, representing a full 38.6-point margin change towards Multi-Family.
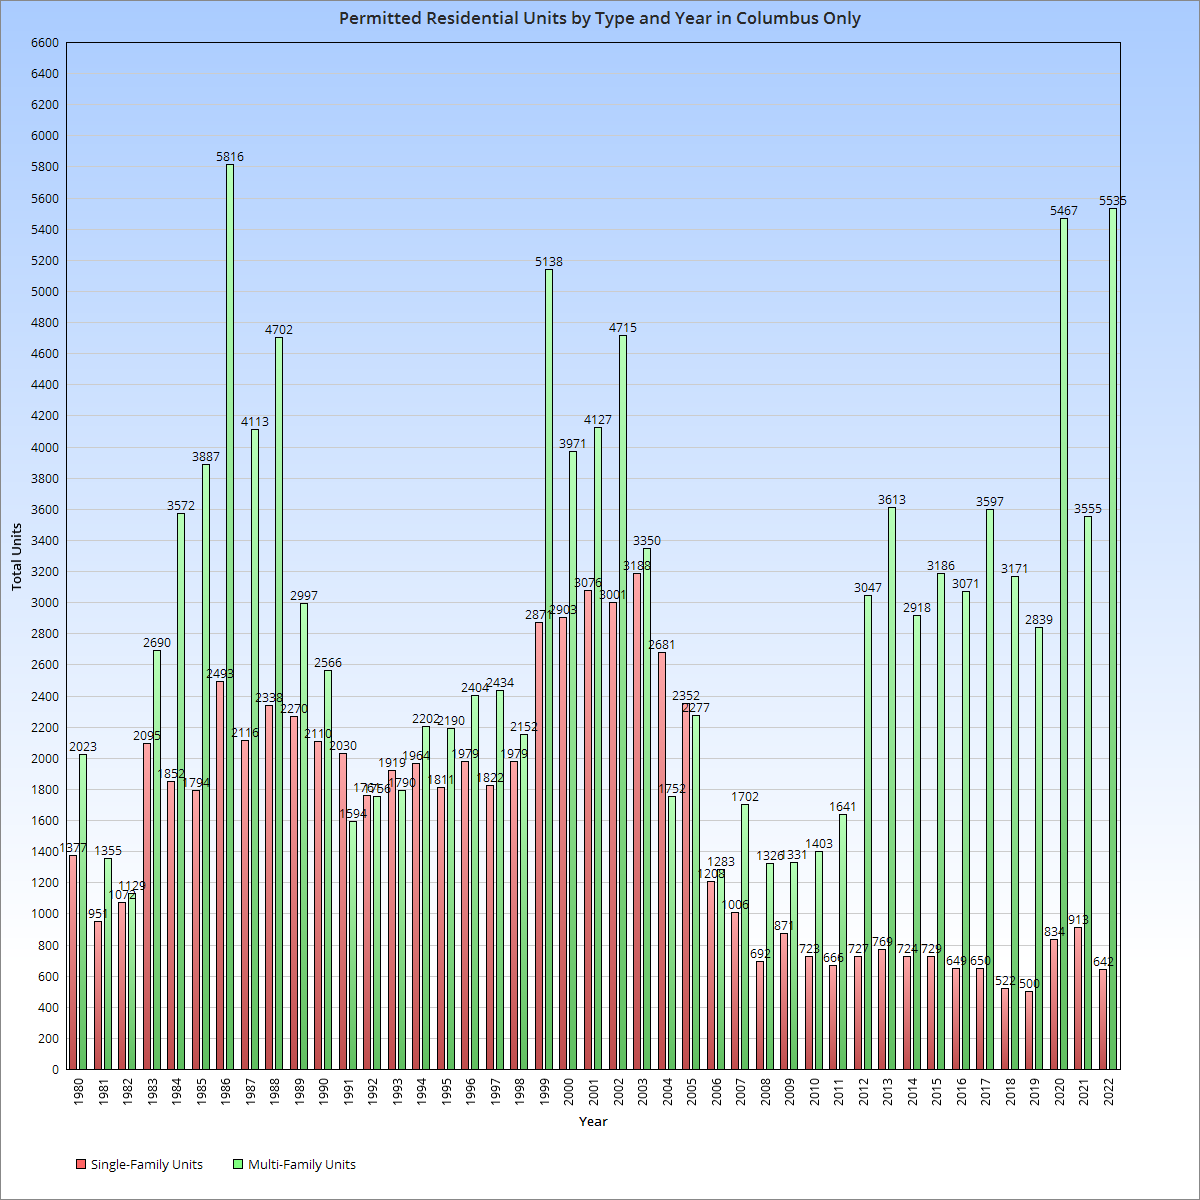
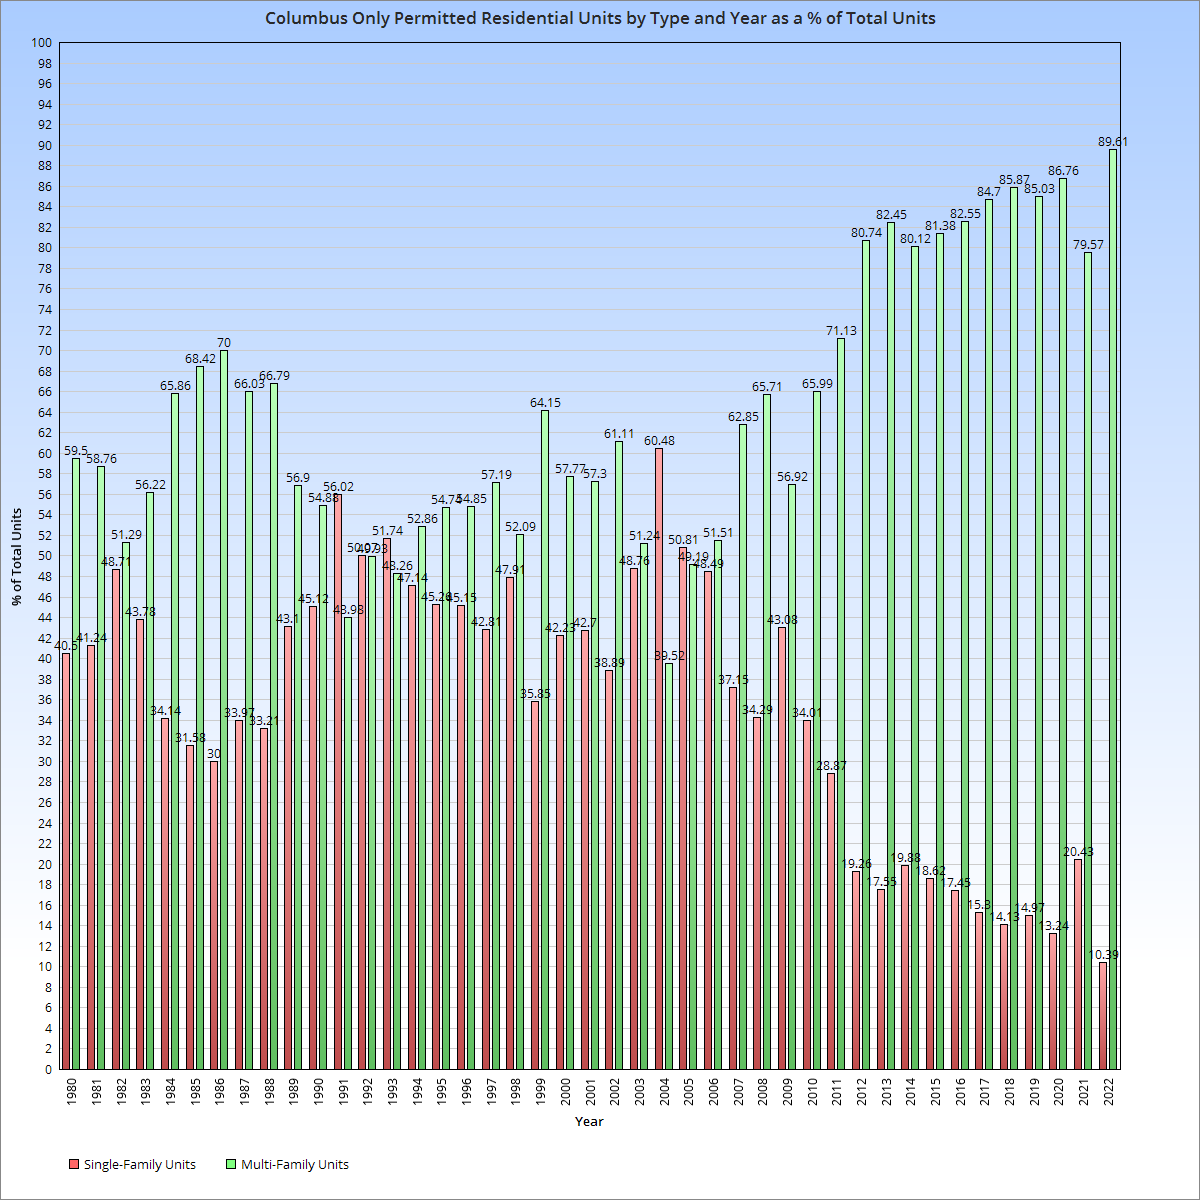
But what about what is actually getting permitted within just the city of Columbus, rather than the entire metro? City-exclusive data is available going back to 1980. The city experienced the same shift as the overall metro, but much more drastically.
The % of total units by type for the city shows that single-family housing has been steadily becoming a smaller part of new construction permits since around 2003.
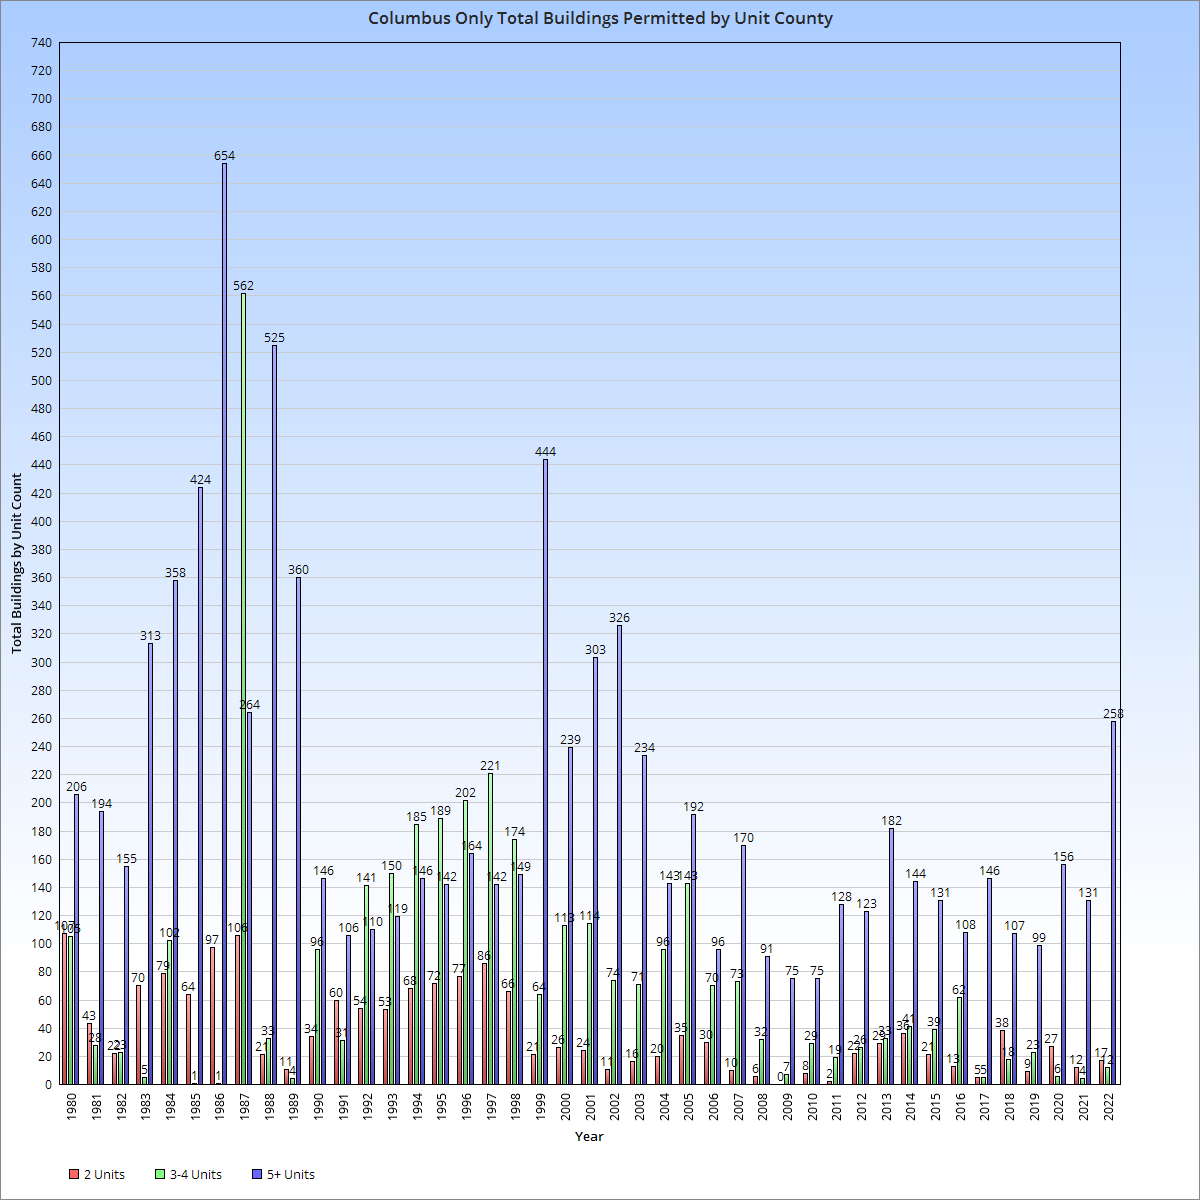
Finally, let’s break down multi-family permits by total number of buildings per unit count for the city only. Except for during the 1990s, 5+-unit buildings have been dominant, but it seems that fewer overall buildings are being built despite total units being high, suggesting that project size has increased over the years.
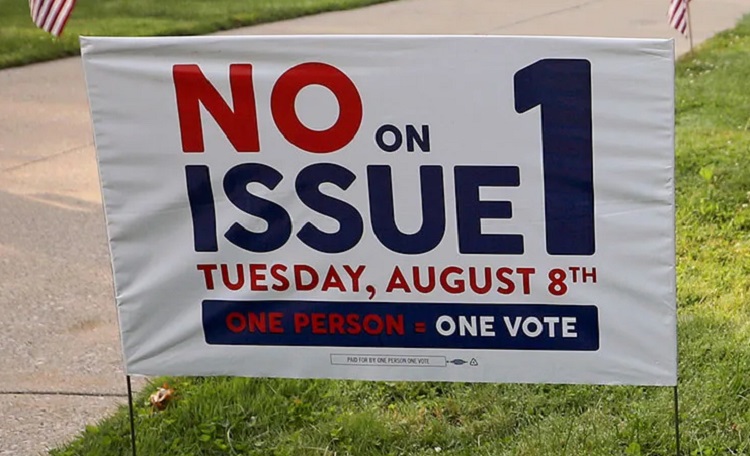
Issue 1 was a contentious, controversial proposal to make it harder for Ohioans to make changes to the state constitution. After a short campaign season, it would go on to defeat by just over 14 points- 57.01% to 42.99%. I provided a state county map with the results on the new Special Issues page. But what were the Issue 1 results in Franklin County and its precincts, specifically?
Today’s Cool Link provides the answer with a precinct map of the county. The map shows the results of Issue 1 for every single precinct, ward or city in Franklin County.
Based on the map, here were the overall margins for all the places in the county. Negative numbers are No wins, and positive numbers are Yes wins. 1. Bexley: -74.35 2. Grandview Heights: -71.19 3. Riverlea: -70.04 4. Marble Cliff: -69.02 5. Urbancrest: -64.16 6. Minerva Park: -63.1 7. Worthington: -61.94 8. Columbus: -61.8 9. Clinton Township: -58.32 10. Upper Arlington: -51.55 11. Sharon Township: -50.76 12. Mifflin Township: -46.54 13. Perry Township: -45.32 14. Whitehall: -43.97 15. Gahanna: -42.54 16. New Albany: -42.43 17. Hilliard: -41.09 18. Blendon Township: -39.79 19. Truro Township: -37.93 20. Reynoldsburg: -36.32 21. Jefferson Township: -36.29 22. Westerville: -36.0 23. Dublin: -35.71 24. Norwich Township: -27.9 25. Valleyview: -26.32 26. Canal Winchester: -18.14 27. Madison Township: -17.75 28. Groveport: -16.1 29. Obetz: -14.03 30. Grove City: -13.66 31. Prairie Township: -11.44 32. Plain Township: -9.12 33. Washington Township: -7.5 34. Franklin Township: -6.7 35. Brown Township: -2.58 36. Pleasant Township: +9.2 37. Jackson Township: +13.71 38. Hamilton Township: +15.04 As we can see, almost no part of the county voted Yes except for a few rural townships on the far south side. Not a single suburb voted yes, including in more conservative suburbs like Grove City and Canal Winchester. This suggests there was a lot of bipartisan opposition within the county.
Columbus city officials have been working on updating zoning codes for more than a year. In many cases, the codes haven’t been updated since the 1960s or earlier, when priorities were significantly different than they are now. Developers wanting to build more density in neighborhoods and even along high-traffic corridors are often forced to go through lengthy and expensive variance requests. This raises costs for projects- and ultimately rents- and prevents the necessary density to address the long-standing housing shortage. The zoning change code map link below shows the initial areas that could see updates.
The focus areas of the update- at least in the first phase, are detailed on the following map: Zoning Code Change Focus Areas
The first phase largely looks at the city’s main corridors. Later phases will look at updates in all neighborhoods. Although no specific changes have been confirmed as of yet, it’s possible that the city may do away with single-family exclusionary zoning. What this means is that, outside of historic areas, neighborhoods won’t be limited to single-family housing restrictions. Higher density projects, including doubles and multi-family projects, would be allowed in places where they are not essentially off-limits. Other changes may include reducing or eliminating parking minimums and significantly raising height restrictions.
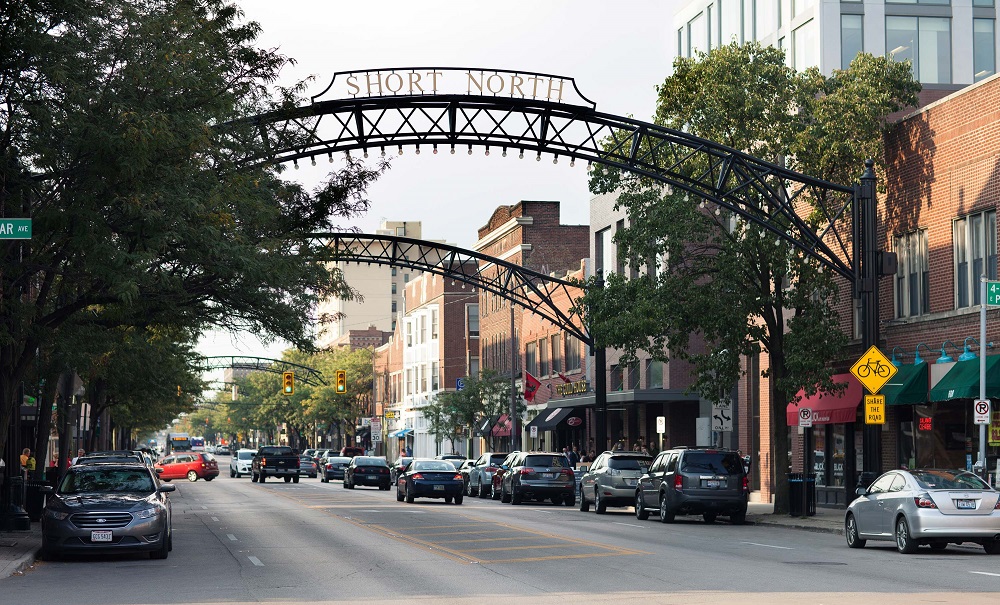
There’s been a lot of media attention to recent shootings in the Short North this year. It’s supposedly gotten so bad, that Mayor Ginther has asked local businesses in the neighborhood to close by Midnight. But has the violence really spiraled out of control, especially compared to other areas in the city. Is the Short North dangerous now? Or is the area just getting more attention due to its status as a hot neighborhood popular with locals and tourists alike?
First, let’s take a look at homicides and homicide rates across Franklin County by Census Tract. The numbers are through May 17th and the rates are total homicides divided by the 100K people per tract.
The first thing that sticks out is that the map has a whole lot of white areas, meaning most of the county and most of Columbus have seen zero homicides so far this year. The areas that have seen them do not appear to be much different than previous years- Hilltop, the Far West, the Near South, parts of Linden, and Northland. The Short North has had 1 homicide this year, which is certainly more than normal, but arguably not an epidemic even if gun violence overall is up. The other thing that sticks out is that most homicides are occurring in relatively small areas, and are often tied to certain streets or even certain businesses or residential complexes.
Using this map, we’ll next take a look at the overall homicide rates of specific neighborhoods and areas in and around Columbus to see where the whole of the Short North really ranks.
The ranking gives the neighborhood, how many tracts make it up, the 2020 population, total homicides and the homicide rate per 100,000 people. 1. Franklinton- 3 Tracts- 6,482- 3 Homicides- 46.28 Franklinton is still the most dangerous part of Columbus, and it’s really not even close. This is despite significant redevelopment in the neighborhood. 2. Near South- 13 Tracts- 35,026- 7 Homicides- 19.99 The Near South comes in a distant 2nd place. It includes a much larger area than Franklinton, but about half of the homicides occurred in the 3 tracts to the southeast of Nationwide Children’s Hospital. Places like German and Merion Village have had none. 3. Weinland Park- 2 Tracts- 6,393- 1 Homicide- 15.64 It seems a little unfair to rank Weinland Park 3rd when it’s only had a single homicide, but that’s just how the math works out. The single homicide has been lumped in with the Short North by some media, but it occurred well north across from Campus. 4. Near East- 9 Tracts- 21,841- 3 Homicides- 13.74 The Near East Side ranks 4th for the year so far. It’s been somewhat quieter than normal in this part of the city. 5. Linden- 14 Tracts- 41,627- 5 Homicides- 12.01 Similar to the Near East, Linden has been a bit more quiet than normal despite the relatively bad year Columbus is having. 5. Hilltop- 16 Tracts- 68,045- 8 Homicides- 11.76 Hilltop has had the 2nd most homicides of any of the neighborhoods looked at, but it’s also one of the largest and highest-populated as well, so the rate was lower than those above. 6. Northland- 18 Tracts- 89,165- 9 Homicides- 10.09 Northland has had the most homicides so far of any area of the city or county. Like Hilltop, however, its higher population means its rate is still relatively lower. 7. Short North- 4 Tracts- 12,472- 1 Homicide: 8.07 The Short North’s single homicide puts the neighborhood in 7th place overall. The rate itself is only slightly above that of the entirety of Columbus, so it doesn’t seem to be much of an outlier. 8. Far West- 11 Tracts- 51,308- 3 Homicides- 5.85 The Far West is the only neighborhood looked at that is entirely outside of I-270. It’s rate is only about 60% of the overall Columbus rate at this point in the year. 9. OSU Campus- 12 Tracts- 55,281- 2 Homicides- 3.62 Another large and heavily-populated area, the Campus neighborhood has been fairly safe so far this year. 10. Downtown- 5 Tracts- 12,297- 0 Homicides- 0.0 Downtown has had no homicides so far this year, a departure from last year in which it had already seen 1 at this point on its way to a total of 4 for 2022. 11. Whitehall- 8 Tracts- 23,054- 0 Homicides- 0.0 Another area I think that has had a somewhat negative reputation for crime is Whitehall, the only non-Columbus area looked at. It’s also had no homicides so far this year.
Overall, the neighborhoods above have accounted for 42 of the 65 total homicides so far this year, or about 65%. Most of the rest were very scattered.
So is the Short North dangerous? Not in terms of homicides, no, but that doesn’t mean that recent crime trends should be ignored. That said, it’s pretty clear other neighborhoods are much more deserving of attention in this regard, but may not have the economic or social clout to demand it. Of course, it also needs to be said that homicides are just a single type of crime. An examination of other types of crime may show a completely different story, but those other types rarely get the kind of breathless, hyperbolic reporting that homicides do.
Years ago- originally in 2013 and later reposted in 2016- I made a rather crude map of how I thought the Westland Mall site should be redeveloped.. It seems that the mall may finally be torn down soon after a long period of deterioration, so I figured it was time to revisit this map once more, but this time update it in detail and give a much clearer sense of how redeveloping Westland Mall would drastically change the entire West Side.
One of the problems with the original map was that it really didn’t take into account the massive size of the entire site and how many decent-sized buildings could truly fit within it. While on the old map I used single, general boxes to convey multiple buildings, this time I actually laid out nearly 50 of them. These mixed-use buildings are all a minimum of 4 stories and contain residential, office, hotel and retail/restaurant space. Each of these buildings could hold 100 or more residential units, so there could easily be several thousand new residents in this neighborhood. 3 parking garages of various sizes are also included, with enough combined space for thousands of parking spaces. The garages would mostly be covered by new walk-up condo or apartment units. A new park avenue street grid connects these garages and all other buildings, with a central roundabout plaza flanked by retail and restaurant locations. Between the streets, a series of pedestrian-only alleyways provide convenient places for outdoor patio seating for any restaurants and retail locations. One of the biggest changes on the new map is that the park space has become significantly larger, almost doubling in size to more than 18 acres. This would be a significant new park for the West Side, something this part of the city doesn’t have much of. The closest park is also fairly new- Wilson Road Park- which opened in 2017, but its out-of-the-way location makes it somewhat underused. The new Westland park would be lined with retail and restaurant space overlooking it, and a new outdoor market would sit on the northern end- perhaps another extension of North Market similar to what Bridge Park received? There are also new connections to the park and overall development. Multi-use path connections could be built on the eastern end along the old Shopper’s Lane, a western connection that travels under or over I-270 to the large residential area south of Lincoln Village, and a southern path would connect directly to the Camp Chase Trail. The old Lincoln Park West apartment complex would also have adjacent access. A rapid-transit station could go on West Broad Street in front of the entire complex as part of the LinkUS plan. Finally, another big difference between this and the old map is that I tried to be a bit less Sim City about it, meaning that I largely stuck with the existing Westland site and didn’t go beyond it. However, the light yellow areas are all potential future redevelopment locations. These areas are mostly low-density retail strip centers or big box stores with large parking lots. Over time, these areas could be redeveloped to create an enormous, 160-acre redevelopment of the Westland area. For comparison, Dublin’s Bridge Park is only about 40 acres and Jeffrey Park in Italian Village is about 42 acres, with both developments being good examples of what could be done on the Westland site. In fact, Easton is the only comparable area. The potential is incredible and would finally give West Siders the destination and transformative development they’ve been asking for.
To date, there have been no solid plans released about the future of the Westland site by its owners. However, given that they’ve already sold off a small part of the site on Broad Street for a gas station, the chances that they have any significant, urban vision for it seem to be very slim. In reality, I would expect a suburban-style apartment development with fast-food outlets and another strip retail center, adding to the car-dominated stroad hellscape that already exists on West Broad Street now. The only way to avoid that outcome is for residents to demand better.