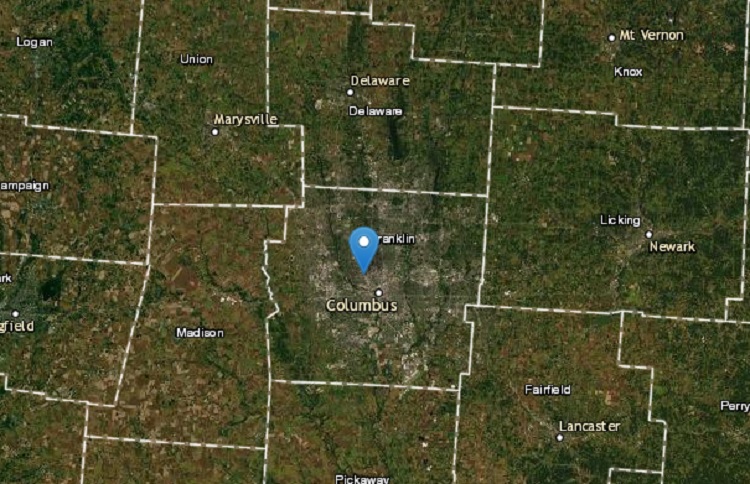
This program from the United States Geological Survey website, EarthExplorer, allows users to search information on both geological and manmade features across both the US and rest of the world. Just about every possible feature is available, from zip codes to cemeteries, bridges to waterfalls, military sites and oil fields.
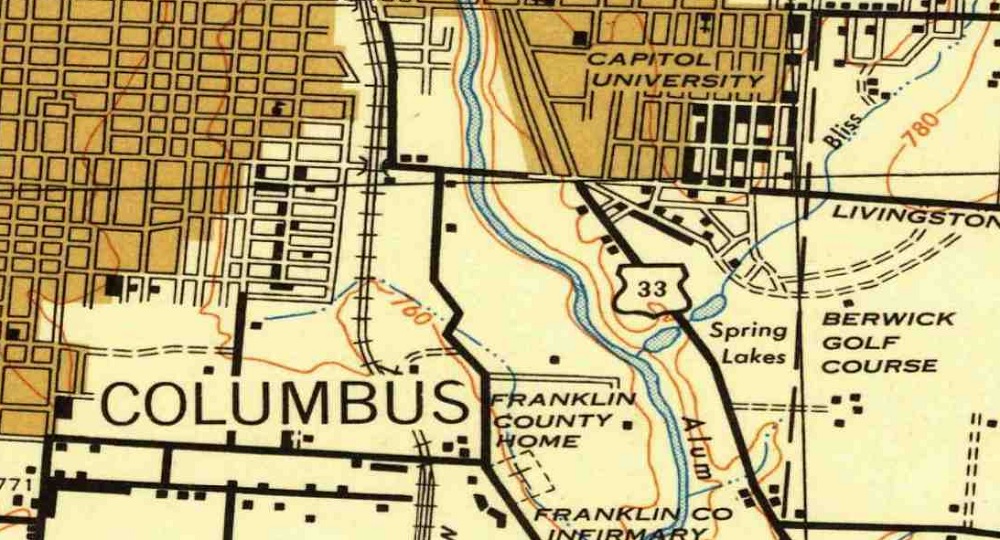
This link is a great resource to find old local maps for cities, counties and states from the US to around the world. For Columbus, maps go back to the 1920s, but other locations have even older versions. The maps are helpful for those doing research on this history of their cities.
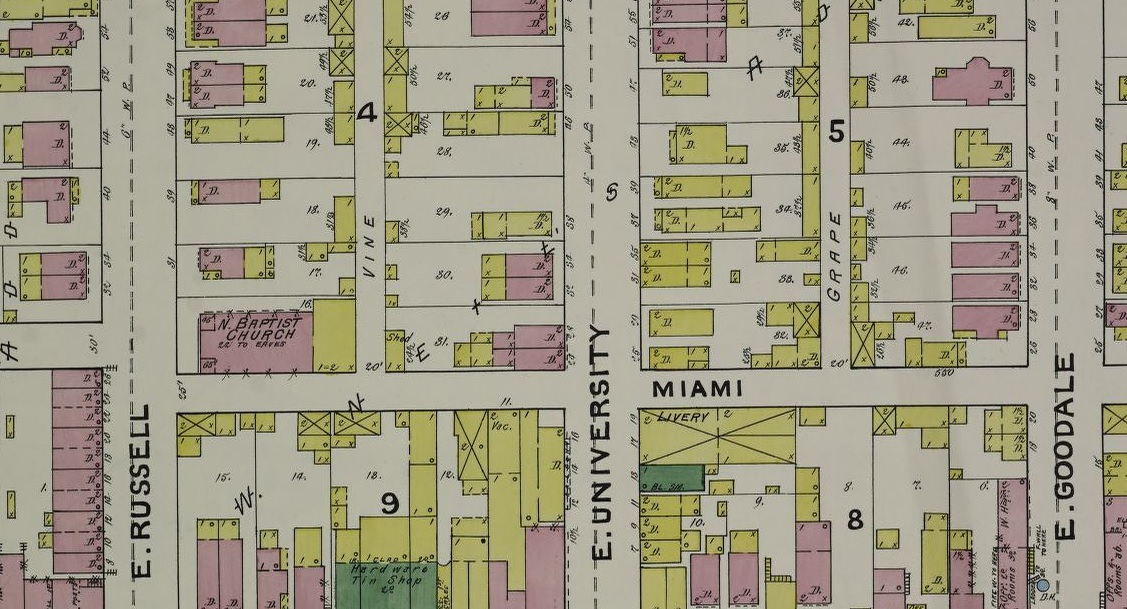
Another favorite link is the Sanborn Fire Insurance Maps. These maps are even more detailed and you can view individual buildings down to the street level back to the 19th Century. These maps are available at the Library of Congress and require a bit more searching to find what you’re looking for.
The monthly housing market update April 2021 has been released from Columbus Realtors. The results continue ongoing trends of rising prices and low supply.
Note: LSD= Local School District, CSD= City School District. In both cases, school district boundaries differ from city boundaries.
Top 15 Most Expensive Locations By Median Sales Price in April 2021 1. New Albany: $677,500 2. German Village: $570,000 3. Bexley: $527,500 4. Dublin: $514,000 5. Powell: $500,000 6. Grandview Heights: $486,000 7. New Albany Plain LSD: $469,393 8. Upper Arlington CSD: $465,008 9. Olentangy LSD: $446,575 10. Dublin CSD: $437,000 11. Buckeye Valley LSD: $425,000 12. Jonathan Alder LSD: $422,000 13. Granville CSD: $410,000 14. Worthington: $409,250 15. Short North: $405,500
New Albany continued to top the charts, and remained more than $100K over second place.
Top 15 Least Expensive Locations by Median Sales Price in April 2021 1. Newark CSD: $140,000 2. Circleville CSD: $164,900 3. Whitehall: $165,000 4. Hamilton LSD: $195,250 5. Groveport Madison LSD: $196,000 6. Jefferson LSD: $198,000 7. Lancaster CSD: $200,000 8. London CSD: $207,500 9. Columbus CSD: $217,000 10. Obetz: $225,100 11. Columbus: $228,500 12. South-Western CSD: $230,000 13. Reynoldsburg CSD: $237,900 14. Canal Winchester CSD: $245,500 15. Minerva Park: $245,551
Columbus and some of its suburbs remained relative bargains in April.
Overall Market Median Sales Price in April 2021: $251,135 The overall market is defined by Columbus Metro Area counties.
Top 15 Locations with the Highest Median Sales Price % Growth Between April 2020 and April 2021 1. German Village: +67.2% 2. Jonathan Alder LSD: +42.1% 3. Worthington: +39.3% 4. Blacklick: +38.6% 5. Buckeye Valley LSD: +36.7% 6. Powell: +33.8% 7. Teays Valley LSD: +30.6% 8. Whitehall: +29.7% 9. Worthington CSD: 26.4% 10. London CSD: +25.8% 11. Olentangy LSD: 24.7% 12. Bexley: +24.1% 13. Westerville CSD: 22.9% 14. Jefferson LSD: +21.5% 15. South-Western CSD: +21.1% 16. Marysville CSD: +20.3%
Top 15 Locations with the Lowest Median Sales Price % Growth Between April 2020 and April 2021 1. Grandview Heights: -20.4% 2. New Albany Plain LSD: -10.3% 3. Canal Winchester CSD: -8.4% 4. Downtown: -8.0% 5. Johnstown-Monroe LSD: -6.8% 6. New Albany: -6.6% 7. Lithopolis: -6.3% 8. Newark CSD: -2.1% 9. Big Walnut LSD: +0.3 10. Circleville CSD: +0.6% 11. Granville CSD: +1.4% 12. Reynoldsburg CSD: +2.9% 13. Pataskala: +5.0% 14. Minerva Park: +5.8% 15. Gahanna Jefferson CSD: +6.4%
Urban areas generally improved significantly over earlier in the year. Downtown was still down, but by less than in previous months, so it seems the urban market is now well underway with a recovery.
Overall Market Median Sales Price % Change April 2021 vs. April 2020: +13.8%
Top 10 Locations with the Most New Listings in April 2021 1. Columbus: 1,328 2. Columbus CSD: 917 3. South-Western CSD: 197 4. Westerville CSD: 182 5. Olentangy LSD: 177 6. Hilliard CSD: 171 7. Dublin CSD: 153 8. Worthington CSD: 108 9. Pickerington LSD: 105 10. Grove City: 100
Columbus lead again, and had a few hundred more listings in April than it did in March. Listings overall were up in most places compared to a year ago, a small glimmer of good news.
Top 10 Locations with the Fewest New Listings in April 2021 1. Valleyview: 3 2. Lithopolis: 6 3. Obetz: 8 4. Jefferson LSD: 9 5. Sunbury: 9 6. Johnstown-Monroe LSD: 9 7. Jonathan Alder LSD: 10 8. Minerva Park: 11 9. Circleville CSD: 13 10. Grandview Heights: 14
Total New Listings in the Columbus Metro in April 2021: 3,250 Overall Metro New Listings % Change April 2021 vs April 2020: +41.1%
Top 10 Fastest-Selling Locations by # of Days Homes Remain on the Market Before Sale in April 2021 1. Lithopolis: 2 2. Minerva Park, Sunbury: 3 3. Big Walnut LSD, Jonathan Alder LSD: 4 4. Canal Winchester CSD, Jefferson LSD, Reynoldsburg CSD, Westerville, Worthington: 5 5. Groveport Madison LSD: 7 6. Beechwold/Clintonville, Delaware CSD, Hilliard CSD, Johnstown-Monroe LSD, Powell, Westerville CSD, Worthington CSD: 8 7. Hamilton LSD, South-Western CSD: 9 8. Hilliard, Pickerington LSD: 10 9. Obetz: 11 10. Bexley, Circleville CSD, Columbus: 12
Top 10 Slowest-Selling Locations by # of Days Homes Remain on the Market Before Sale in April 2021 1. Short North: 52 2. New Albany: 49 3. Granville CSD, New Albany Plain LSD: 39 4. German Village: 38 5. Grandview Heights: 28 6. Downtown: 27 7. Buckeye Valley LSD: 25 8. Lancaster CSD: 23 9. Marysville CSD, Olentangy LSD: 20 10. Upper Arlington CSD: 18
Top 10 Locations with the Greatest % Decline of # of Days on the Market Before Sale April 2021 vs March 2020 1. Lithopolis: -97.0% 2. Minerva Park: -94.6% 3. Big Walnut LSD: -93.7% 4. Johnstown-Monroe LSD: -92.3% 5. Canal Winchester CSD: -87.2% 6. Jonathan Alder LSD: -85.7% 7. Downtown: -81.0% 8. Delaware CSD: -80.0% 9. Hamilton LSD: -75.0% 10. Groveport Madison LSD: -73.1%
Top 10 Locations with the Lowest % Decline of # of Days on the Market Before Sale April 2021 vs March 2020 1. Short North: +73.3% 2. New Albany Plain LSD: +62.5% 3. New Albany: +44.1% 4. Jefferson LSD: +25.0% 5. Lancaster CSD: +4.5% 6. Upper Arlington CSD: 0.0% 7. Grove City: -7.1% 8. Buckeye Valley LSD: -16.7% 9. Gahanna: -18.8% 10. German Village: -24.0%
% Change for the # of Days Homes Remain on the Market Before Sale Across the Metro Overall: -46.7%
The market heated up even more in April. Despite more homes on the market, houses were selling the fastest they have in any month year to date. The improvements in sales came across the metro area, including urban areas that had been lagging behind somewhat in previous months.
Happy day! The 2020 Census data is finally beginning to be released after months of delays, including 2020 census state populations. Let’s take a look.
In many cases, the 2020 estimates had significant errors. New York was found to have more than 800,000 people above what the estimate was. The estimate assumed the state had lost population the past decade, but it had actually gained well over 800,000. Ohio was also undercounted by more than 106,000. In general, the Census estimates had Northern states with either too large losses/too slow growth than reality, while Southern states were generally estimated to have grown more than they really did. This has been a long-standing bias within the Census estimates program.
Total Change By Region Between 2000-2010 and 2010-2020 South: -2,571,014 Midwest: -475,772 Northeast: +531,490 West: -2,104,601
Ohio moved into the top 25 in total growth and was one of the top states for the biggest improvement between the 2000s and 2010s. However, because it was already one of the most-populated states in the nation, its total growth still wasn’t enough for it to not lose another House district. The state will have to keep improving if it wants to maintain its level of representation in Congress. Meanwhile, the fast-growing South and West regions clearly slowed down in growth the past decade. Combined, they added 4.675 million fewer people the past decade than they did during the 2000s. The Midwest was more of a mixed bag, with more states improving, but Illinois cancelling out all of that positive momentum. Only the Northeast managed to add more people the past decade than it did during the 2000s, mostly led by a huge improvement in New York.
The Census will release 2020 population numbers for counties, cities and other places over the next few months, and will be posted here when they are.
The popular monthly series continues with the local housing market update March 2021 report. Let’s drill down into the results.
Note: LSD= Local School District, CSD= City School District. In both cases, school district boundaries differ from city boundaries.
Top 15 Most Expensive Locations By Median Sales Price in March 2021 1. New Albany: $652,000 2. New Albany Plain LSD: $523,500 3. Powell: $519,000 4. Upper Arlington CSD: $476,600 5. German Village: $475,550 6. Grandview Heights: $474,000 7. Dublin: $462,000 8. Olentangy LSD: $443,685 9. Buckeye Valley LSD: $420,000 10. Dublin CSD: $419,000 11. Bexley: $413,000 12. Short North: $399,900 13. Granville LSD: $388,500 14. Big Walnut LSD: $384,900 15. Worthington: $358,000
New Albany continued to dominate the top of the market in terms of median sales price, and it wasn’t even close.
Top 15 Least Expensive Locations by Median Sales Price in March 2021 1. Whitehall: $140,100 2. Newark CSD: $146,000 3. Lancaster CSD: $160,500 4. Hamilton LSD: $166,000 5. Groveport Madison LSD: $185,000 6. Jefferson LSD: $185,000 7. Reynoldsburg CSD: $205,250 8. Columbus CSD: $209,718 9. Circleville CSD: $210,000 10. Columbus: $217,000 11. Obetz: $227,420 12. South-Western CSD: $230,000 13. Johnstown-Monroe LSD: $230,000 14. London CSD: $251,000 15. Teays Valley LSD: $253,092
Whitehall remains the area’s biggest bargain. This inner suburb hasn’t always had the best reputation, but the city has been making efforts to improve both its commercial corridors and residential options. Columbus is relatively cheap compared to most of the metro, yet has by far the largest variety of options and neighborhood types to choose from.
Overall Market Median Sales Price in March 2021: $242,550 The overall market is defined by Columbus Metro Area counties.
Top 15 Locations with the Highest Median Sales Price % Growth Between March 2020 and March 2021 1. London CSD: +52.2% 2. Circleville CSD: +44.3% 3. New Albany Plain LSD: +32.5% 4. German Village: +29.4% 5. Obetz: +26.4% 6. Gahanna Jefferson CSD: +26.0% 7. Grandview Heights: +25.4% 8. Powell: +23.9% 9. Upper Arlington CSD: +23.8% 10. Lancaster CSD: +23.7% 11. Jonathan Alder LSD: +23.6% 12. Grove City: +22.0% 13. Gahanna: +21.9% 14. Teays Valley: +21.5% 15. Pickerington LSD: +20.8% 16. Pickerington: +20.8%
Top 15 Locations with the Lowest Median Sales Price % Growth Between March 2020 and March 2021 1. Johnstown Monroe LSD: -25.0% 2. Downtown Columbus: -14.5% 3. Granville LSD: -13.2% 4. Big Walnut LSD: -10.5% 5. Short North: -10.0% 6. Bexley: -6.1% 7. Minerva Park: -5.4% 8. Worthington: -5.0% 9. Hamilton LSD: -3.8% 10. Hilliard: +0.8% 11. New Albany: +1.7% 12. Newark CSD: +4.3% 13. Dublin CSD: +4.6% 14. Hilliard CSD: +5.5% 15. Dublin: +7.5%
Urban areas and some inner suburbs had either the biggest price declines or smallest increases in March vs. March 2020 as the fallout continued from Covid and protest-related activities. These declines may be seen by potential buyers as a positive from the high prices that otherwise continue, however.
Overall Market Median Sales Price % Change March 2021 vs. March 2020: +16.3%
Top 10 Locations with the Most New Listings in March 2021 1. Columbus: 1,156 2. Columbus CSD: 811 3. South-Western CSD: 187 4. Olentangy LSD: 161 5. Hilliard CSD: 138 6. Westerville CSD: 125 7. Dublin CSD: 125 8. Gahanna Jefferson CSD: 78 9. Dublin: 77 10. Upper Arlington CSD: 76
To no surprise, Columbus remains strongly at the top. There were about 300 more new listings in Columbus in March than in February as warmer weather prompted more sellers to put their homes on the market.
Top 10 Locations with the Fewest New Listings in March 2021 1. Valleyview: 0 2. Lithopolis: 2 3. Minerva Park: 2 4. Jefferson LSD: 8 5. Jonathan Alder: LSD: 11 6. Sunbury: 12 7. Grandview Heights: 12 8. Obetz: 12 9. Whitehall: 12 10. German Village: 13
Total New Listings in the Columbus Metro in March 2021: 2,797 Overall Metro New Listings % Change March 2021 vs March 2020: +3.3% The small increase overall was pushed by big increases smaller counties like Perry, Pickaway and Union.
Top 10 Fastest-Selling Locations by # of Days Homes Remain on the Market Before Sale in March 2021 1. Canal Winchester CSD: 3 2. Johnstown-Monroe LSD: 4 3. Minerva Park: 6 4. Hilliard: 7 5. Jefferson LSD: 7 6. Gahanna: 8 7. Groveport Madison LSD: 8 8. Whitehall: 9 9. London CSD: 10 10. Jonathan Alder LSD: 11 11. Marysville CSD: 11 12. South-Western CSD: 11
Top 10 Slowest-Selling Locations by # of Days Homes Remain on the Market Before Sale in March 2021 1. Lithopolis: 59 2. Powell: 55 3. Downtown Columbus: 54 4. Short North: 52 5. Big Walnut LSD: 49 6. Lancaster CSD: 39 7. Olentangy LSD: 38 8. Dublin: 37 9. Grandview Heights: 36 10. Buckeye Valley LSD: 34
Top 10 Locations with the Greatest % Decline of # of Days on the Market Before Sale March 2021 vs March 2020 1. Johnstown-Monroe LSD: -92.7% 2. Canal Winchester CSD: -92.5% 3. Minerva Park: -90.2% 4. Jefferson LSD: -89.9% 5. Sunbury: -85.0% 6. Jonathan Alder LSD: -83.8% 7. New Albany: -81.9% 8. New Albany Plain LSD: -75.5% 9. Marysville CSD: -71.8% 10. Whitehall: -71.0%
Top 10 Locations with the Lowest % Decline of # of Days on the Market Before Sale March 2021 vs March 2020 1. Worthington CSD: +50.0% 2. Worthington: +38.5% 3. Powell: +12.2% 4. Lancaster CSD: +2.6% 5. Hilliard CSD: -4.3% 6. Obetz: -5.3% 7. Short North: -10.3% 8. Newark CSD: -14.3% 9. Downtown Columbus: -23.9% 10. Pataskala: -26.1%
% Change for the # of Days Homes Remain on the Market Before Sale Across the Metro Overall: -24.5%
The market remained hot in March, with faster sales and higher prices than in the previous. Inventory did inch up some as spring arrived, but not nearly enough to counter overall demand. Urban areas are still a bit off their peaks from pre-Covid and protests, but seem to have recovered slightly from some previous months.
The previous housing market report and the Columbus Realtors site offers additional information on the Columbus market.