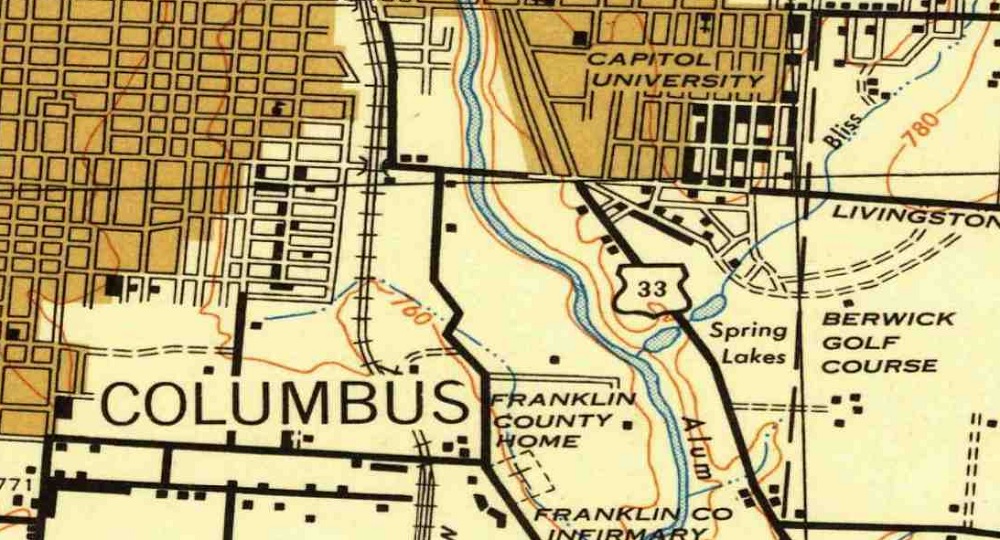
This link is a great resource to find old local maps for cities, counties and states from the US to around the world. For Columbus, maps go back to the 1920s, but other locations have even older versions. The maps are helpful for those doing research on this history of their cities.
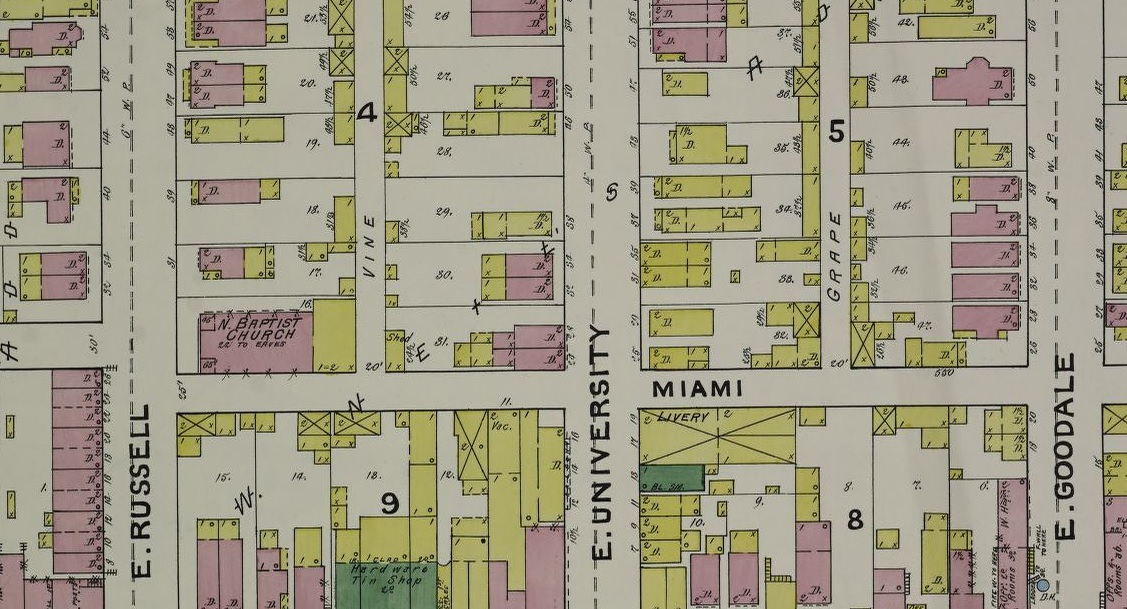
Another favorite link is the Sanborn Fire Insurance Maps. These maps are even more detailed and you can view individual buildings down to the street level back to the 19th Century. These maps are available at the Library of Congress and require a bit more searching to find what you’re looking for.
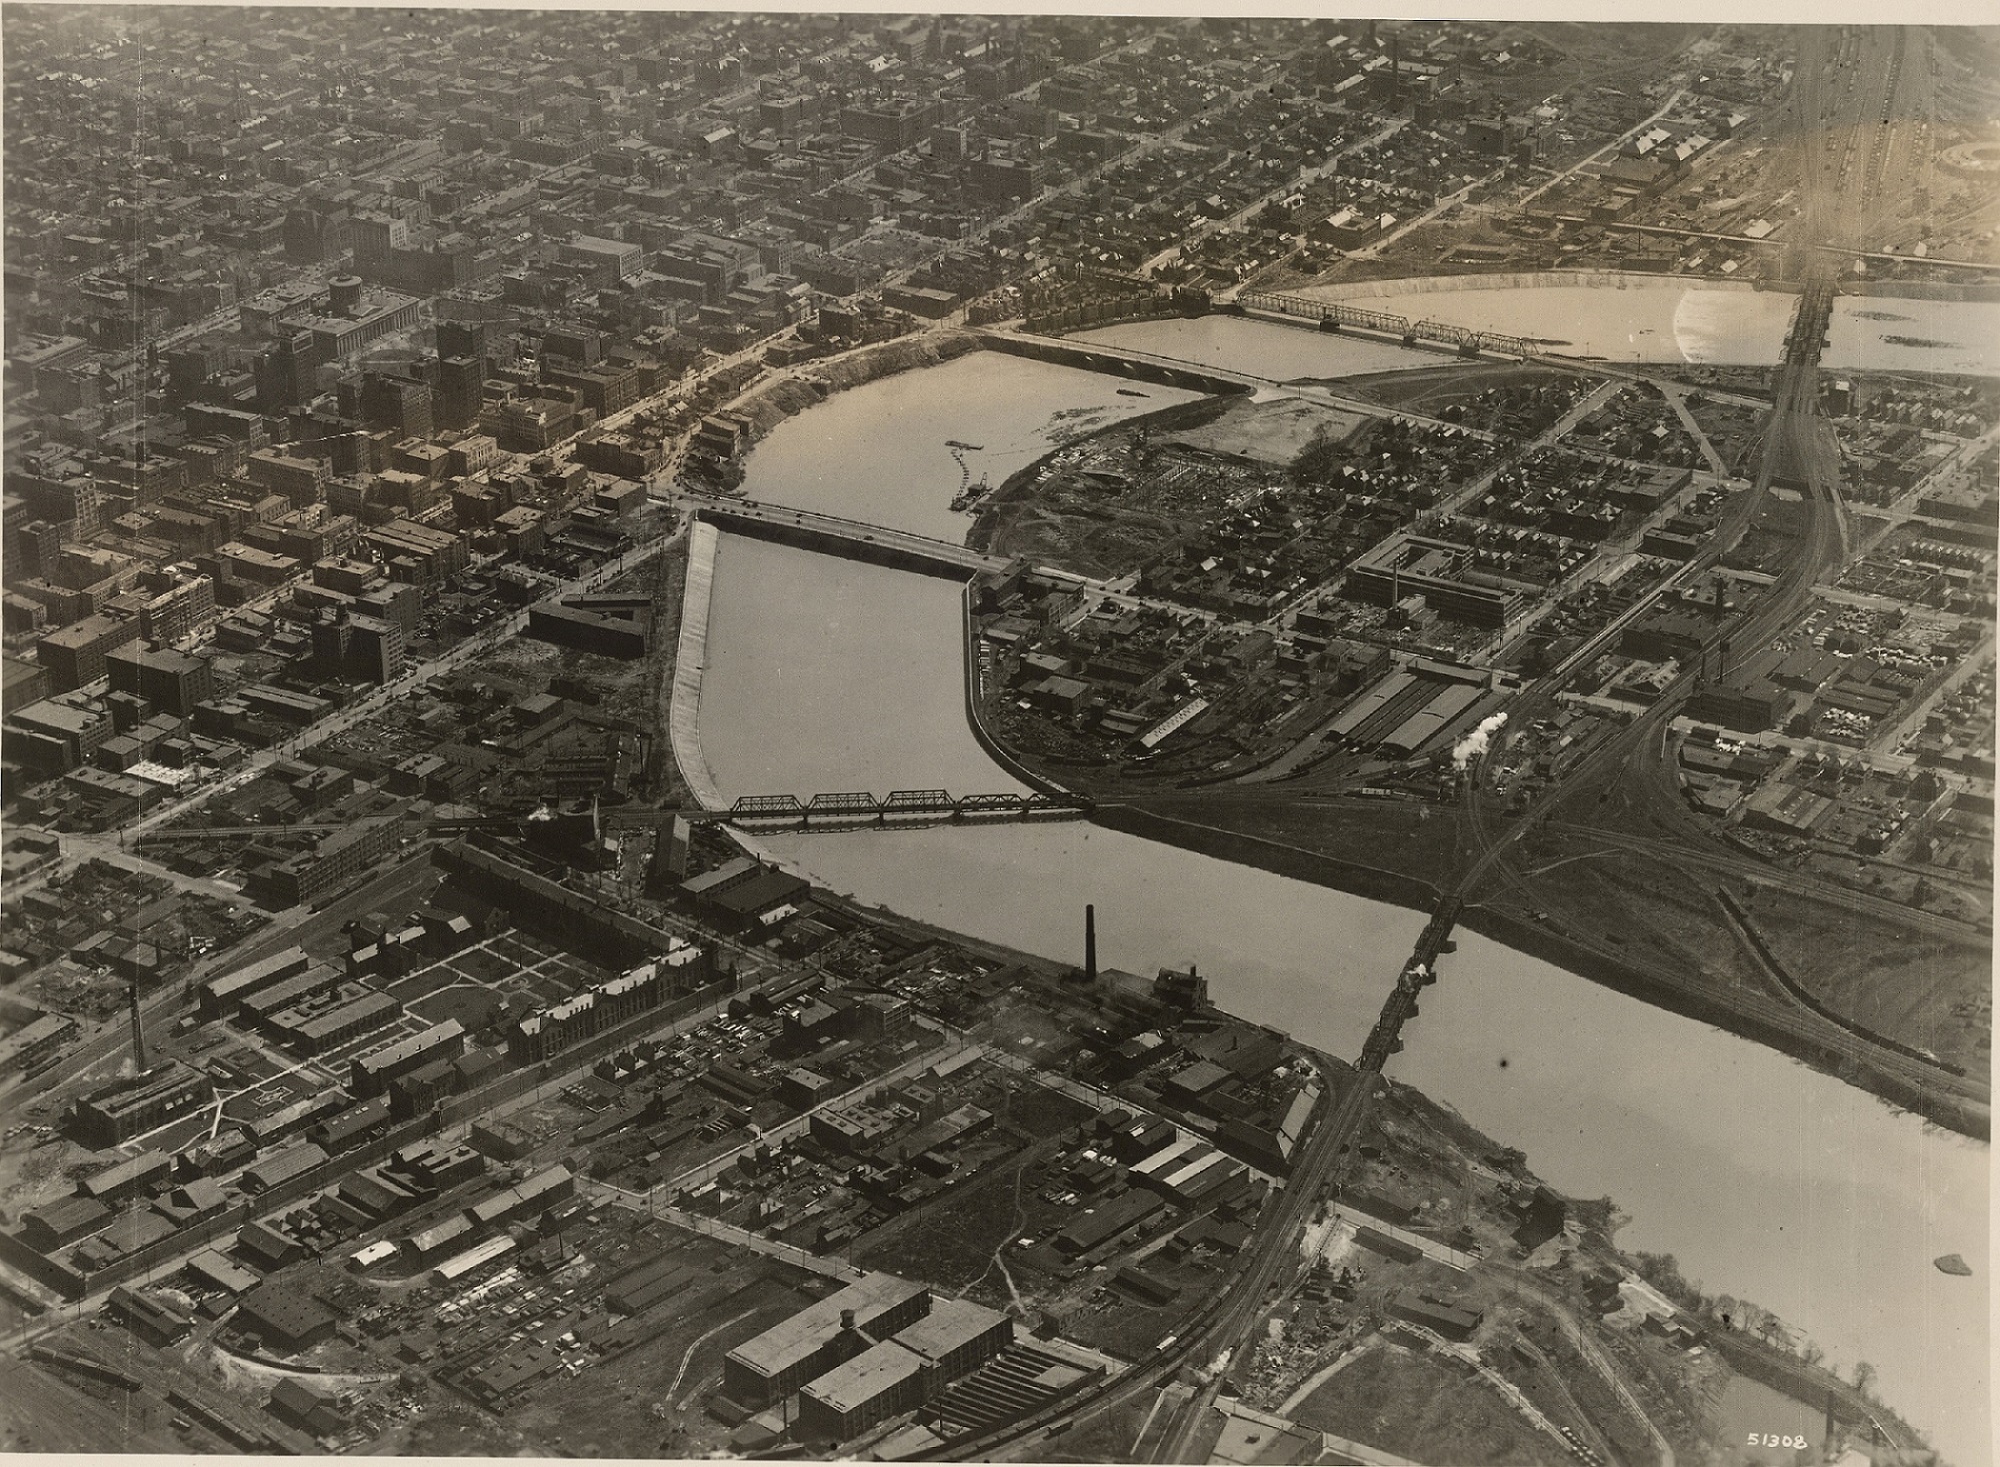
Aerial photos have been around for more than a century, ever since someone thought to take photos from airplanes. These photos go back to at least the 1910s, when the airplane was still very much a new technology. I thought it might be interesting to do show a few of these before and after Downtown aerial photos to give an idea of how the same areas look today.
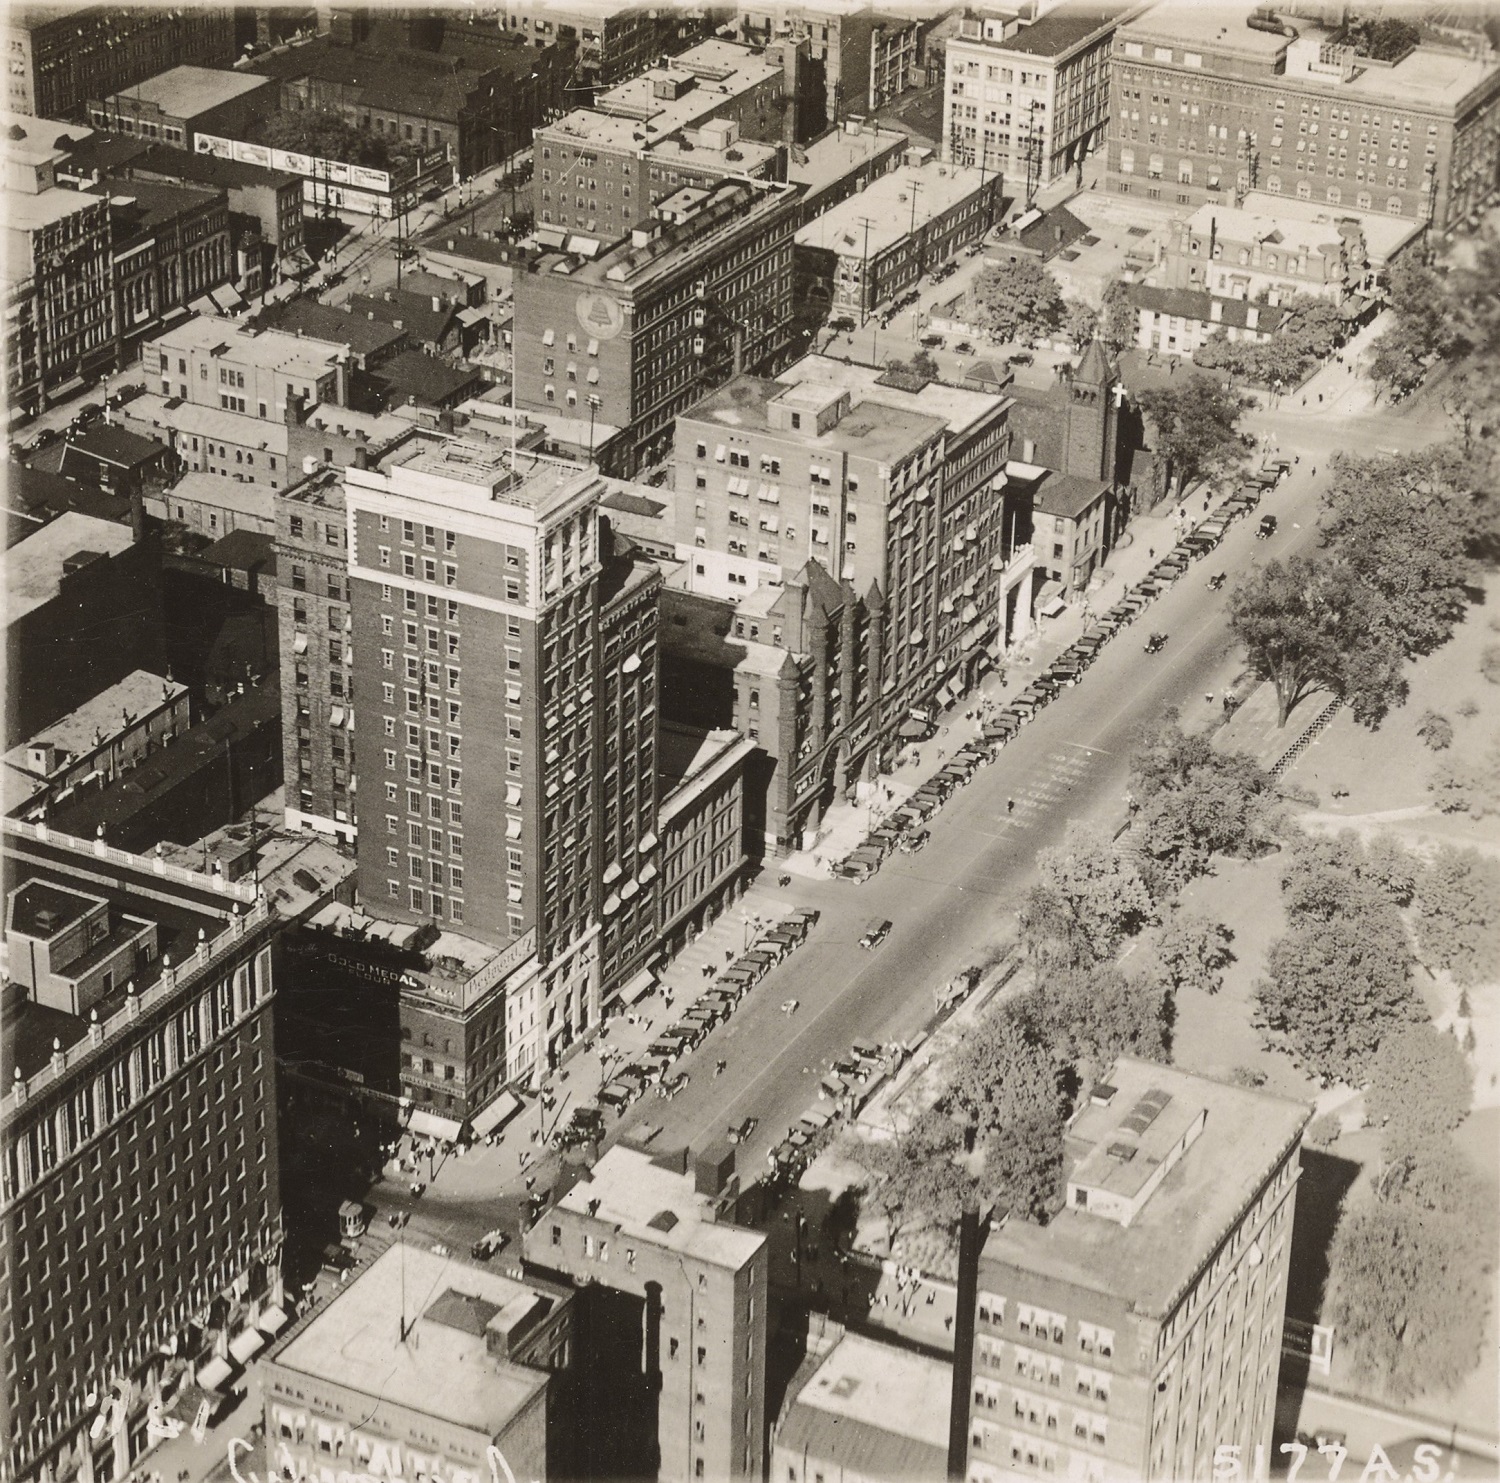
Before
Downtown around 1923.
This photo of Downtown was likely taken sometime between 1922 and 1923. The main clue is that the old Central High School is clearly under construction on the Scioto Peninsula, but seemingly in the early phases. The school would later open in the fall of 1924. Also in the photo is the new Scioto River floodwall under construction just a decade after the Great Flood of 1913. The buildings near and along the riverfront would eventually be demolished for this project, as well as the eventual Civic Center project that would later build the Post Office and Ohio Supreme Court building. Notice as well the lack of Columbus’ signature building- LeVeque Tower. That project would be constructed over the next few years. After
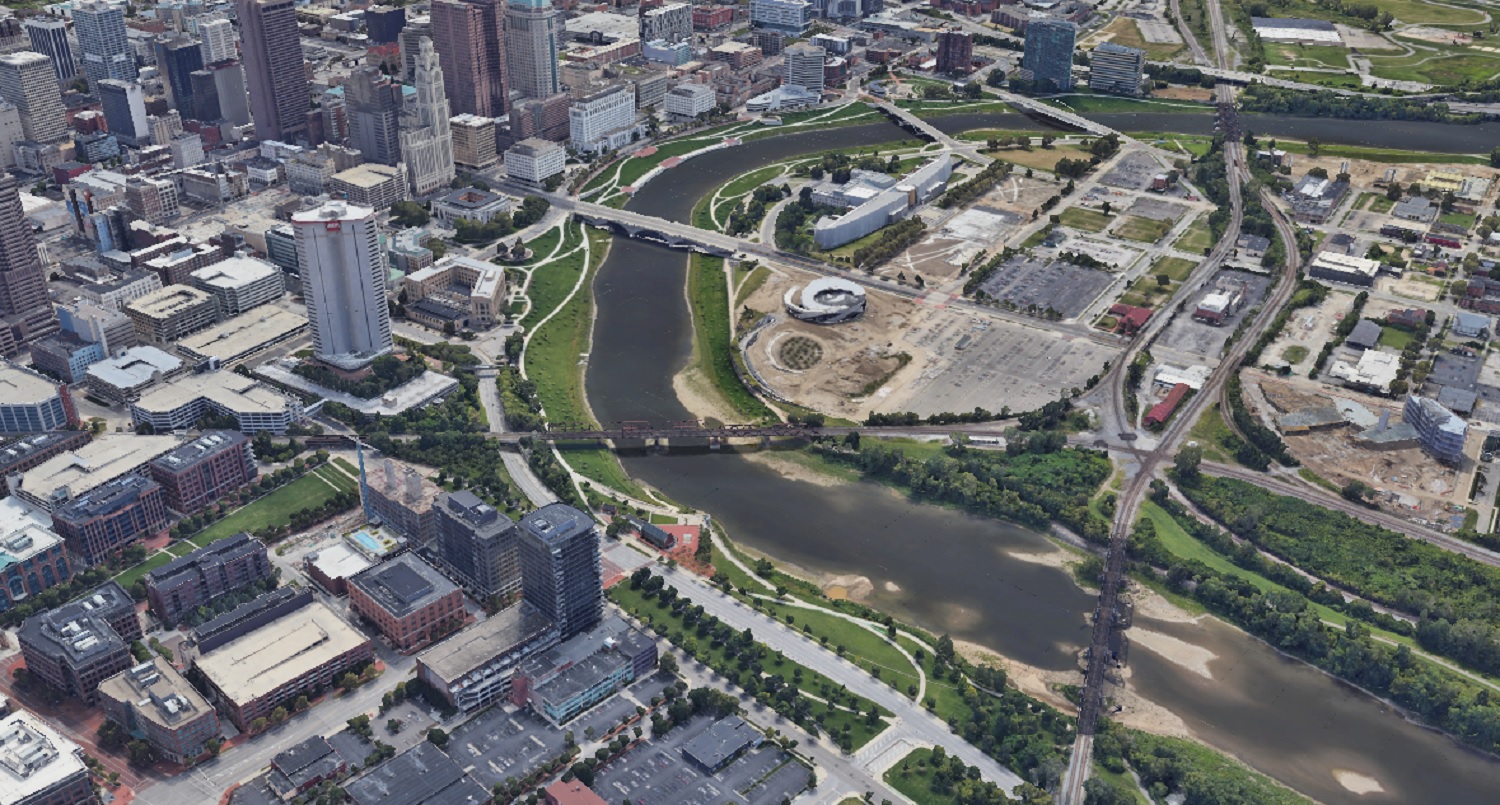
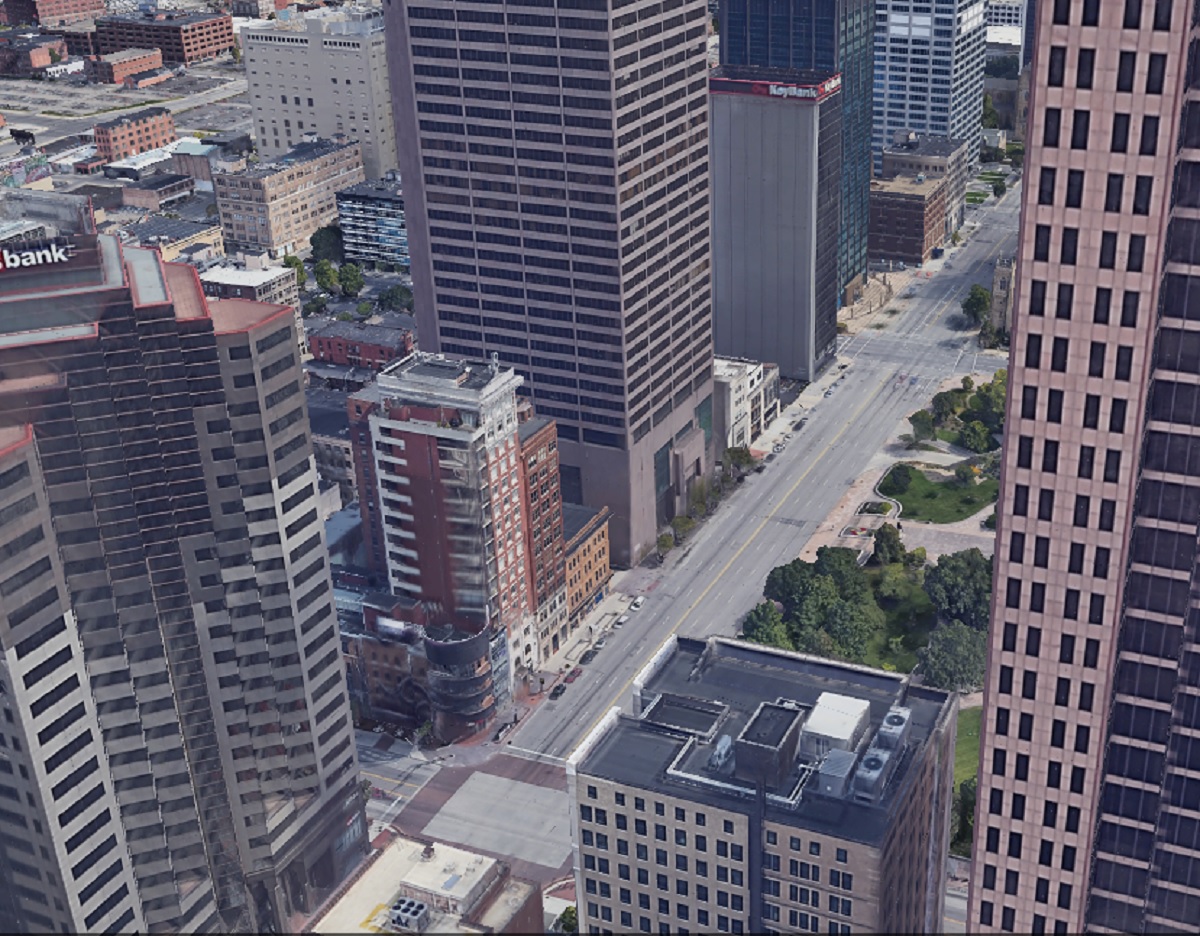
Downtown in 2019.
Downtown has obviously changed enormously in the past century. Skyscrapers now dominate Downtown, and the highway system now cuts through many neighborhoods. The riverfront itself is also significantly nicer and less industrial looking. Before
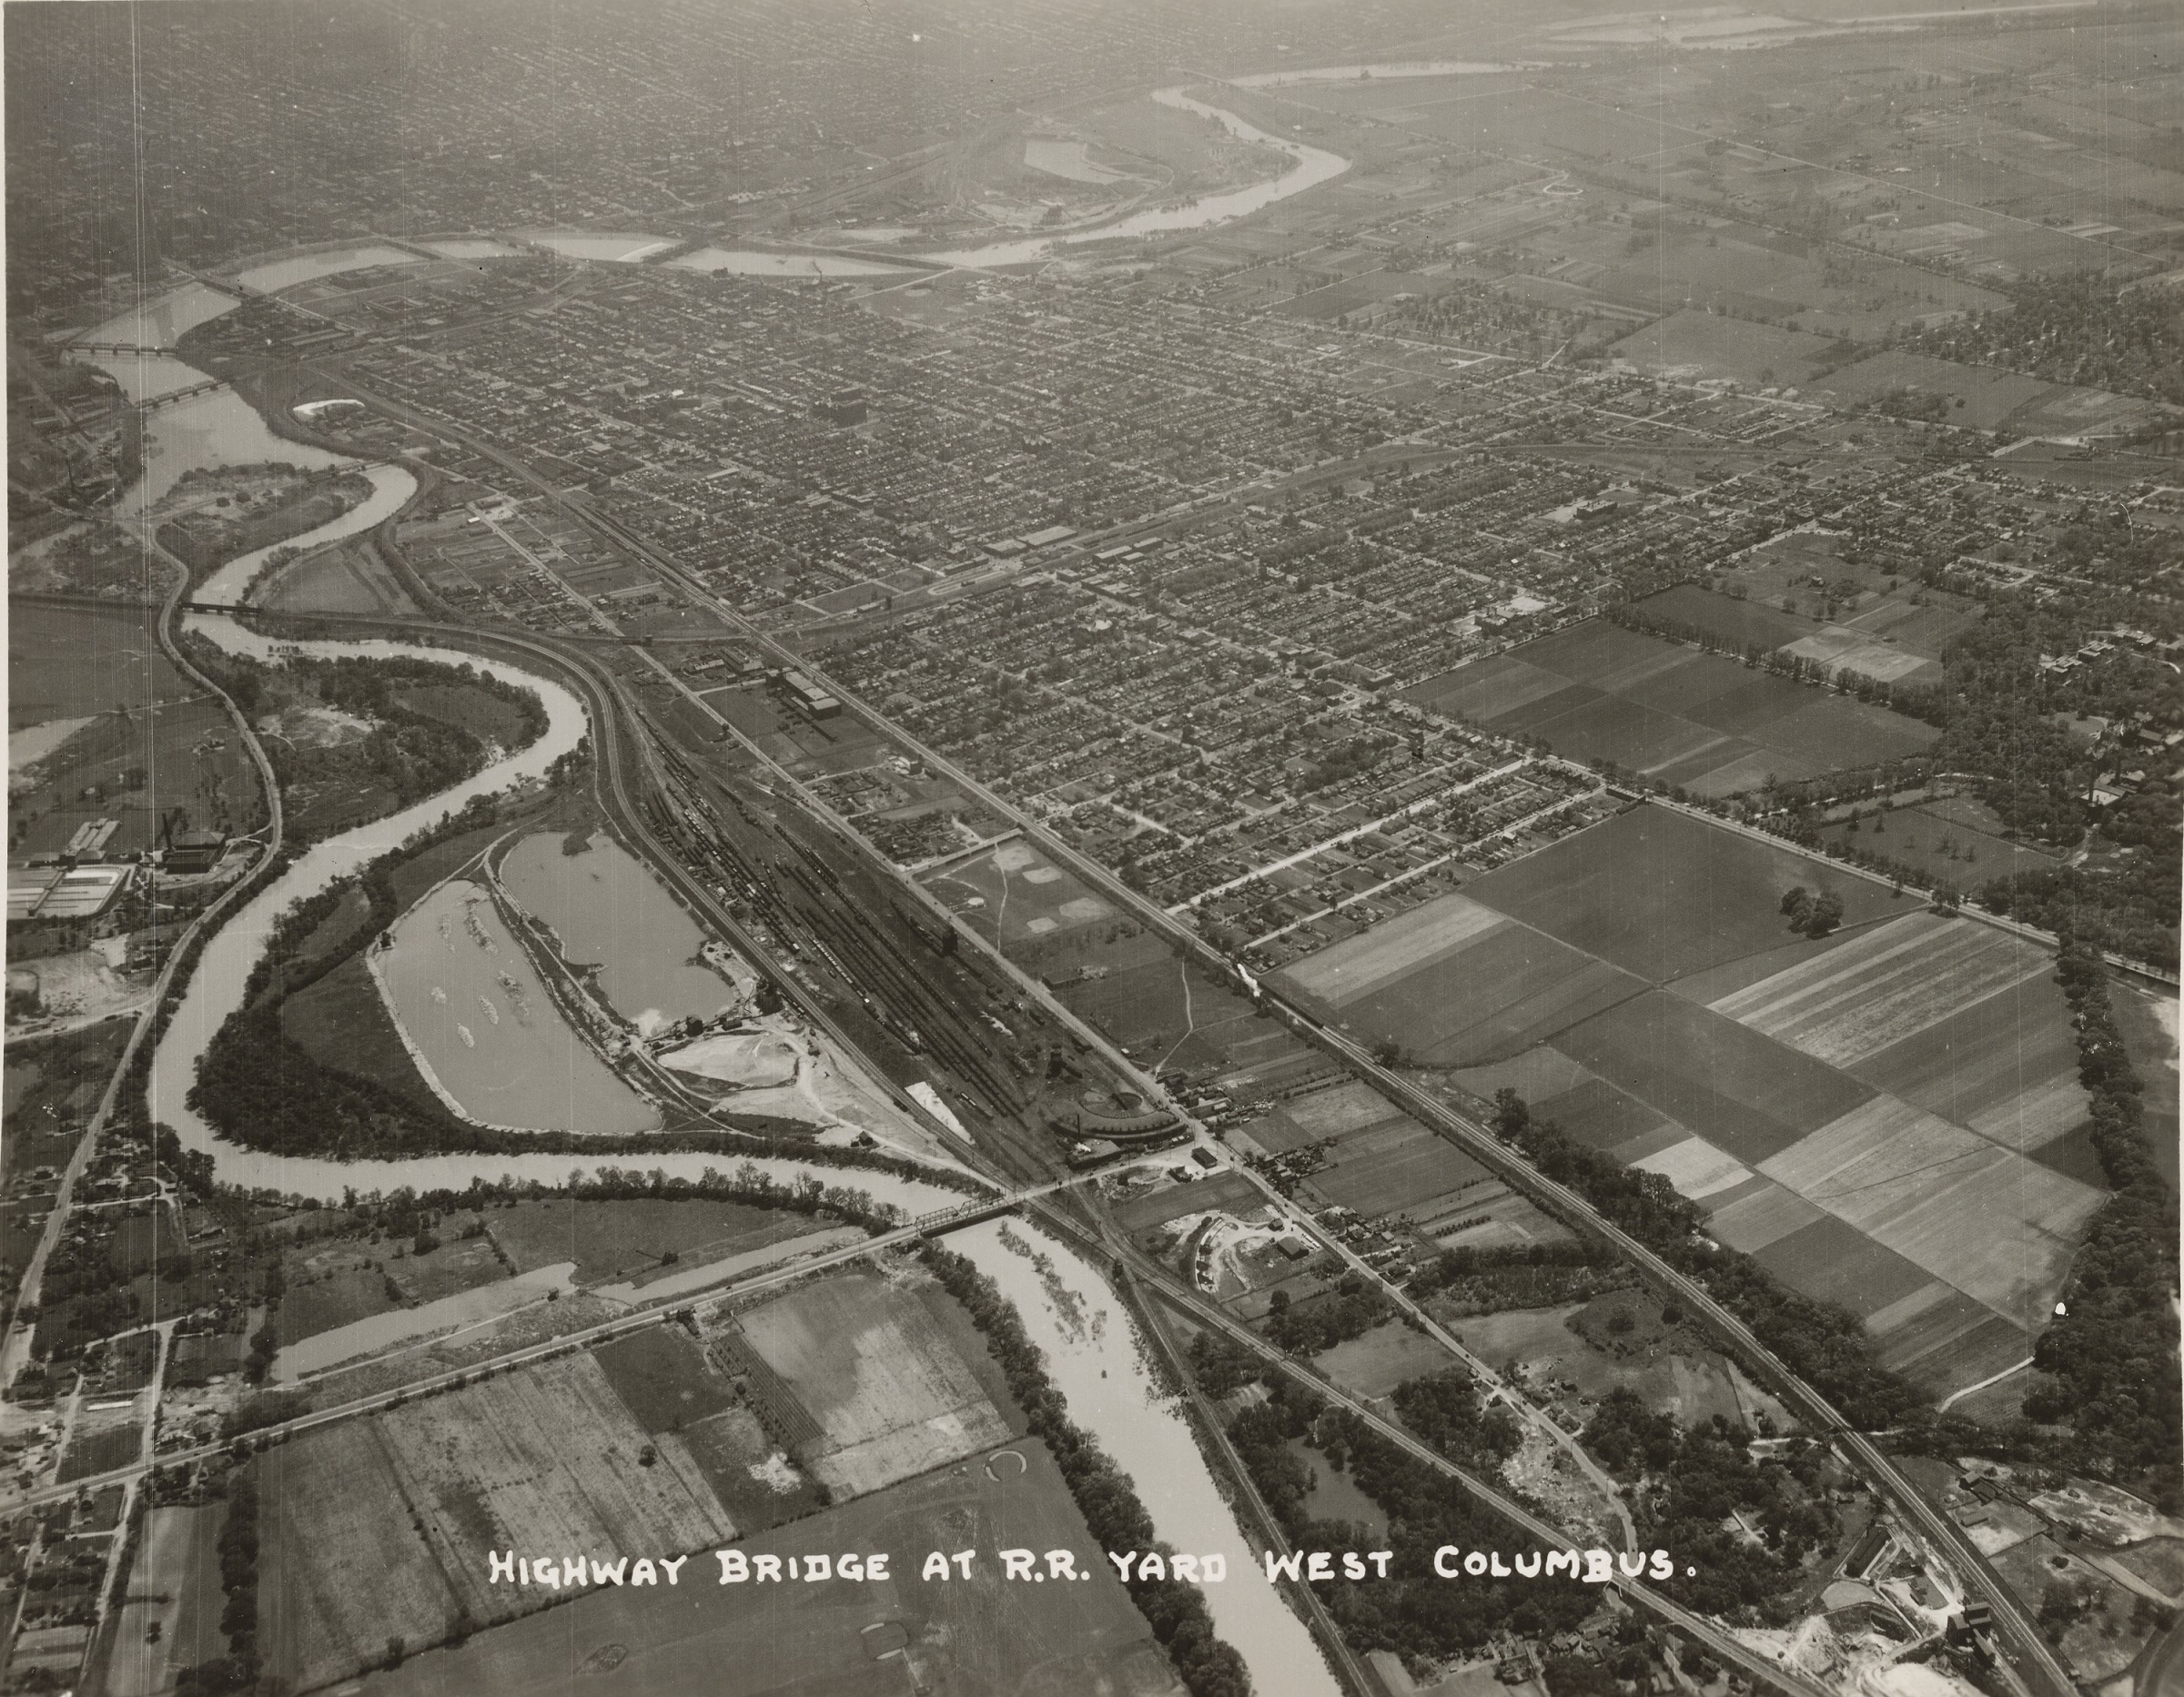
Photo taken in 1929.
This 1929 photo looks west over Franklinton towards Downtown. The most revealing part of this photo is how compact the developed area of Columbus really was at the time. Farm fields can be seen to the south and west of Columbus. After
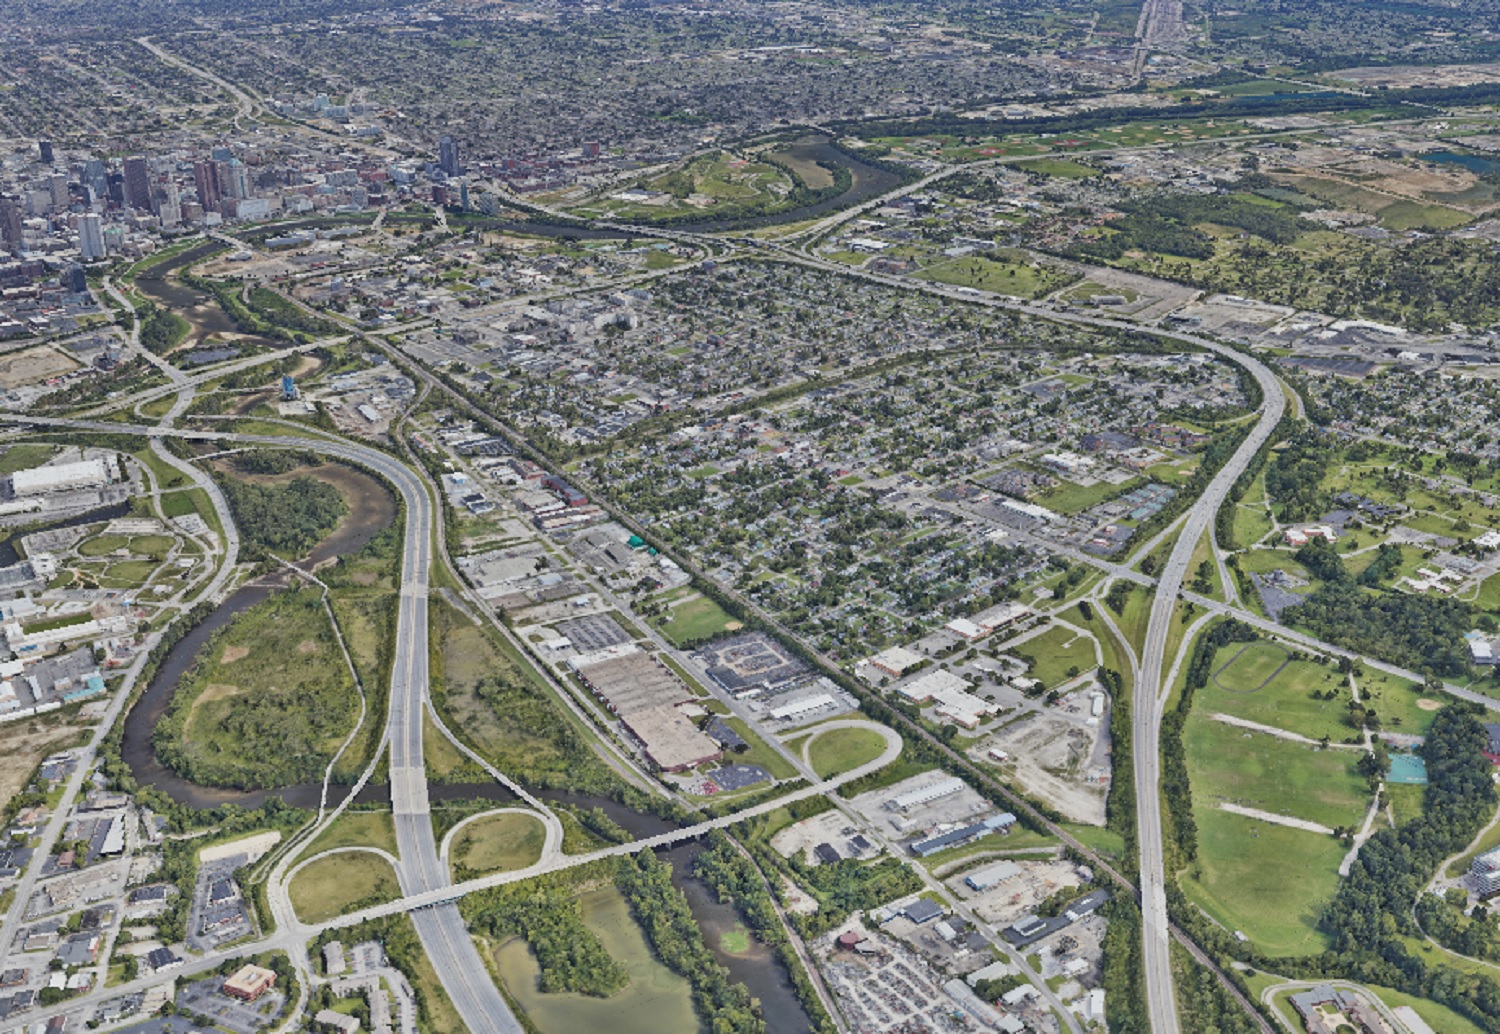
Photo taken in 2019.
In the after photo, nearly all the vacant land is gone except for park space, Greenlawn Cemetery and areas along the rivers.
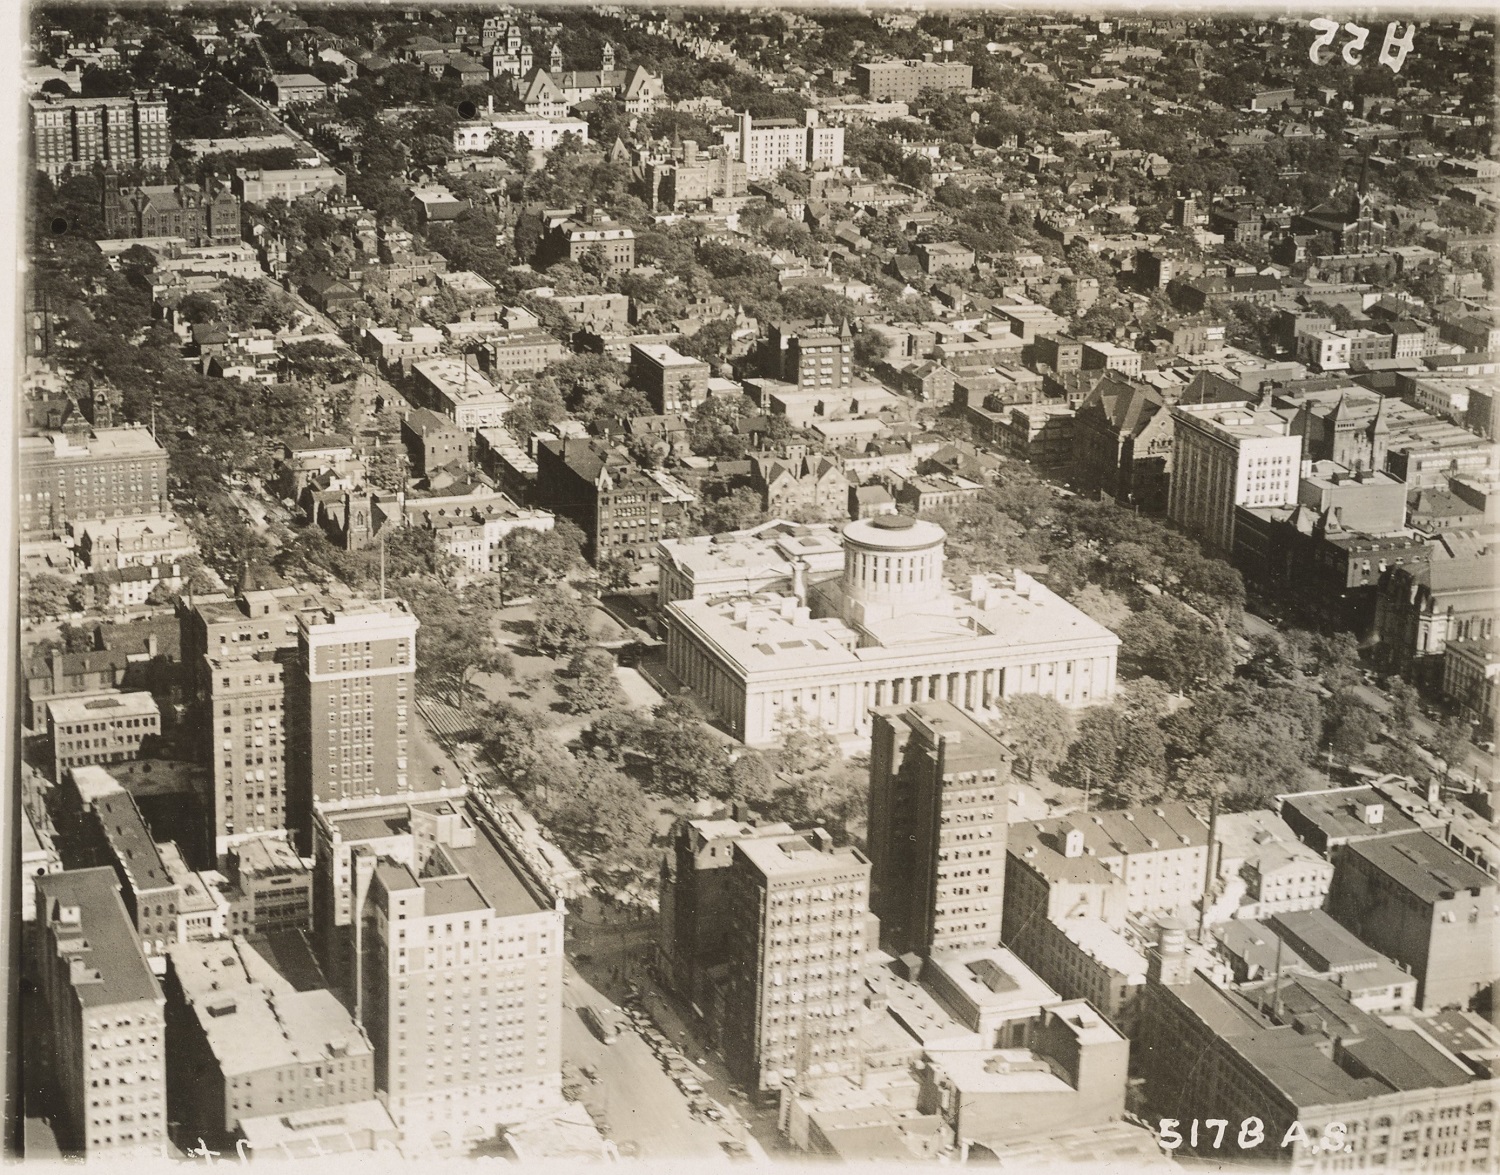
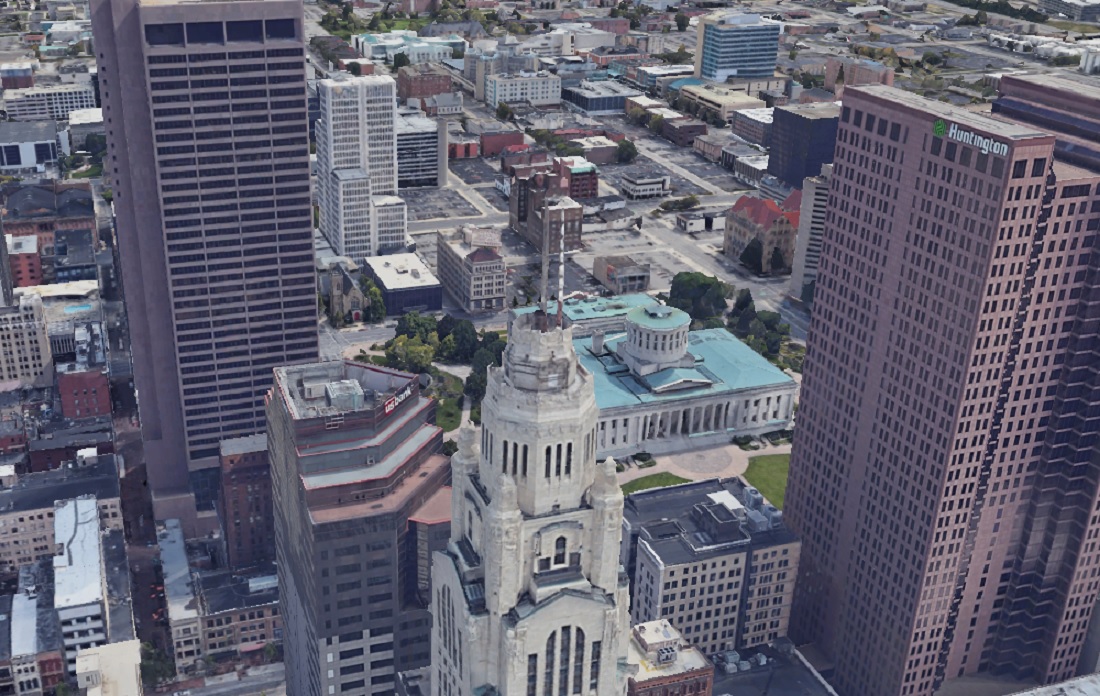
Before This photo of Capitol Square in 1919 is one of the earliest aerials of Downtown I was able to find. This photo predates all highrise construction. The city was compact, dense and dominated by brick buildings. After In the 2019 image, skyscrapers have now replaced many of the older buildings. While the Capitol itself a handful of other buildings remain, the density has largely been lost over the years, with parking lots where many once stood. Before The 1919 image shows the intersection of High and Broad Streets, arguably the very center of Columbus. After Aside from the 8 on the Square building, virtually everything else from 1919 is long gone.
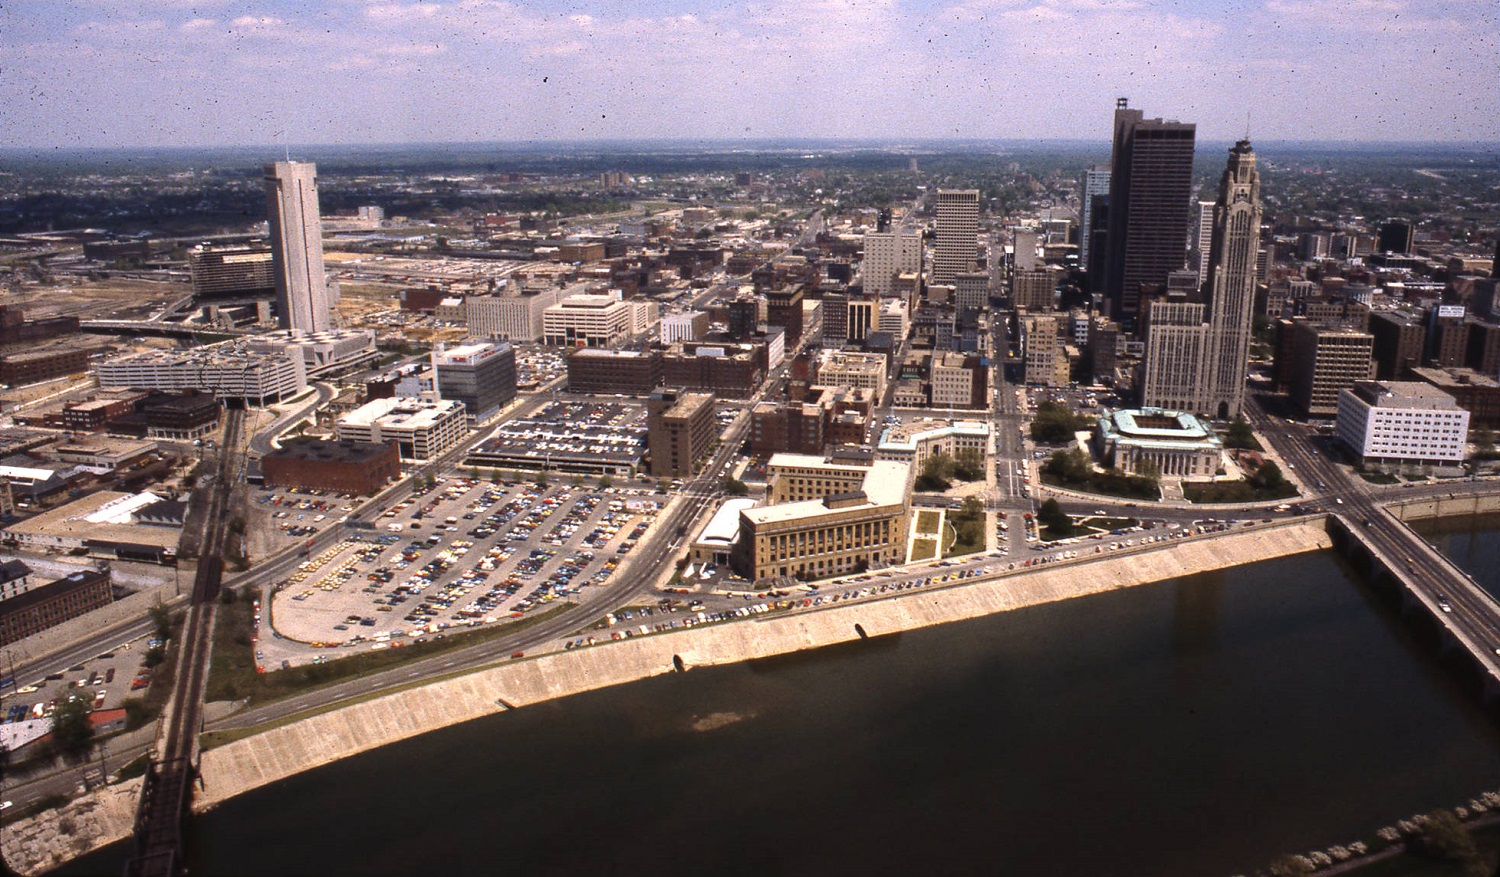
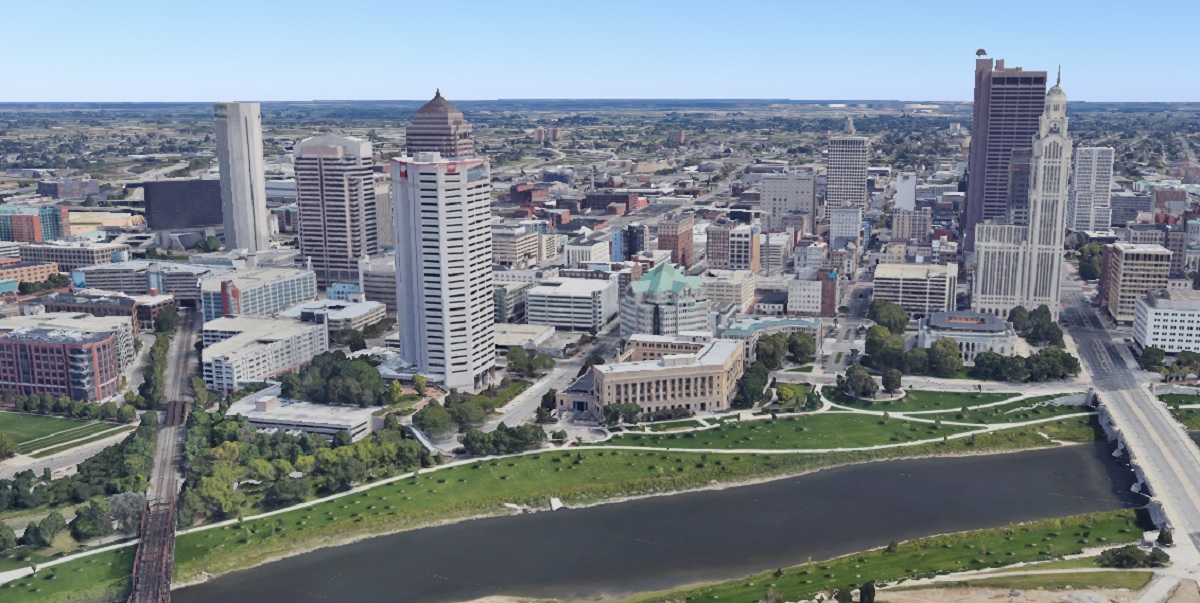
Before This much more modern image of Downtown and the riverfront was taken in 1980. After The 2019 Google Earth image from the same angle shows significant changes in 40 years. New skyscrapers and other development are obvious, but the massive changes to the riverfront itself almost make this look like a different city altogether.
What might these areas look like in another century?
The monthly housing market update April 2021 has been released from Columbus Realtors. The results continue ongoing trends of rising prices and low supply.
Note: LSD= Local School District, CSD= City School District. In both cases, school district boundaries differ from city boundaries.
Top 15 Most Expensive Locations By Median Sales Price in April 2021 1. New Albany: $677,500 2. German Village: $570,000 3. Bexley: $527,500 4. Dublin: $514,000 5. Powell: $500,000 6. Grandview Heights: $486,000 7. New Albany Plain LSD: $469,393 8. Upper Arlington CSD: $465,008 9. Olentangy LSD: $446,575 10. Dublin CSD: $437,000 11. Buckeye Valley LSD: $425,000 12. Jonathan Alder LSD: $422,000 13. Granville CSD: $410,000 14. Worthington: $409,250 15. Short North: $405,500
New Albany continued to top the charts, and remained more than $100K over second place.
Top 15 Least Expensive Locations by Median Sales Price in April 2021 1. Newark CSD: $140,000 2. Circleville CSD: $164,900 3. Whitehall: $165,000 4. Hamilton LSD: $195,250 5. Groveport Madison LSD: $196,000 6. Jefferson LSD: $198,000 7. Lancaster CSD: $200,000 8. London CSD: $207,500 9. Columbus CSD: $217,000 10. Obetz: $225,100 11. Columbus: $228,500 12. South-Western CSD: $230,000 13. Reynoldsburg CSD: $237,900 14. Canal Winchester CSD: $245,500 15. Minerva Park: $245,551
Columbus and some of its suburbs remained relative bargains in April.
Overall Market Median Sales Price in April 2021: $251,135 The overall market is defined by Columbus Metro Area counties.
Top 15 Locations with the Highest Median Sales Price % Growth Between April 2020 and April 2021 1. German Village: +67.2% 2. Jonathan Alder LSD: +42.1% 3. Worthington: +39.3% 4. Blacklick: +38.6% 5. Buckeye Valley LSD: +36.7% 6. Powell: +33.8% 7. Teays Valley LSD: +30.6% 8. Whitehall: +29.7% 9. Worthington CSD: 26.4% 10. London CSD: +25.8% 11. Olentangy LSD: 24.7% 12. Bexley: +24.1% 13. Westerville CSD: 22.9% 14. Jefferson LSD: +21.5% 15. South-Western CSD: +21.1% 16. Marysville CSD: +20.3%
Top 15 Locations with the Lowest Median Sales Price % Growth Between April 2020 and April 2021 1. Grandview Heights: -20.4% 2. New Albany Plain LSD: -10.3% 3. Canal Winchester CSD: -8.4% 4. Downtown: -8.0% 5. Johnstown-Monroe LSD: -6.8% 6. New Albany: -6.6% 7. Lithopolis: -6.3% 8. Newark CSD: -2.1% 9. Big Walnut LSD: +0.3 10. Circleville CSD: +0.6% 11. Granville CSD: +1.4% 12. Reynoldsburg CSD: +2.9% 13. Pataskala: +5.0% 14. Minerva Park: +5.8% 15. Gahanna Jefferson CSD: +6.4%
Urban areas generally improved significantly over earlier in the year. Downtown was still down, but by less than in previous months, so it seems the urban market is now well underway with a recovery.
Overall Market Median Sales Price % Change April 2021 vs. April 2020: +13.8%
Top 10 Locations with the Most New Listings in April 2021 1. Columbus: 1,328 2. Columbus CSD: 917 3. South-Western CSD: 197 4. Westerville CSD: 182 5. Olentangy LSD: 177 6. Hilliard CSD: 171 7. Dublin CSD: 153 8. Worthington CSD: 108 9. Pickerington LSD: 105 10. Grove City: 100
Columbus lead again, and had a few hundred more listings in April than it did in March. Listings overall were up in most places compared to a year ago, a small glimmer of good news.
Top 10 Locations with the Fewest New Listings in April 2021 1. Valleyview: 3 2. Lithopolis: 6 3. Obetz: 8 4. Jefferson LSD: 9 5. Sunbury: 9 6. Johnstown-Monroe LSD: 9 7. Jonathan Alder LSD: 10 8. Minerva Park: 11 9. Circleville CSD: 13 10. Grandview Heights: 14
Total New Listings in the Columbus Metro in April 2021: 3,250 Overall Metro New Listings % Change April 2021 vs April 2020: +41.1%
Top 10 Fastest-Selling Locations by # of Days Homes Remain on the Market Before Sale in April 2021 1. Lithopolis: 2 2. Minerva Park, Sunbury: 3 3. Big Walnut LSD, Jonathan Alder LSD: 4 4. Canal Winchester CSD, Jefferson LSD, Reynoldsburg CSD, Westerville, Worthington: 5 5. Groveport Madison LSD: 7 6. Beechwold/Clintonville, Delaware CSD, Hilliard CSD, Johnstown-Monroe LSD, Powell, Westerville CSD, Worthington CSD: 8 7. Hamilton LSD, South-Western CSD: 9 8. Hilliard, Pickerington LSD: 10 9. Obetz: 11 10. Bexley, Circleville CSD, Columbus: 12
Top 10 Slowest-Selling Locations by # of Days Homes Remain on the Market Before Sale in April 2021 1. Short North: 52 2. New Albany: 49 3. Granville CSD, New Albany Plain LSD: 39 4. German Village: 38 5. Grandview Heights: 28 6. Downtown: 27 7. Buckeye Valley LSD: 25 8. Lancaster CSD: 23 9. Marysville CSD, Olentangy LSD: 20 10. Upper Arlington CSD: 18
Top 10 Locations with the Greatest % Decline of # of Days on the Market Before Sale April 2021 vs March 2020 1. Lithopolis: -97.0% 2. Minerva Park: -94.6% 3. Big Walnut LSD: -93.7% 4. Johnstown-Monroe LSD: -92.3% 5. Canal Winchester CSD: -87.2% 6. Jonathan Alder LSD: -85.7% 7. Downtown: -81.0% 8. Delaware CSD: -80.0% 9. Hamilton LSD: -75.0% 10. Groveport Madison LSD: -73.1%
Top 10 Locations with the Lowest % Decline of # of Days on the Market Before Sale April 2021 vs March 2020 1. Short North: +73.3% 2. New Albany Plain LSD: +62.5% 3. New Albany: +44.1% 4. Jefferson LSD: +25.0% 5. Lancaster CSD: +4.5% 6. Upper Arlington CSD: 0.0% 7. Grove City: -7.1% 8. Buckeye Valley LSD: -16.7% 9. Gahanna: -18.8% 10. German Village: -24.0%
% Change for the # of Days Homes Remain on the Market Before Sale Across the Metro Overall: -46.7%
The market heated up even more in April. Despite more homes on the market, houses were selling the fastest they have in any month year to date. The improvements in sales came across the metro area, including urban areas that had been lagging behind somewhat in previous months.
Bridge Street gets its name from the lone bridge that has connected Dublin with areas east of the Scioto River for well over a century. Dublin’s stone bridge, however, is not original. It is the 3rd iteration over the lifespan of the crossing, replacing an 1879 iron version that replaced the original wooden covered bridge. The iron bridge crossed the river just to the north of the current bridge.
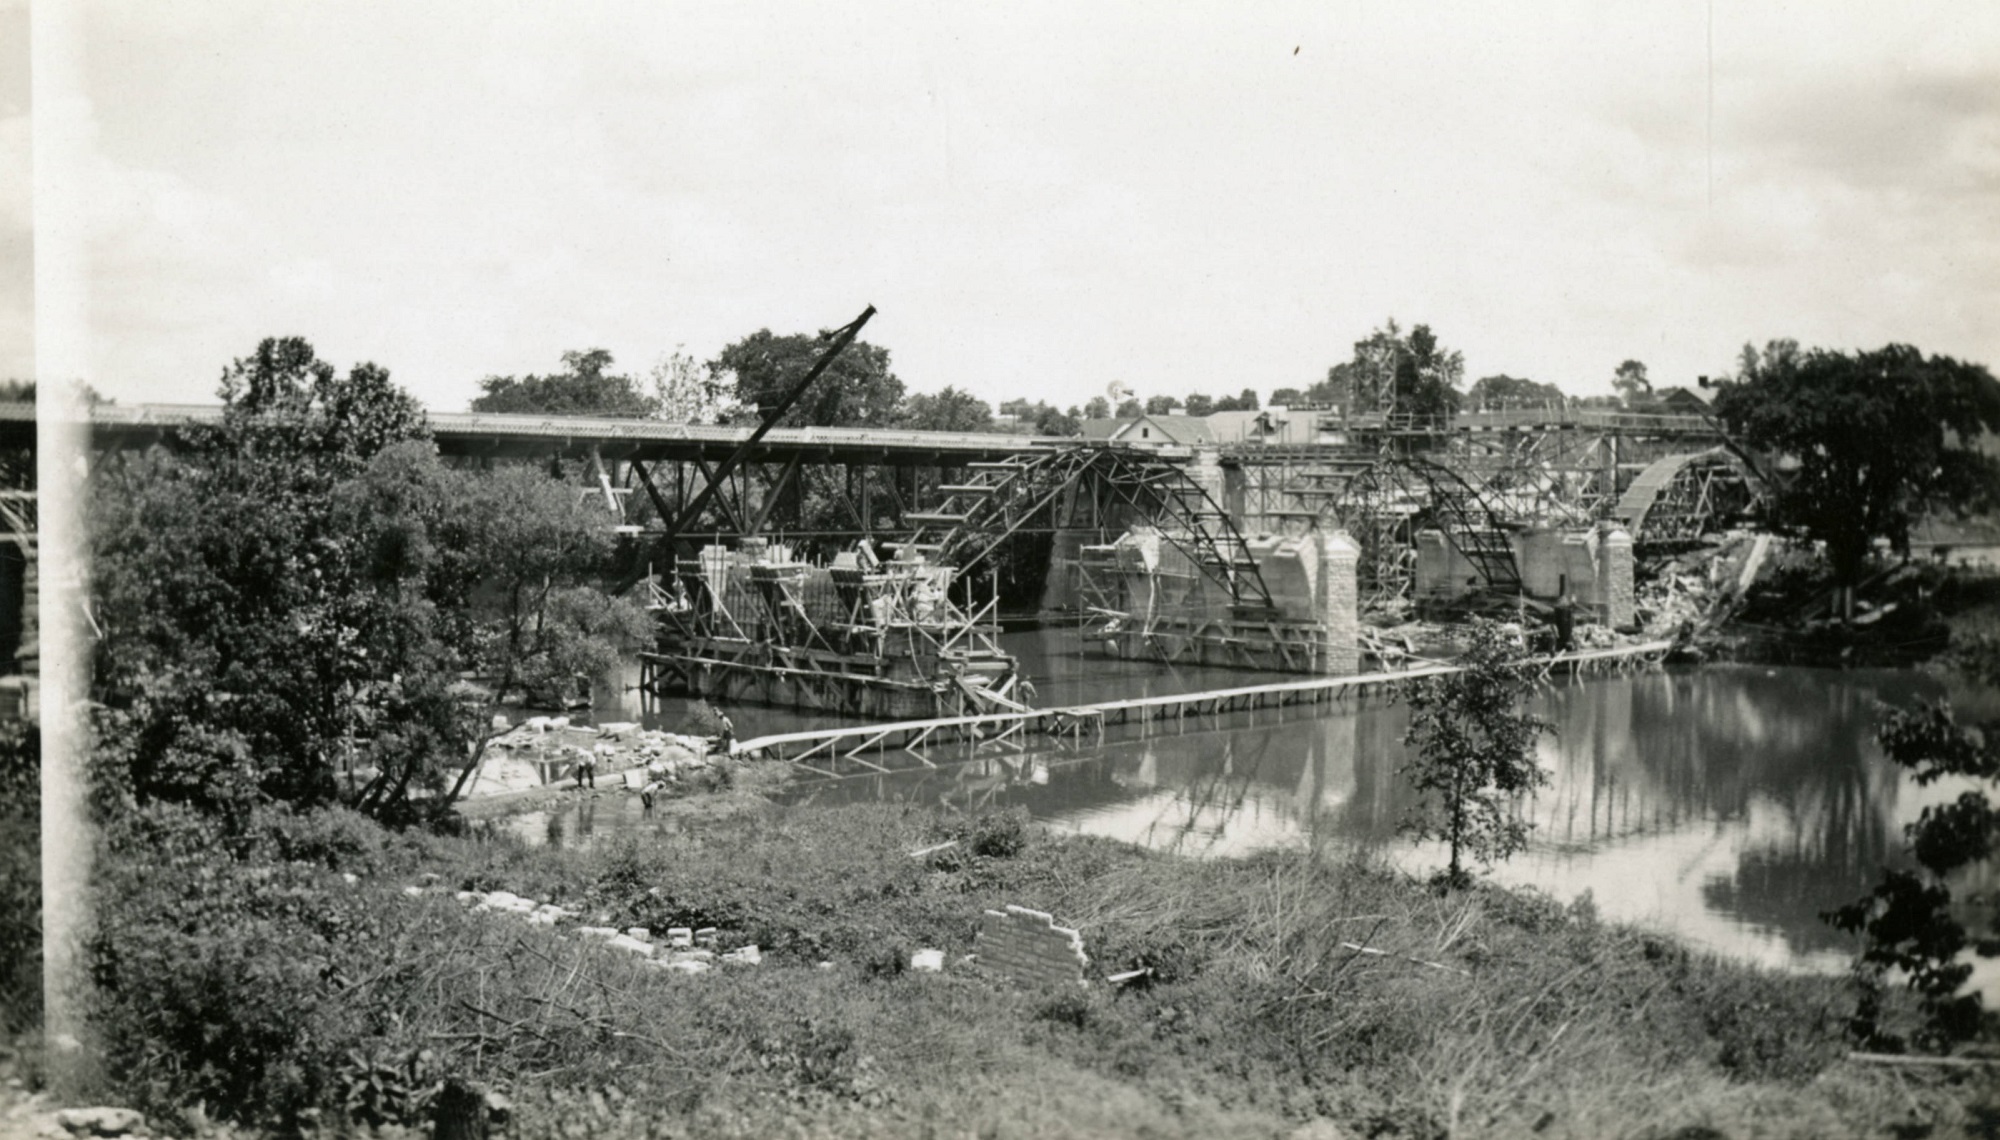
The bridge was constructed between 1935-1936. It was built by the Works Progress Administration (WPA), a Depression-era infrastructure building and jobs program. The project employed about 300 workers.
Since its construction, the bridge has been repaired and altered several times, with the original roadway itself now much wider than it once was.
Construction of the bridge in 1935.
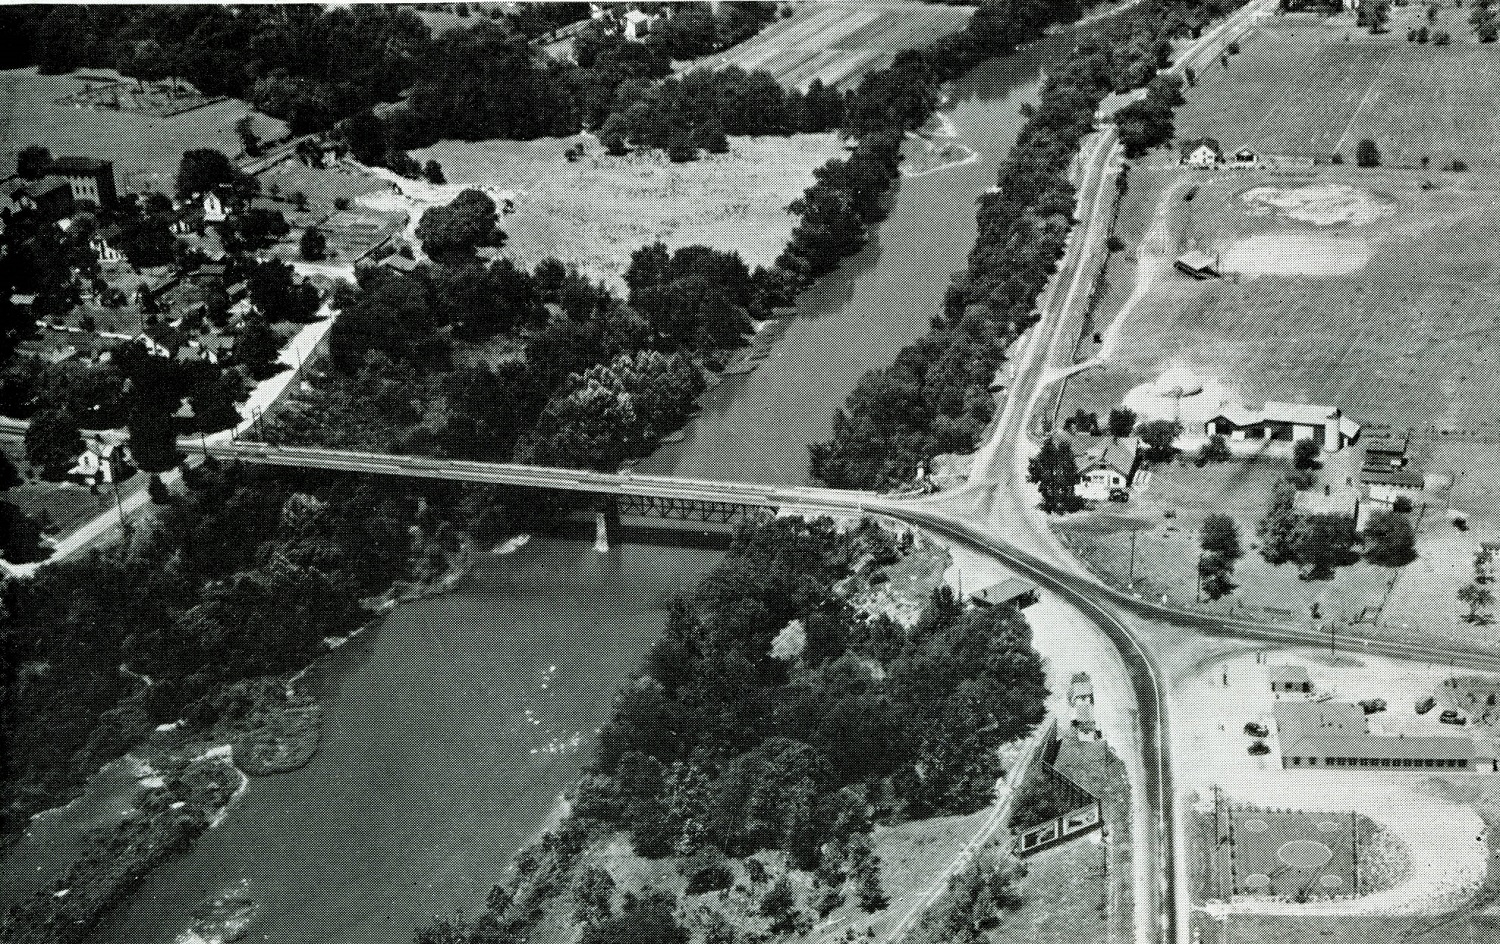
An aerial photo of the old iron bridge taken around 1934.
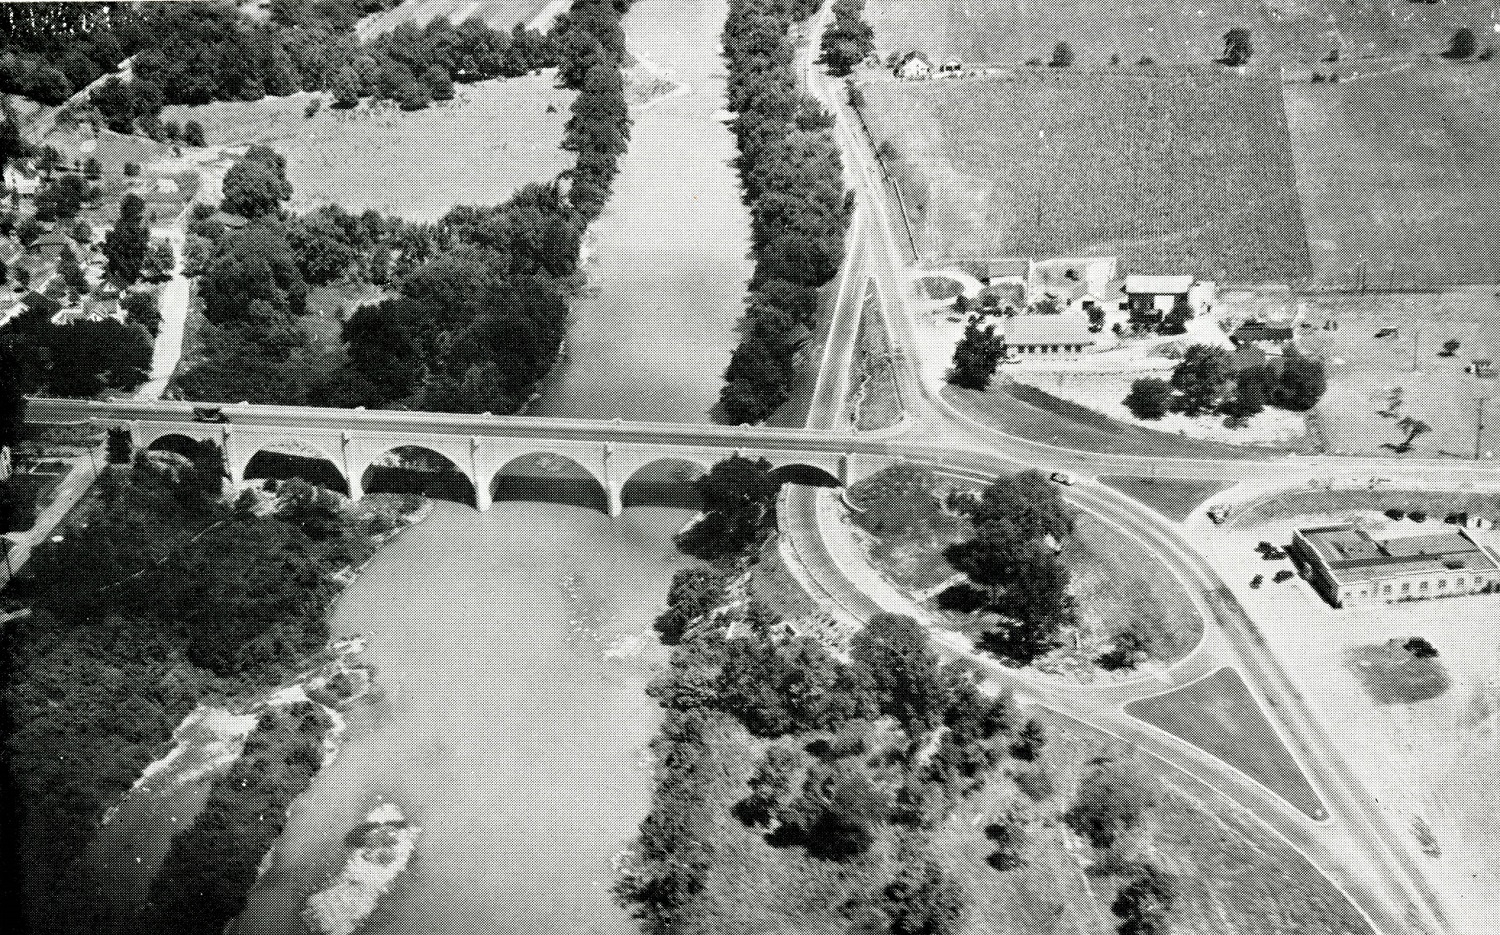
The new bridge around 1937.
The bridge in the present.
Much has changed between the old images and the present one. Long gone are the fields and quieter life of 1930s Dublin.
The popular monthly series continues with the local housing market update March 2021 report. Let’s drill down into the results.
Note: LSD= Local School District, CSD= City School District. In both cases, school district boundaries differ from city boundaries.
Top 15 Most Expensive Locations By Median Sales Price in March 2021 1. New Albany: $652,000 2. New Albany Plain LSD: $523,500 3. Powell: $519,000 4. Upper Arlington CSD: $476,600 5. German Village: $475,550 6. Grandview Heights: $474,000 7. Dublin: $462,000 8. Olentangy LSD: $443,685 9. Buckeye Valley LSD: $420,000 10. Dublin CSD: $419,000 11. Bexley: $413,000 12. Short North: $399,900 13. Granville LSD: $388,500 14. Big Walnut LSD: $384,900 15. Worthington: $358,000
New Albany continued to dominate the top of the market in terms of median sales price, and it wasn’t even close.
Top 15 Least Expensive Locations by Median Sales Price in March 2021 1. Whitehall: $140,100 2. Newark CSD: $146,000 3. Lancaster CSD: $160,500 4. Hamilton LSD: $166,000 5. Groveport Madison LSD: $185,000 6. Jefferson LSD: $185,000 7. Reynoldsburg CSD: $205,250 8. Columbus CSD: $209,718 9. Circleville CSD: $210,000 10. Columbus: $217,000 11. Obetz: $227,420 12. South-Western CSD: $230,000 13. Johnstown-Monroe LSD: $230,000 14. London CSD: $251,000 15. Teays Valley LSD: $253,092
Whitehall remains the area’s biggest bargain. This inner suburb hasn’t always had the best reputation, but the city has been making efforts to improve both its commercial corridors and residential options. Columbus is relatively cheap compared to most of the metro, yet has by far the largest variety of options and neighborhood types to choose from.
Overall Market Median Sales Price in March 2021: $242,550 The overall market is defined by Columbus Metro Area counties.
Top 15 Locations with the Highest Median Sales Price % Growth Between March 2020 and March 2021 1. London CSD: +52.2% 2. Circleville CSD: +44.3% 3. New Albany Plain LSD: +32.5% 4. German Village: +29.4% 5. Obetz: +26.4% 6. Gahanna Jefferson CSD: +26.0% 7. Grandview Heights: +25.4% 8. Powell: +23.9% 9. Upper Arlington CSD: +23.8% 10. Lancaster CSD: +23.7% 11. Jonathan Alder LSD: +23.6% 12. Grove City: +22.0% 13. Gahanna: +21.9% 14. Teays Valley: +21.5% 15. Pickerington LSD: +20.8% 16. Pickerington: +20.8%
Top 15 Locations with the Lowest Median Sales Price % Growth Between March 2020 and March 2021 1. Johnstown Monroe LSD: -25.0% 2. Downtown Columbus: -14.5% 3. Granville LSD: -13.2% 4. Big Walnut LSD: -10.5% 5. Short North: -10.0% 6. Bexley: -6.1% 7. Minerva Park: -5.4% 8. Worthington: -5.0% 9. Hamilton LSD: -3.8% 10. Hilliard: +0.8% 11. New Albany: +1.7% 12. Newark CSD: +4.3% 13. Dublin CSD: +4.6% 14. Hilliard CSD: +5.5% 15. Dublin: +7.5%
Urban areas and some inner suburbs had either the biggest price declines or smallest increases in March vs. March 2020 as the fallout continued from Covid and protest-related activities. These declines may be seen by potential buyers as a positive from the high prices that otherwise continue, however.
Overall Market Median Sales Price % Change March 2021 vs. March 2020: +16.3%
Top 10 Locations with the Most New Listings in March 2021 1. Columbus: 1,156 2. Columbus CSD: 811 3. South-Western CSD: 187 4. Olentangy LSD: 161 5. Hilliard CSD: 138 6. Westerville CSD: 125 7. Dublin CSD: 125 8. Gahanna Jefferson CSD: 78 9. Dublin: 77 10. Upper Arlington CSD: 76
To no surprise, Columbus remains strongly at the top. There were about 300 more new listings in Columbus in March than in February as warmer weather prompted more sellers to put their homes on the market.
Top 10 Locations with the Fewest New Listings in March 2021 1. Valleyview: 0 2. Lithopolis: 2 3. Minerva Park: 2 4. Jefferson LSD: 8 5. Jonathan Alder: LSD: 11 6. Sunbury: 12 7. Grandview Heights: 12 8. Obetz: 12 9. Whitehall: 12 10. German Village: 13
Total New Listings in the Columbus Metro in March 2021: 2,797 Overall Metro New Listings % Change March 2021 vs March 2020: +3.3% The small increase overall was pushed by big increases smaller counties like Perry, Pickaway and Union.
Top 10 Fastest-Selling Locations by # of Days Homes Remain on the Market Before Sale in March 2021 1. Canal Winchester CSD: 3 2. Johnstown-Monroe LSD: 4 3. Minerva Park: 6 4. Hilliard: 7 5. Jefferson LSD: 7 6. Gahanna: 8 7. Groveport Madison LSD: 8 8. Whitehall: 9 9. London CSD: 10 10. Jonathan Alder LSD: 11 11. Marysville CSD: 11 12. South-Western CSD: 11
Top 10 Slowest-Selling Locations by # of Days Homes Remain on the Market Before Sale in March 2021 1. Lithopolis: 59 2. Powell: 55 3. Downtown Columbus: 54 4. Short North: 52 5. Big Walnut LSD: 49 6. Lancaster CSD: 39 7. Olentangy LSD: 38 8. Dublin: 37 9. Grandview Heights: 36 10. Buckeye Valley LSD: 34
Top 10 Locations with the Greatest % Decline of # of Days on the Market Before Sale March 2021 vs March 2020 1. Johnstown-Monroe LSD: -92.7% 2. Canal Winchester CSD: -92.5% 3. Minerva Park: -90.2% 4. Jefferson LSD: -89.9% 5. Sunbury: -85.0% 6. Jonathan Alder LSD: -83.8% 7. New Albany: -81.9% 8. New Albany Plain LSD: -75.5% 9. Marysville CSD: -71.8% 10. Whitehall: -71.0%
Top 10 Locations with the Lowest % Decline of # of Days on the Market Before Sale March 2021 vs March 2020 1. Worthington CSD: +50.0% 2. Worthington: +38.5% 3. Powell: +12.2% 4. Lancaster CSD: +2.6% 5. Hilliard CSD: -4.3% 6. Obetz: -5.3% 7. Short North: -10.3% 8. Newark CSD: -14.3% 9. Downtown Columbus: -23.9% 10. Pataskala: -26.1%
% Change for the # of Days Homes Remain on the Market Before Sale Across the Metro Overall: -24.5%
The market remained hot in March, with faster sales and higher prices than in the previous. Inventory did inch up some as spring arrived, but not nearly enough to counter overall demand. Urban areas are still a bit off their peaks from pre-Covid and protests, but seem to have recovered slightly from some previous months.
The previous housing market report and the Columbus Realtors site offers additional information on the Columbus market.