The 2024 housing market in Columbus was largely one that continued trends of the past several years- generally increasing prices, a shortage of inventory and a quick sales turnaround.
We’ll start this look back by reviewing how the overall metro area and individual county housing markets performed. Total 2024 Home Sales in the Metro Area: 24526
2024 Home Sales % Change in the Metro Area: +3.07%
2024 Metro Area Median Sales Price: $335,555
2024 Metro Area Median Sales Price % Change: +5.34%
Both home sales and median sales prices were up in the overall metro area.
Now let’s look at individual sub-markets within the metro.
First, overall sales.
Next up, here is the median sales price data.
And finally, here are the charts for the fastest and slowest-selling markets in 2024.
If you don’t see data for the market you are looking for, vist the Housing Reports page of the Columbus Realtors site.
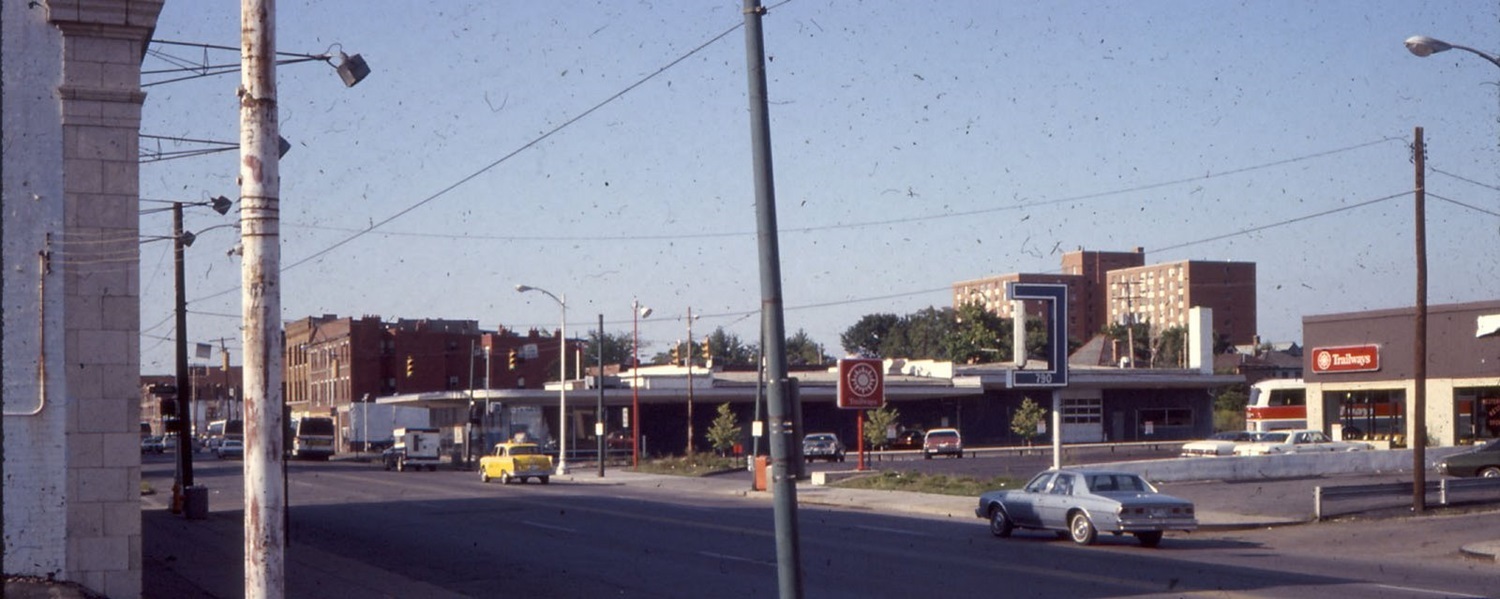
For today’s Random Columbus Photo 12, we don’t go back too far in history, but the before and after are definitely one of the more dramatic comparisons featured so far. Larger versions of both photos are available if you click on them.
Before: N. High Street at Hubbard Avenue looking northeast, around 1980. The Short North by the 1970s was considered a declined neighborhood with significant crime and prostitution problems. Police were called there often, and history tells that it was the police themselves who coined the name of the neighborhood, since it was an area that was just “short of Downtown”. In the photo, you can see buildings at 790 N. High and beyond. At the time, they were a Trailways bus station and some kind of office building. Trailways was eventually replaced by other businesses and restaurants over the years, the last being the restaurant Haiku until it was all demolished for the current hotel building.
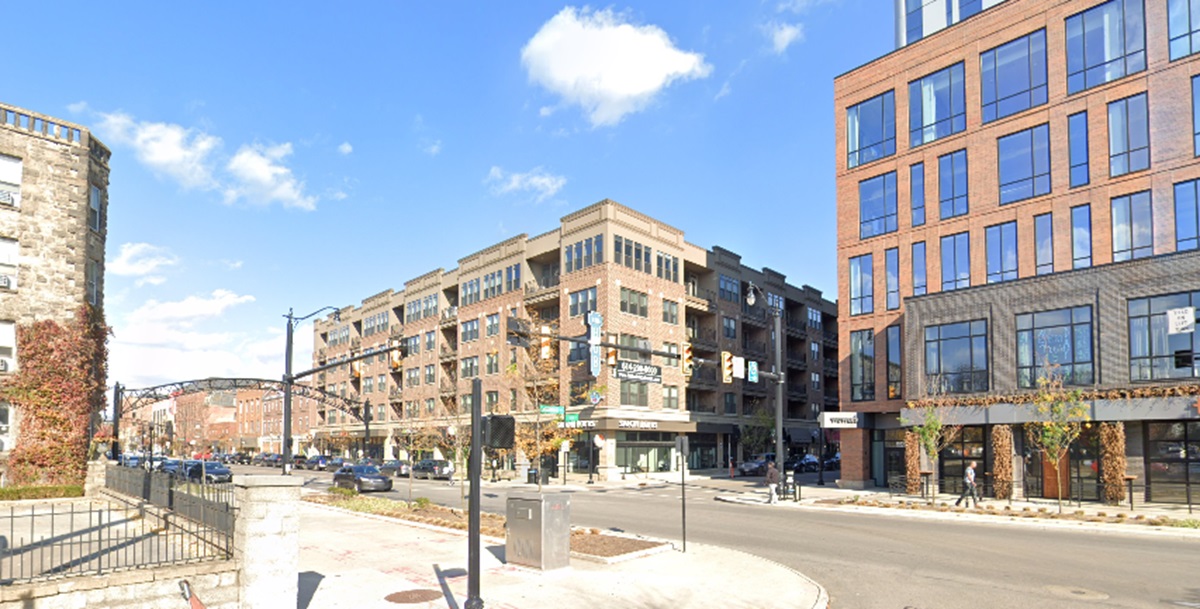
After: The same view in 2024. The picture from 2024 shows a drastically transformed neighborhood. After more than 40 years of renovations, revitalization and construction, the Short North has shed it’s drab and shady past. Crime stubbornly persists despite the improvements, but not nearly to the same degree. The taller apartment building in the older photo was torn down in the 1990s.
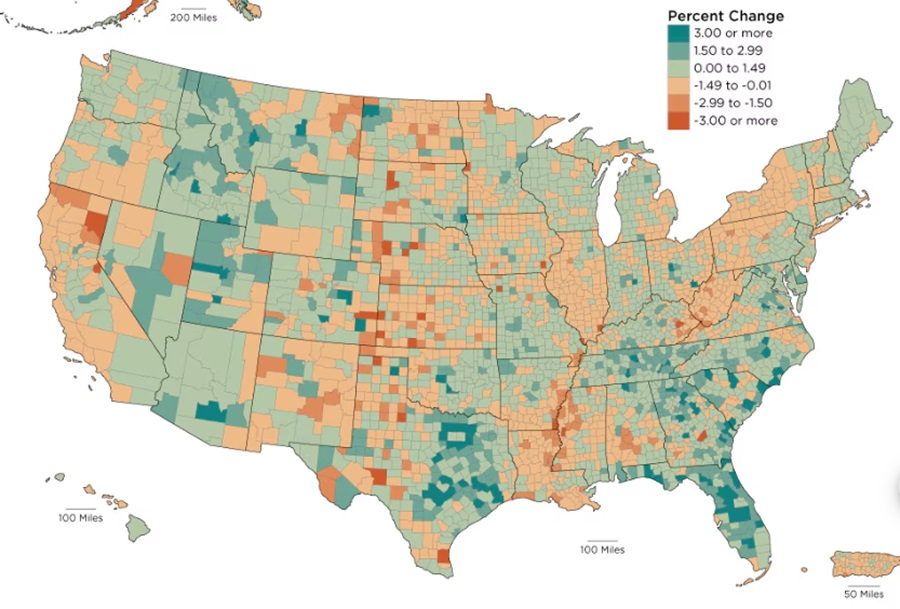
National county map for 2022-2023 population change.
I haven’t done an annual population estimates post since before the 2020 Census. This is because the pandemic- and political actions- screwed up counting quite a bit, and I haven’t felt confident in posting them. The 2023 county and metro population estimates have just been released., and since 3 years have gone by since the census, perhaps some of the kinks have been worked out. That said, the news isn’t all that great for Ohio and Columbus.
Prior to 2020, Franklin County was the fastest-growing county in the state by total growth. Since 2020, it’s fallen to 10th. While that may not seem that bad, only 30 of Ohio’s 88 counties have even seen growth since 2020. On the bright side, Franklin was the only major urban county in the state to see any growth at all. The majority of the 30 counties that saw growth in the state were metro suburban counties, including 8 of the 9 suburban counties within the Columbus Metro Area. Lingering effects of the pandemic are at least partially responsible for this shift, as some people sought to leave highly-populated areas, but wanted to otherwise remain close to core cities. Another factor is likely the ongoing housing shortage. Housing just isn’t getting built in Franklin County like it was before, which is continuing to cause price increases, making the area less affordable than it used to be. Additionally, extreme state politics may be driving some people away- or stopping them from moving locally altogether.
Still, the news isn’t all bad. The total Columbus metro population growth is gradually improving. From 2020-2021, the metro change was +7,986, 2021-2022 it was +14,560, and from 2022-2023, it was +18,205. Still a far cry from the pre-pandemic period when annual totals were 25K-30K. Hopefully, the upward trend continues through the rest of the decade.
Now that we know that overall population change, let’s take a closer look at the specific components of change since 2020.
Top 10 Counties by Natural Change 2020-2023 1. Franklin: +18,738 2. Hamilton: +4,233 3. Delaware: +2,072 4. Holmes: +1,309 5. Union: +662 6. Butler: +652 7. Warren: +650 8. Mercer: +543 9. Putnam: +86 10. Shelby: +67 Incidentally, only these 10 counties saw positive net natural change 2020-2023. That’s a terrible statistic for Ohio’s counties. Columbus’ 3 counties in the top 10 provided more natural change than all other 85 counties combined.
Top 10 Counties by Domestic Change 2020-2023 1. Delaware: +13,998 2. Warren: +7,424 3. Union: +6,011 4. Lorain: +5,969 5. Fairfield: +5,932 6. Licking: +4,592 7. Clermont: +3,117 8. Pickaway: +2,783 9. Miami: +2,433 10. Medina: +2,018 Again, Columbus metro counties- aside from Franklin- do relatively well here, with half of the top 10.
Top 10 Counties by International Migration Change 2020-2023 1. Franklin: +20,391 2. Cuyahoga: +8,557 3. Hamilton: +7,037 4. Butler: +3,551 5. Montgomery: +2,885 6. Summit: +2,593 7. Warren: +1,821 8. Delaware: +1,557 9. Lucas: +1,237 10. Greene: +839 Franklin again leads the pack and is generally doing better annually this decade than before the pandemic, the lone bright spot in the numbers.
Finally, here were the overall metro changes, both for 2022-2023 and 2020-2023.
2023 Total Metro Area Population 1. Cincinnati: 2,271,479 2. Columbus: 2,180,271 3. Cleveland: 2,158,932 4. Dayton: 814,363 5. Akron: 698,398 6. Toledo: 600,141 7. Youngstown: 425,969 8. Canton: 399,474 Columbus continues to leave Cleveland behind and close the gap with Cincinnati.
2022-2023 Metro Area Population Change 1. Columbus: +18,205 2. Cincinnati: +12,854 3. Dayton: +1,649 4. Akron: +887 5. Canton: +3 6. Toledo: -378 7. Youngstown: -679 8. Cleveland: -1,769
2020-2023 Metro Area Population Change 1. Columbus: +41,330 2. Cincinnati: +21,698 3. Dayton: +313 4. Canton: -2,106 5. Akron: -3,827 6. Youngstown: -4,707 7. Toledo: -6,100 8. Cleveland: -26,795
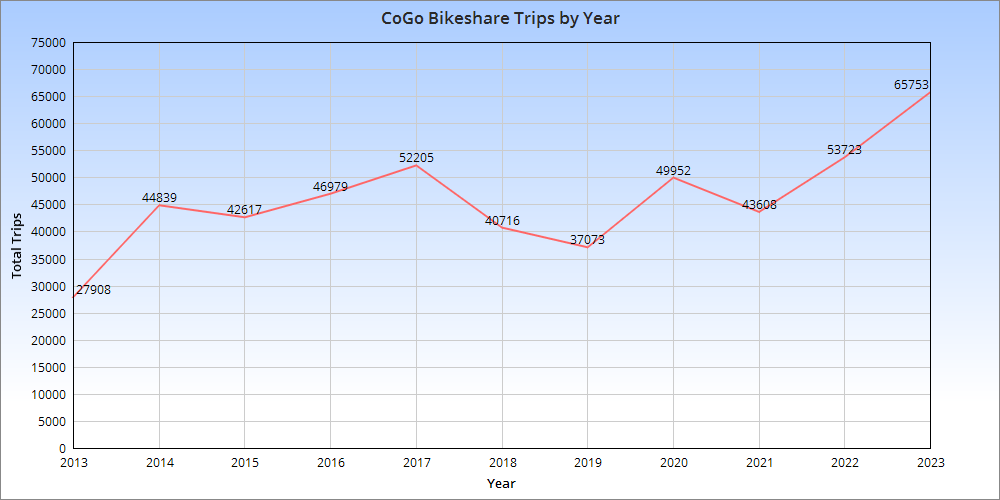
Columbus’ CoGo bike share system has been in operation since July, 2013. After a decade of ups and downs, the system seems to be finally hitting its stride.
As the chart above shows, total CoGo trips were generally up between 2013-2017, and then saw a fairly steep decline 2018-2019. It’s unclear what caused that decline, but everything from system disruptions to weather could have played a role. Regardless, the pandemic, protests and general chaos of 2020 didn’t seem to matter as total trips for the year rebounded strongly. After another down year in 2021, 2022 saw CoGo’s highest ridership since the system opened, and 2023 continued that trend by blowing out 2022’s record. There were an extra 33 trips per day in 2023 vs. 2022, which added up to more than 12,000 more for the year. Hopefully, the increase in ridership will prompt another expansion of the system into new areas soon. And some actual protected bike lanes would be nice, as Columbus- to date, anyway- has been less than stellar on this issue.
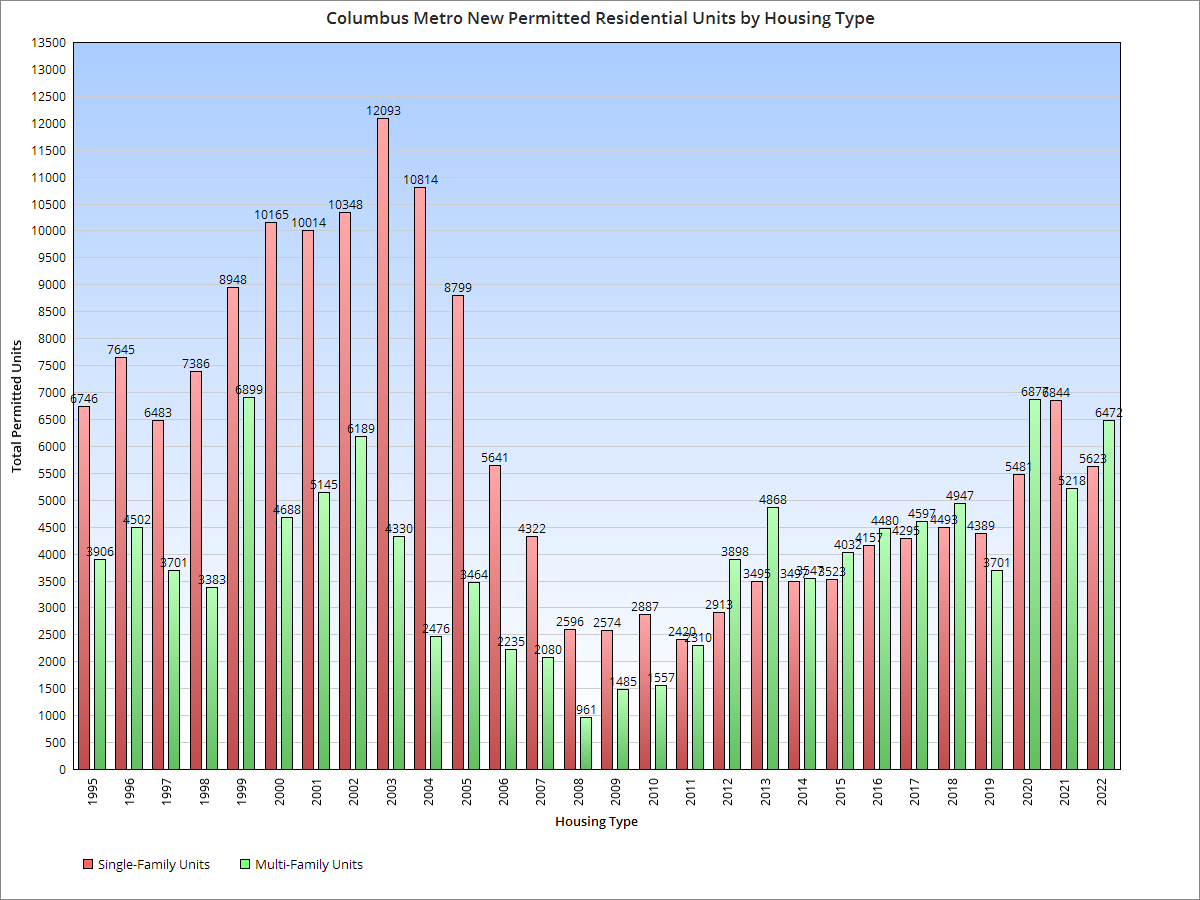
I talked about housing permits before- almost a decade ago now- and thought it would be a good time to update and expand the information. The following graphs detail Columbus area housing permits as they pertain to new residential units being permitted for construction.
Up first, the below graph shows all permitted units by type for the entire metro area since 1995. What most stands out about the graph is how single-family construction dominated until the late 2000s. When the Great Recession hit, it completely changed that dynamic. Since then, multi-family units have mostly been on top in most years, perhaps because more money could be made with them with less financial risk.
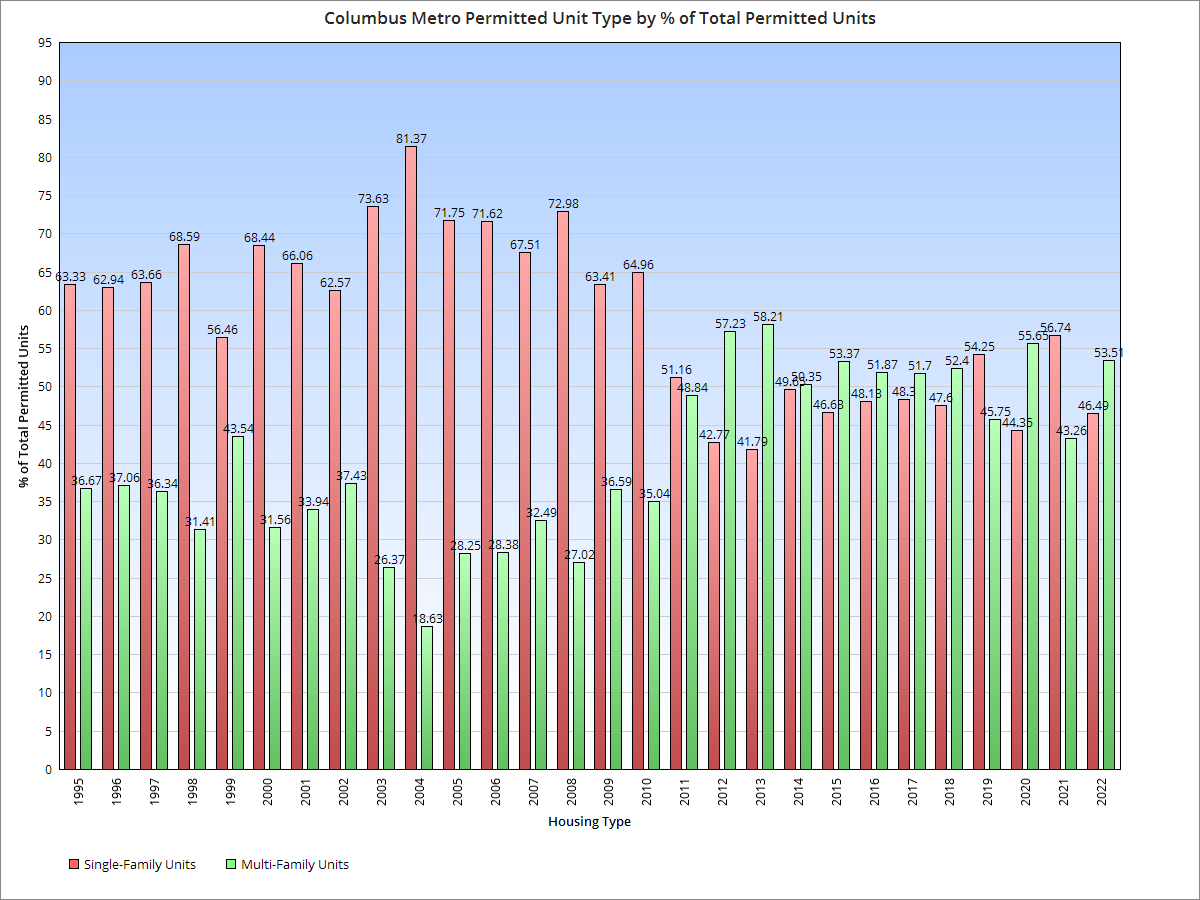
Here is the permitted housing type as a % of total permitted units. Between 1995-2010 the average breakdown was 67.46% Single-Family and 32.54% Multi-Family. Since 2010, the breakdown has been 48.16% Single-Family and 51.84% Multi-Family, representing a full 38.6-point margin change towards Multi-Family.
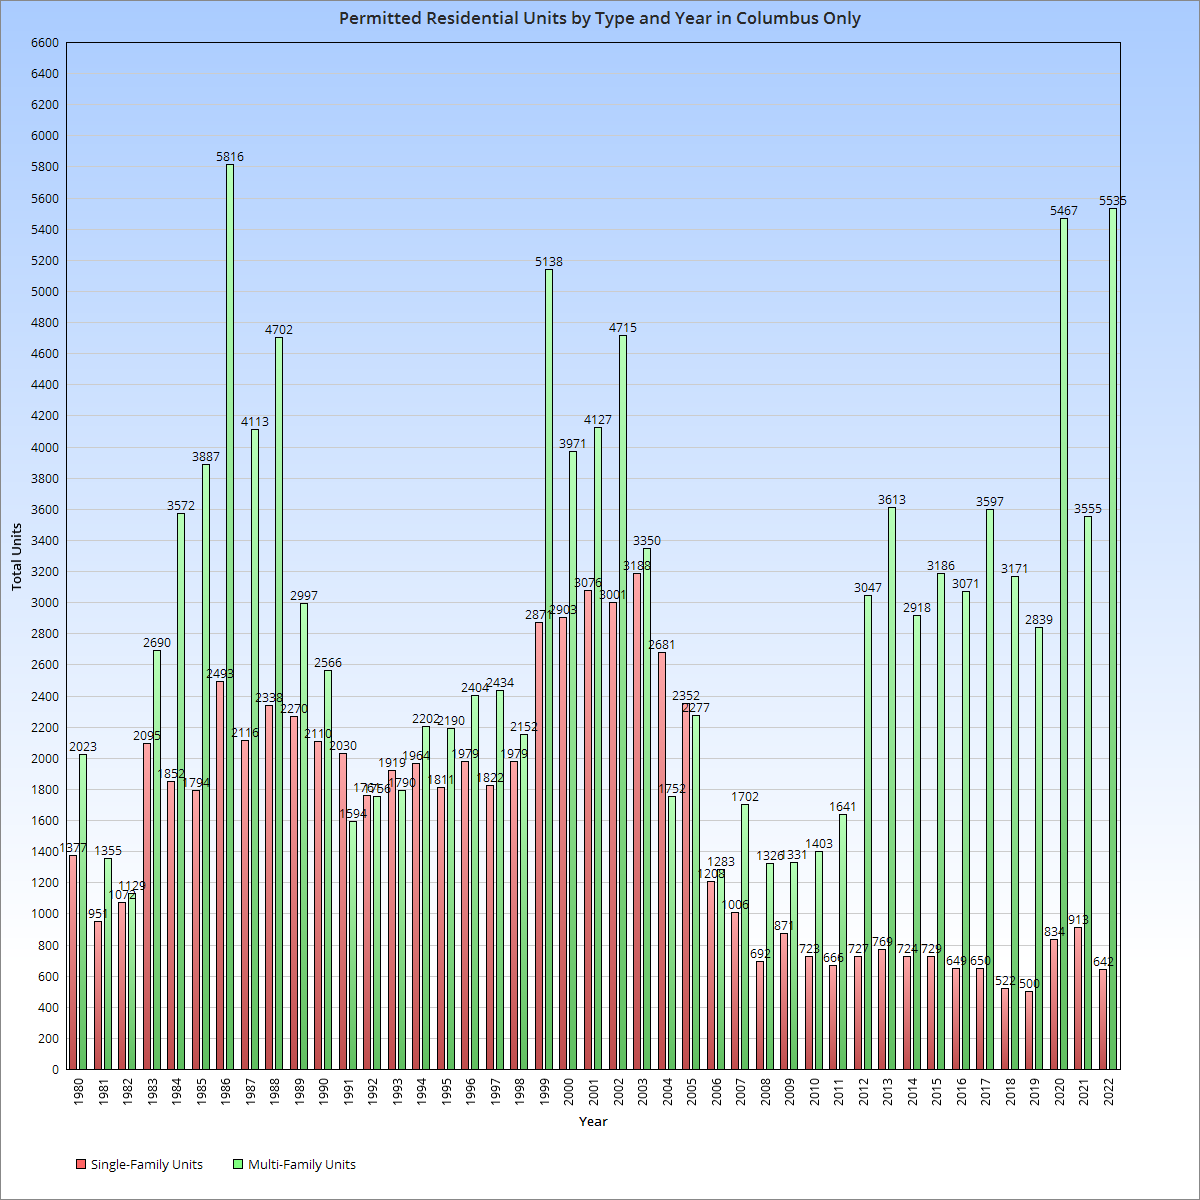
But what about what is actually getting permitted within just the city of Columbus, rather than the entire metro? City-exclusive data is available going back to 1980. The city experienced the same shift as the overall metro, but much more drastically.
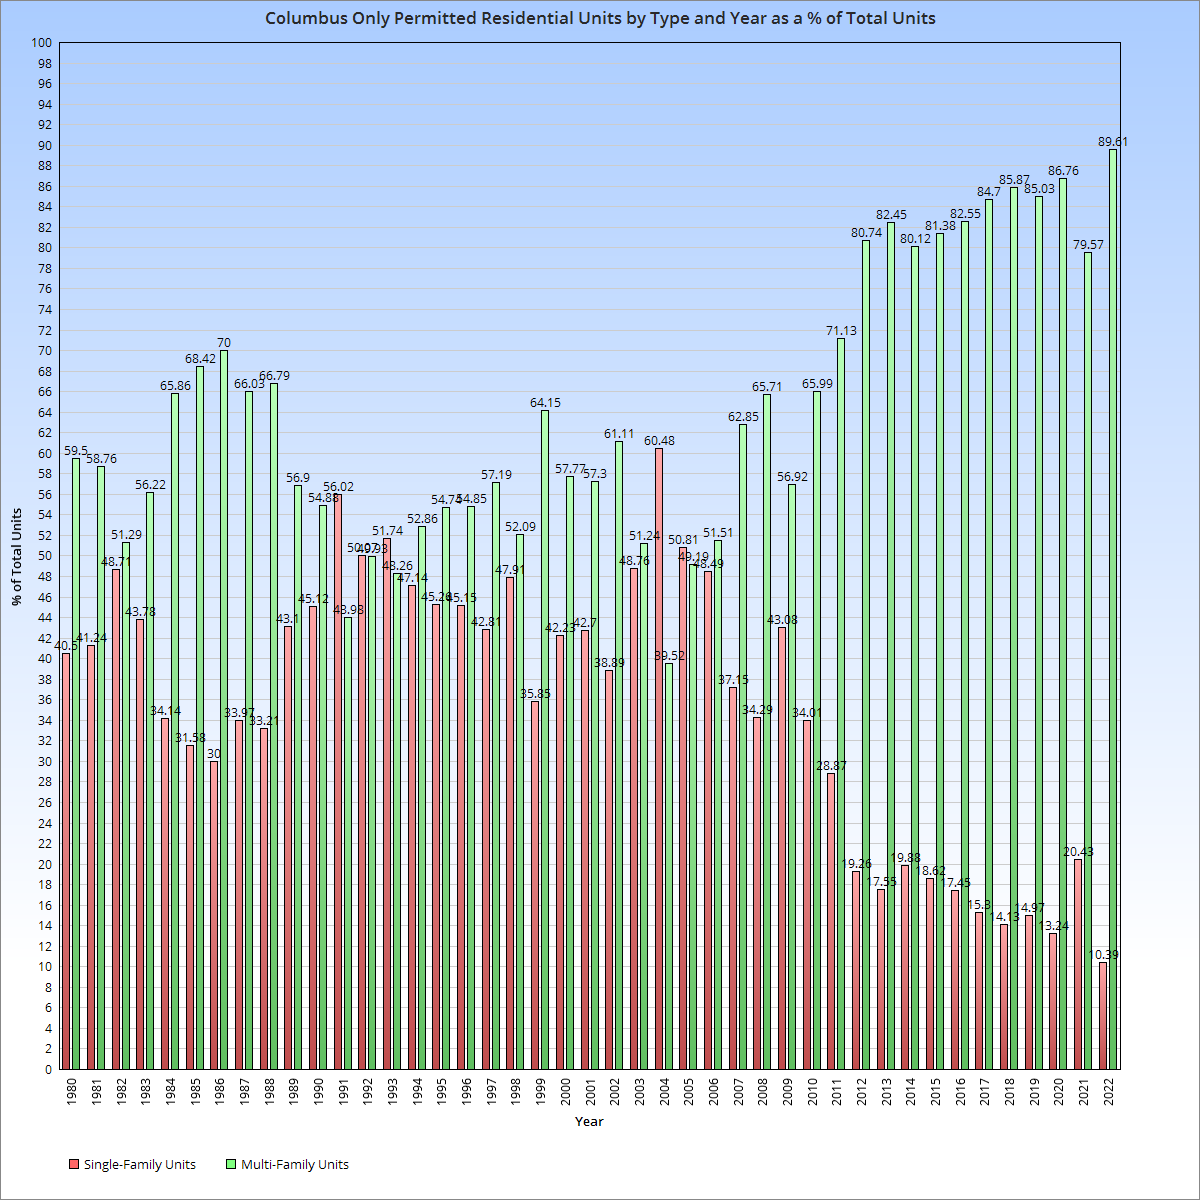
The % of total units by type for the city shows that single-family housing has been steadily becoming a smaller part of new construction permits since around 2003.
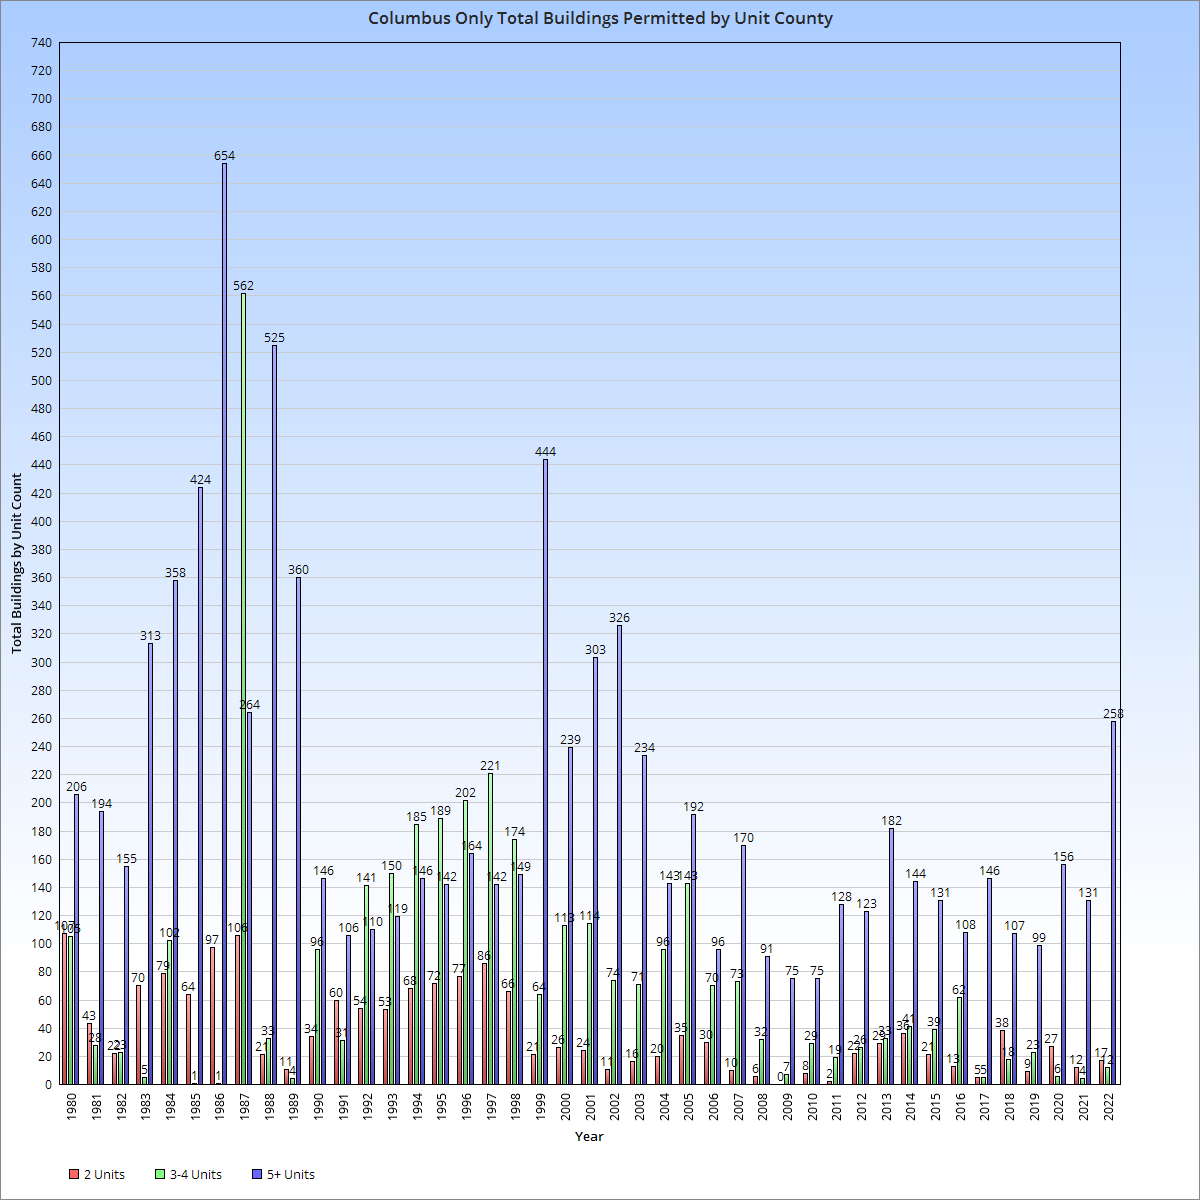
Finally, let’s break down multi-family permits by total number of buildings per unit count for the city only. Except for during the 1990s, 5+-unit buildings have been dominant, but it seems that fewer overall buildings are being built despite total units being high, suggesting that project size has increased over the years.