In a first of its kind, this is the Columbus housing market update for December 2012. In it, the local housing market will be detailed by categories such as most expensive market, market listing rankings and more.
Note: LSD= Local School District, CSD= City School District. In both cases, school district boundaries differ from city boundaries.
Top 15 Most Expensive Locations By Median Sales Price in December 2012 1. New Albany: $535,000 2. New Albany Plain LSD: $397,450 3. German Village: $376,000 4. Grandview Heights: $362,500 5. Powell: $354,950 6. Dublin: $343,600 7. Granville CSD: $330,000 8. Bexley: $325,000 9. Upper Arlington CSD: $319,500 10. Olentangy LSD: $315,000 11. Big Walnut LSD: $306,250 12. Dublin CSD: $271,500 13. Worthington: $$270,000 14. Buckeye Valley LSD: $259,000 15. Sunbury: $253,000
New Albany was by far the most expensive local market around Columbus.
Top 15 Least Expensive Locations by Median Sales Price in December 2012 1. Obetz: $80,100 2. Hamilton LSD: $80,100 3. Whitehall: $85,950 4. Newark CSD: $86,900 5. Lancaster CSD: $103,000 6. Jefferson LSD: $123,000 7. London CSD: $124,000 8. Groveport Madison LSD: $125,900 9. Reynoldsburg CSD: $125,950 10. Columbus CSD: $129,900 11. South-Western CSD: $131,000 12. Columbus: $140,026 13. Jonathan Alder LSD: $150,000 14. Minerva Park: $159,500 15. Grove City: $160,950
Southern and eastern suburbs tend to perform best on this list, as well as Columbus itself.
Overall Market Median Sales Price in December 2012: $158,645
Top 15 Locations with the Highest Median Sales Price % Growth Between December 2011 and December 2012 1. Whitehall: +69.5% 2. Circleville CSD: +64.9% 3. Sunbury: +63.0% 4. Jefferson LSD: +53.5% 5. Big Walnut LSD: +44.1% 6. Canal Winchester CSD: +40.9% 7. Westerville: +29.8% 8. Westerville CSD: +27.3% 9. Powell: +25.4% 10. Pataskala: +24.0% 11. Olentangy LSD: +23.5% 12. Gahanna Jefferson CSD: +21.8% 13. Grandview Heights: +21.2% 14. Granville CSD: +20.0% 15. Pickerington: +17.7%
Top 15 Locations with the Lowest Median Sales Price % Growth Between December 2011 and December 2012 1. London CSD: -53.5% 2. Obetz: -38.3% 3. Hamilton LSD: -27.1% 4. Jonathan Alder LSD: -25.2% 5. Buckeye Valley LSD: -23.0% 6. Reynoldsburg CSD: -18.7% 7. Hilliard: -17.7% 8. Lancaster CSD: -17.6% 9. Grove City: -15.3% 10. Dublin CSD: -12.8% 11. Johnstown Monroe LSD: -10.8% 12. Upper Arlington CSD: -8.5% 13. Newark CSD: -8.1% 14. Dublin: -7.1% 15. South-Western CSD: -6.4%
Overall Market Median Sales Price % Change December 2011 vs. December 2012: -0.3%
Top 10 Locations with the Most New Listings in December 2012 1. Columbus: 829 2. Columbus CSD: 544 3. South-Western CSD: 136 4. Olentangy LSD: 122 5. Westerville CSD: 100 6. Hilliard CSD: 94 7. Dublin CSD: 89 8. Worthington CSD: 66 9. Dublin: 64 10. Pickerington LSD: 60
Top 10 Locations with the Fewest New Listings in December 2012 1. Valleyview: 0 2. Lithopolis: 1 3. Sunbury: 2 4. Minerva Park: 2 5. Obetz: 3 6. Johnstown Monroe LSD: 5 7. Jefferson LSD: 8 8. German Village: 8 9. Hamilton LSD: 8 10. Whitehall: 11 11. Granville CSD: 12
Total New Listings in the Columbus Metro in December 2012: 2,002 Overall Metro New Listings % Change December 2011-December 2012: +10.5%
Overall, prices are slightly down as supply is currently outstripping demand.
For more information on the local market, go here: Columbus Realtors
2008 was a year of extreme weather events, but aside from the March Blizzard, the biggest story of the year was its severe wind events. Let’s take a look back at these events, but particularly at the Hurricane Ike disaster.
January 8th-9th Severe Weather Record warm temperatures in the upper 60s on the 7th-8th of January, 2008 gave way to storms and even a rare January Tornado Watch on the evening of the 8th. Winds had been gusty all during the day of the 8th, but reached their peak with the frontal passage storms. Rain and thunderstorms began moving into Ohio during the late afternoon and increased in intensity through the evening, prompting the NWS to issue a Tornado Watch just after 10pm. Although no tornadoes were reported anywhere in Ohio on the night of the 8th-9th, the storms brought with them rains of 1-2″ and winds of up to 70mph, causing many reports of minor structural damage and scattered power outages.
January 29th-30th Windstorm The second, more intense wind event for January in Ohio came during the last few days of the month. A very strong low pressure moved north and west of Ohio as strong high pressure moved south into the Plains. The resulting gradient caused winds to increase. Winds were sustained between 30-35mph most of the 29th. When the front arrived during the evening hours, winds ramped up even more, with winds sustained at 40-45 with gusts between 60-70mph. There was very little precipitation with this front. Reports of the event showed widespread high winds and minor to moderate damage in spots. On a personal note with this event, I witnessed several power poles bent over and large business signs blown out from the force of the January 29th-30th wind event.
Hurricane Ike and Ohio’s Worst Windstorm On September 1st, 2008, a tropical depression formed in the central Atlantic Ocean. That same day, the depression strengthened enough to gain a name: Ike. No one in Ohio anticipated that this storm, far out in the Atlantic, would cause the most widespread, destructive windstorm the state had ever seen.
Ike gradually became a hurricane and roared west and then southwest over Cuba as a Category 4 before turning back to the northwest and into the Gulf of Mexico. He churned westward growing in size as he went. The wind field of the hurricane was gigantic. Hundreds of miles from the center, tropical storm force winds were pounding parts of the Gulf Coast, giving an indication of the long-duration wind and surge potential.
Hurricane Ike made landfall near Galveston, Texas early on Saturday, September 13th with maximum sustained winds of 110mph. After landfall, the system turned to the north and then to the northeast as it hooked up with a frontal boundary that was draped across the Midwest. The system became extratropical by the end of the day on the 13th and gradually accelerated to the north and east towards the Great Lakes.
Now, at this point, that would normally be the end of the story. A dying tropical system far inland tends to produce a lot of rain and flooding, but wind is not usually an issue. And indeed, parts of Indiana, Missouri, and Illinois saw major and disastrous flooding from a combination of the frontal boundary and the remains of Ike. However, a very unusual situation occurred.
Over the Gulf of Mexico and up through landfall, Ike was never quite able to translate upper level high winds down to the surface. The sustained reading of 110mph at landfall never seemed to actually materialize in reports on the ground, and the vast majority of the damage along the Texas coastline was due to significant storm surge brought in by the massive size of the storm. However, Ike’s inability to translate the highest winds to the surface was about to change.
Ike maintained a very low pressure of between 986 and 990 throughout the journey through the OV and Great Lakes, and as he transitioned from tropical to extratropical, the remains actually intensified and Ike retained a large amount of his original wind field, particularly on the eastern side.
No one forecasted this. The NWS, as late as Saturday evening, had forecast winds of 30mph in gusts for much of Ohio and for the Columbus area, as seen in the September 13th forecast below.
OHZ045-046-054>056-140830- UNION OH-DELAWARE-MADISON-FRANKLIN OH-LICKING- INCLUDING THE CITIES OF…MARYSVILLE…DELAWARE…LONDON… COLUMBUS…NEWARK 404 PM EDT SAT SEP 13 2008
.TONIGHT…PARTLY CLOUDY THIS EVENING…THEN BECOMING MOSTLY CLOUDY. SCATTERED SHOWERS AND THUNDERSTORMS. LOWS IN THE LOWER 70S. SOUTHWEST WINDS 10 TO 15 MPH. CHANCE OF RAIN 30 PERCENT. .SUNDAY…PARTLY SUNNY IN THE MORNING…THEN BECOMING MOSTLY CLOUDY. A CHANCE OF THUNDERSTORMS. A CHANCE OF SHOWERS IN THE MORNING…THEN SHOWERS LIKELY IN THE AFTERNOON. HUMID WITH HIGHS IN THE UPPER 80S. SOUTH WINDS 15 TO 20 MPH WITH GUSTS UP TO 30 MPH. CHANCE OF RAIN 70 PERCENT. .SUNDAY NIGHT…THUNDERSTORMS IN THE EVENING. SHOWERS. BREEZY WITH LOWS IN THE LOWER 60S. SOUTHWEST WINDS 15 TO 25 MPH… BECOMING WEST 10 TO 15 MPH AFTER MIDNIGHT. CHANCE OF RAIN 90 PERCENT.
Just 12 hours after the above forecast was made, on the morning of Sunday, September 14th, 2008, the National Weather Service in Wilmington had issued a Wind Advisory for its forecast area calling for gusty winds of 20-30mph with gusts up to 40mph.
URGENT – WEATHER MESSAGE NATIONAL WEATHER SERVICE WILMINGTON OH 423 AM EDT SUN SEP 14 2008 …WIND ADVISORY IN EFFECT THIS AFTERNOON INTO THIS EVENING… .THE REMNANTS OF HURRICANE IKE WILL COMBINE WITH A QUICK MOVING COLD FRONT TO BRING WINDY CONDITIONS TO THE REGION TODAY. WAYNE-FAYETTE IN-UNION IN-FRANKLIN IN-RIPLEY-DEARBORN-OHIO- SWITZERLAND-CARROLL-GALLATIN-BOONE-KENTON-CAMPBELL-OWEN-GRANT-PENDLETON-BRACKEN-ROBERTSON-MASON-LEWIS-HARDIN-MERCER-AUGLAIZE-DARKE-SHELBY-LOGAN-UNION OH-DELAWARE-MIAMI-CHAMPAIGN-CLARK-MADISON-FRANKLIN OH-LICKING-PREBLE-MONTGOMERY-GREENE-FAYETTE OH-PICKAWAY-FAIRFIELD-BUTLER-WARREN-CLINTON-ROSS-HOCKING-HAMILTON-CLERMONT-BROWN-HIGHLAND-ADAMS-PIKE-SCIOTO- 423 AM EDT SUN SEP 14 2008 …WIND ADVISORY IN EFFECT FROM NOON TODAY TO 9 PM EDT THIS EVENING… THE NATIONAL WEATHER SERVICE IN WILMINGTON HAS ISSUED A WIND ADVISORY…WHICH IS IN EFFECT FROM NOON TODAY TO 9 PM EDT THIS EVENING. THE REMNANTS OF HURRICANE IKE WILL COMBINE WITH A QUICK MOVING COLD FRONT TO BRING WINDY CONDITIONS TO THE REGION TODAY. SURFACE WINDS WILL BEGIN TO INCREASE THIS MORNING…WITH SUSTAINED SOUTH WINDS OF 25 TO 35 MPH AND GUSTS ABOVE 40 MPH EXPECTED BY THIS AFTERNOON. THE STRONG WINDS WILL CONTINUE THROUGH THE AFTERNOON AND INTO THE EARLY EVENING UNTIL A COLD FRONT PASSES THROUGH THE REGION. A WIND ADVISORY IS ISSUED WHEN SUSTAINED WINDS ARE FORECAST TO BE 31 TO 39 MPH OR GUSTS WILL RANGE BETWEEN 46 AND 57 MPH. WINDS OF THESE MAGNITUDES MAY CAUSE MINOR PROPERTY DAMAGE WITHOUT EXTRA PRECAUTIONS. MOTORISTS IN HIGH PROFILE VEHICLES SHOULD USE CAUTION UNTIL THE WINDS SUBSIDE.
However, even the wind advisory quickly became obsolete. Kentucky was already getting rocked with high winds of over 50mph, and the winds seemed to intensify even more as the core began to move into Ohio through Cincinnati.
By late morning, winds in Cincinnati had reached a *sustained* speed of 54mph with gusts to hurricane force! These heavy winds began to ride up the I-71 corridor, reaching Wilmington by noon and Columbus by 2pm. Wilmington didn’t upgrade its advisory to a High Wind Warning until 12:49PM, when parts of the state were already getting walloped by damaging winds. For several hours, high winds pounded the area. Sustained winds over 50mph were common, and gusts of 70-80mph were widespread. The winds did not begin to die down until after 6pm, and by 8pm, the area had gone almost completely calm. There had been almost no precipitation whatsoever during the entire event.
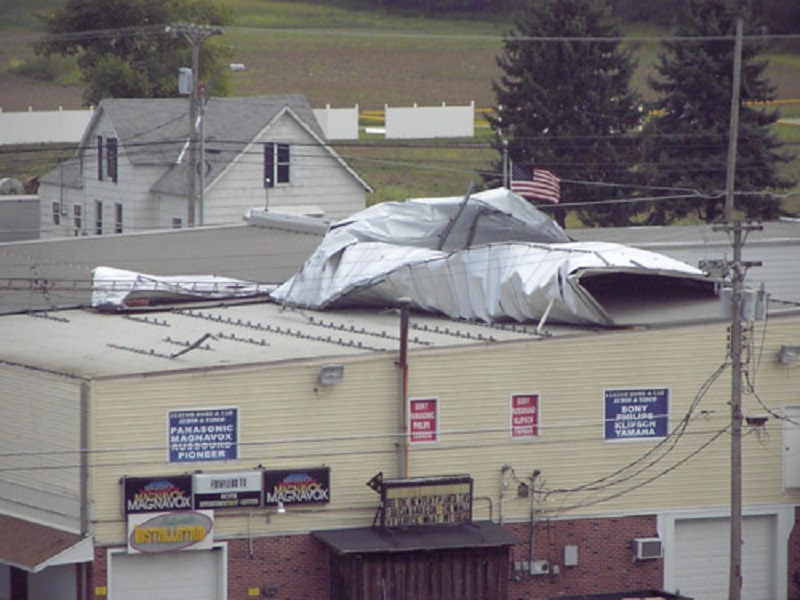
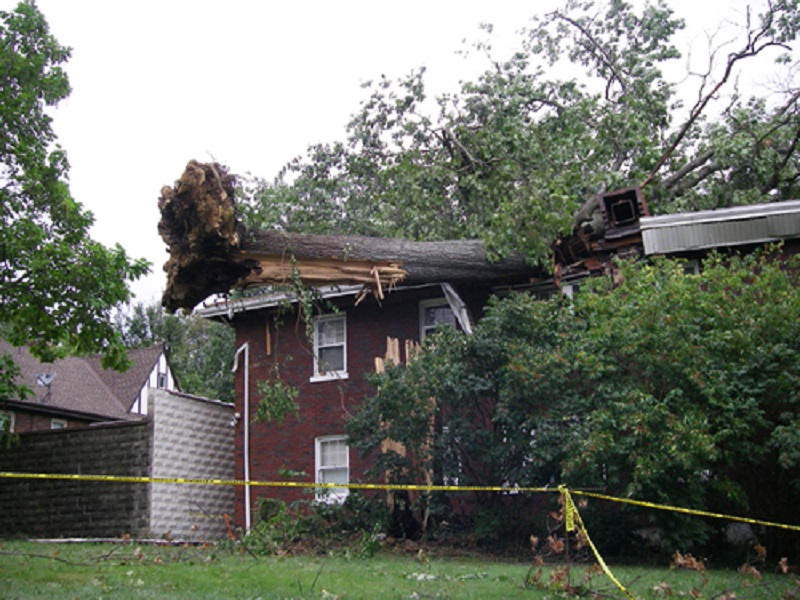
When the storm was over, more than 2.5 million Ohio residents were without power, including more than 55% of Columbus, one of the largest outages ever known in state and local history. Tens of thousands of trees had fallen and debris of all kinds was everywhere. Power lines had been snapped, signs had been blown down, billboards had been destroyed, and thousands of homes and buildings had sustained damage from broken windows to siding and parts of roofs blown off. Power remained out for thousands for up to two weeks after the storm passed, and there was a sea of blue tarps covering roofs throughout Central Ohio for months.
The story was the same up and down I-71 up through Cleveland, although damage there was less than that in central and southern parts of Ohio. The severe wind field was about 100 miles across and centered through the major cities on I-71. Insured losses from this storm totaled well over a billion dollars, and total damage was at least double that figure. This made the storm one of the most damaging natural disasters in Ohio history, exceeding those like the Blizzard of 1978, the 1974 Xenia Tornado and perhaps even the Great Flood of 1913 in adjusted dollars. Additionally, 7 people lost their lives in the storm.
Highest Wind Gusts in Ohio on 9/14/2008 Highest measured wind gusts — official observations 75 mph — Port Columbus International Airport (Franklin County, OH) 74 mph — Cincinnati-Northern Kentucky Int’l Airport (Boone County, KY) 74 mph — Airborne Airpark, Wilmington, OH (Clinton County, OH) 69 mph — Bolton Field (Franklin County, OH) 69 mph — Rickenbacker Airport (Franklin County, OH) 68 mph — Dayton-Wright Brothers Airport (Montgomery County, OH) 63 mph — OSU Airport (Franklin County, OH) 61 mph — Cincinnati Lunken Municipal Airport (Hamilton County, OH) 60 mph — Dayton International Airport (Montgomery County, OH) 59 mph — Wright-Patterson Air Force Base (Greene County, OH)
As in most cases, recording equipment only captured a small snapshot of actual winds, with many areas seeing higher gusts than were officially recorded by instruments. Overall, the highest wind gusts and sustained winds on September 14, 2008 were not the highest ever recorded in Columbus and other places, but they were generally in the top 5. However, previous events had generally been recorded during severe thunderstorms, and so were rather brief in duration. That September day, winds roared at top strength for 3-5 hours, allowing the damage to be far more widespread than it would’ve been in a thunderstorm. Therefore, it stands as one of the worst wind events in Ohio history.
Videos from around Ohio on 9/14/2008 Columbus
Cincinnati
Dayton
Elsewhere
Weather events like this are truly rare, but history is full of severe weather of all types across the Columbus area. Weather History provides links to all sorts of records and event descriptions.
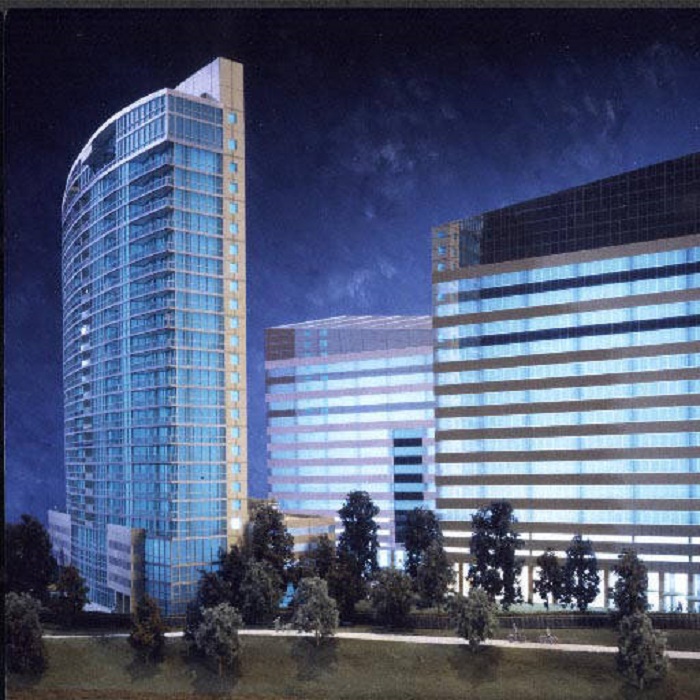
On November 16, 1995, Developer Ron Pizzuti announced plans for a residential and office complex on the Scioto River shore on the southwestern edge of Downtown, a project that would eventually become Miranova Tower. In 1995, this area was a large vacant lot and a handful of small buildings. Originally, the $150 million plan called for replacing this whole area with two 25-story condominium towers, 14 luxury townhomes on the river, a 5-story office building and a pair of restaurants, all with construction to begin in 1996. 200 residential units were planned for the towers. This was all supposed to be part of a new series of Downtown developments including a new COSI, a new soccer stadium across the river on the Scioto Peninsula and a residential development on the Whittier Peninsula west of the Brewery District.
On May 12th, 1996, it was reported that the project would not actually break ground until sometime in 1997, already another year later than originally planned. The two towers remained on the agenda, as did the townhomes and restaurants, but the office building had gained a floor and would now be 6 stories.
By July 8th, 1996, the project had gotten larger still. The # of townhomes had more than doubled to 30 and the office building had risen to 7 stories.
On December 16, 1996, the office building once again grew, this time to 8 stories.
By February 4, 1997, the number of towers had fallen to just one, and mention of townhomes had disappeared, yet the price tag remained $150 million.
Further changes came on December 12, 1997. The single tower would be 28 stories and the office tower had grown to 16 stories. Groundbreaking was pushed back to sometime in 1998.
February 11, 1998, still a single 28 story condo tower, but now two 16-story office towers.
May 8, 1998, and back to just one office tower. Still no groundbreaking.
September 19, 1998, more changes. Condo tower down to 26 stories and the office building down to 15. But work has begun on pouring foundations
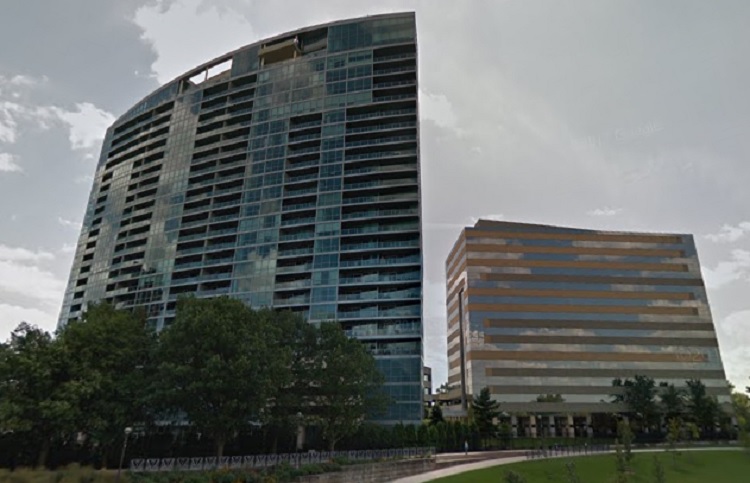
Miranova condo tower was completed in the early spring of 2000. By July, 79 of the 112 condos had sold. The office building, down to a final height of 12 stories, would not be finished until 2001. The last condo sale would not happen for several years, as the 2000s saw the market crash for these residences.
Miranova Project Stats Began Construction in 1999 Completed in 2001 Cost: $150 Million Height: 26 Stories # of Residential Units: 112
Completed projects going back to the 19th Century, as well as new proposals, can be found at the Columbus Development links page. New proposals happen all the time, and you can follow the process for many of them on the Columbus Area Commissions website.
Is Columbus getting younger? This article America’s Baby Boom and Bust Cities from New Geography suggests… maybe. It was one of only two Midwestern cities (the other being Indianapolis) that saw its population of people aged 15 and younger grow from 2000-2010, and actually scored at #18 for the best growth in this catergory in the 51 largest metros. The 15 and younger population grew by almost 32,000, or 9.2%. Columbus has long been a young city, especially within Ohio, where the median age is almost 37, higher than the national average. In 2010, Columbus’ median age was just 31.4. Should its young population continue to rise, that median age may actually drop over time. It’s long been established that younger cities tend to do better economically and with growth, while aging cities tend to see sustained decline, so this is good news for Columbus’ future.
Age Demographics for the City of Columbus 2000-2010 Under 5 2000: 52,638 7.4% 2010: 61,122 7.7% 5 to 14 2000: 95,251 13.4% 2010: 99,143 12.6% 15 to 24 2000: 122,768 17.3% 2010: 133,796 16.9% 25 to 34 2000: 139,327 19.6% 2010: 147,584 18.7% 35 to 44 2000: 112,361 15.8% 2010: 110,342 14.0% 45 to 54 2000: 80,668 11.3% 2010: 97,782 12.4% 55 to 64 2000: 45,949 6.5% 2010: 74,265 9.4% 65 to 74 2000: 33,718 4.7% 2010: 35,816 4.5% 75 and Over 2000: 28,964 4.1% 2010: 30,089 3.8%
Age Demographics for the Metropolitan Area 2000-2010 Under 5 2000: 115,002 7.1% 2010: 127,350 6.9% 5 to 14 2000: 233,018 14.4% 2010: 253,211 13.8% 15 to 24 2000: 233,784 14.5% 2010: 264,784 14.4% 25 to 34 2000: 256,992 15.9% 2010: 270,931 14.7% 35 to 44 2000: 270,406 16.8% 2010: 260,069 14.1% 45 to 54 2000: 213,906 13.3% 2010: 265,770 14.4% 55 to 64 2000: 127,707 7.9% 2010: 202,911 11.0% 65 to 74 2000: 89,876 5.6% 2010: 109,390 5.9% 75 and Over 2000: 72,003 4.5% 2010: 86,215 4.7%
The Scioto Peninsula project is an in-planning-stage development that promised to be hugely transformational for both Downtown and all of Franklinton.
The history of the Scioto Peninsula in not really all that positive. Bounded by 315 to the west and on all other sides by the Scioto River directly across from Downtown, this area currently contains Veteran’s Memorial, COSI and not much else. Even as far back as the 1950s, a large chunk of the peninsula, especially around Central High School (which still exists as COSI), was just vacant land. Otherwise, what existed were warehouse buildings and other commercial buildings. What people lived there were mostly confined to a few public housing projects. Being so close to the Scioto River, the area repeatedly flooded over its history, especially in the Great Flood of 1913 and to a lesser extent in 1959. This prevented much development here and in Franklinton in general. Federal standards were actually in place that banned most new construction or even renovations to most types of buildings. This allowed all of Franklinton, including the Peninsula, to stagnate and go through steady decline.
Help was coming, however, in the form of a giant floodwall. Conceived as far back as the 1980s, the Franklinton Floodwall would not be completed until 2004. It took another 4-5 years before people began to seriously look at the area for redevelopment and then for that development to actually start taking place. Eastern Franklinton, so far, has been the focal point of that redevelopment, and a big project to help tie in Downtown with the neighborhood is the planned redevelopment of the Peninsula.
Almost all the buildings that existed in the ’50s are now gone, even the housing projects. COSI uses much of the land for parking, as does Veteran’s Memorial. The rest is grassy lots primed for redevelopment. Some projects have already taken place. The two new Downtown bridges at Main and Rich Streets provide a nice access onto the Peninsula, along with the Broad Street bridge. A 4th, a planned pedestrian bridge, will be located on the north end crossing from Vet’s Memorial to North Bank Park in the Arena District. This bridge is probably still a few years off, as there is another, large project planned. The low-head dams along the Scioto River in the Downtown area are going to be removed, starting sometime next year. This will lower the river level and create a more natural flowing waterway. It will also create acres of new riverfront parkland that new paths and landscaping will be added to. This will create an inviting, park setting to both sides of the river.
The Peninsula has been planned for redevelopment several times in the last 30 years, but there was a lack of momentum for urban projects for decades and no serious plans ever seemed to emerge. That was until the last 10 years, starting in 2002 with the first Downtown development plan by Mayor Coleman and the city. A new version was released in 2010 and contained a dozen projects planned to help Downtown become a destination again. While the Scioto Peninsula was not specifically mentioned, fixing the riverfront was. That’s where Scioto Mile park came from and is now a very popular spot for residents. With all this momentum, the Peninsula needed a serious plan. Right now, meetings are taking place and a development plan is now in the early stages. Some early ideas include a lot of residential, retail and entertainment space, along with a more interactive riverfront and even a transit station for light rail. The first draft of the plan is likely to be released in 2013 and construction could begin as early as 2014.
This project can be found in the Columbus Development links page, which provides a large and regularly-updated list of ongoing and proposed development across the area.