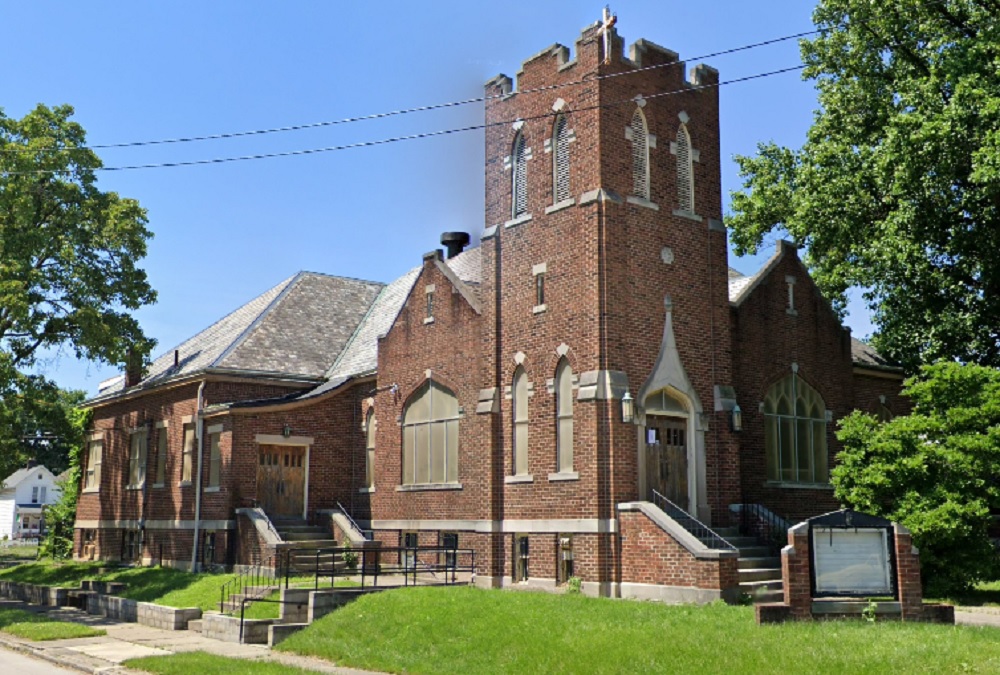
The former Washington Avenue United Methodist Church in 2019.
Columbus historic church demolition is a tricky subject, but has happened far more times over the years than people might believe. The Washington Avenue United Methodist Church at 359 East Markison Avenue has been part of the community since its dedication in 1923. While neither the oldest church in the city, nor the most elaborate, it has its own charms that would be lost to history should it fall to the wrecking ball.
It stopped functioning as a church at the beginning of 2015, perhaps part of the national decline in church attendance. Because of that relatively recent closure, the building remains in relatively good condition.
Churches used to just be torn down after their congregation abandoned them, but in recent years, they have found new life. They have become unique restaurants or retail shops, but the most popular conversion has been residential. Whether one of faith or not, churches offer a kind of architecture not found in any other building type.
Beyond adaptive reuse, however, is the issue of historic preservation. As mentioned, many such buildings have ended up rotting away before they are eventually demolished, and that scenario has played out many times in Columbus. This phenomenon is unfortunately not just part of our past. It continues to happen even now. Recently, a Franklinton church’s demolition was approved for new housing. Unlike the Washington Avenue building, this church had seen long-term abandonment and neglect by its owners. It’s poor overall condition from that neglect was then used to justify its demolition. It survived the 1913 flood when many surrounding buildings didn’t, but it won’t survive the Columbus building boom or intentional neglect.
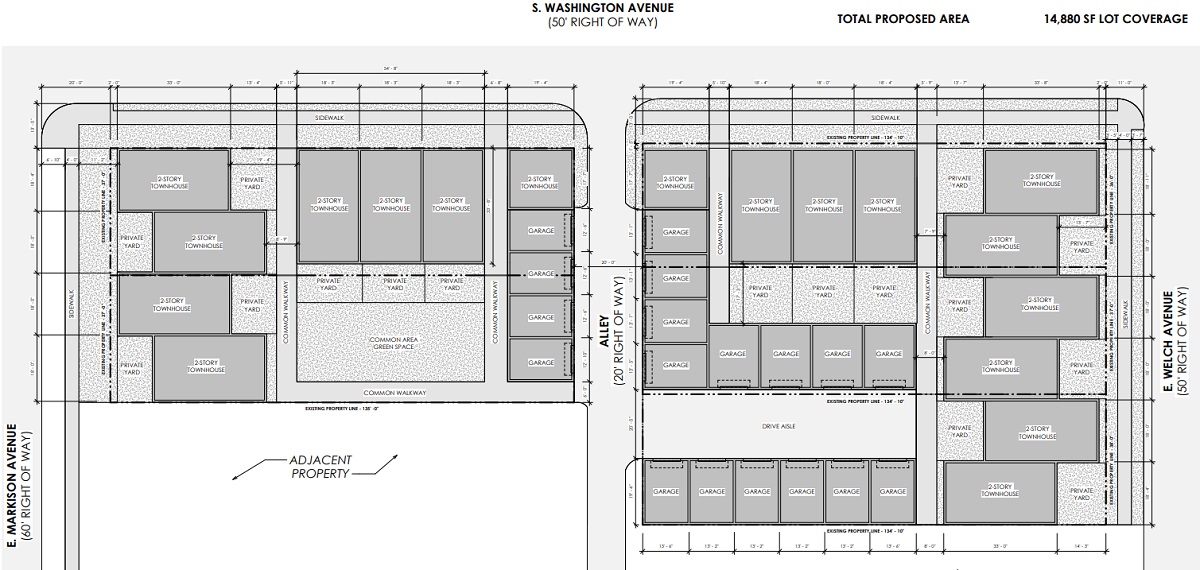
Sadly, it looks like the same fate is in store for the Washington Avenue United Methodist Church. A company called Bexley Manning 569 Holdings has proposed demolishing all but the church’s steeple tower in order to construct 17 townhomes. Columbus is in the midst of one of the largest housing crunches in its history, so the city desperately needs more homes. Sacrificing yet another beautiful old building still seems wrong, though. Columbus has already lost so much of its architectural history to the wrecking ball.
The original site plan for the Markison project.
The project is still in initial approval phases, so it’s possible the demolition will receive some pushback. The fact that the steeple tower is being preserved is actually a change from the original design. Perhaps more of the church may be saved in subsequent project updates. That said, the location is outside of established historic zones and lacks formal protection. Therefore, it seems likely that the WAUMC is facing its last days.
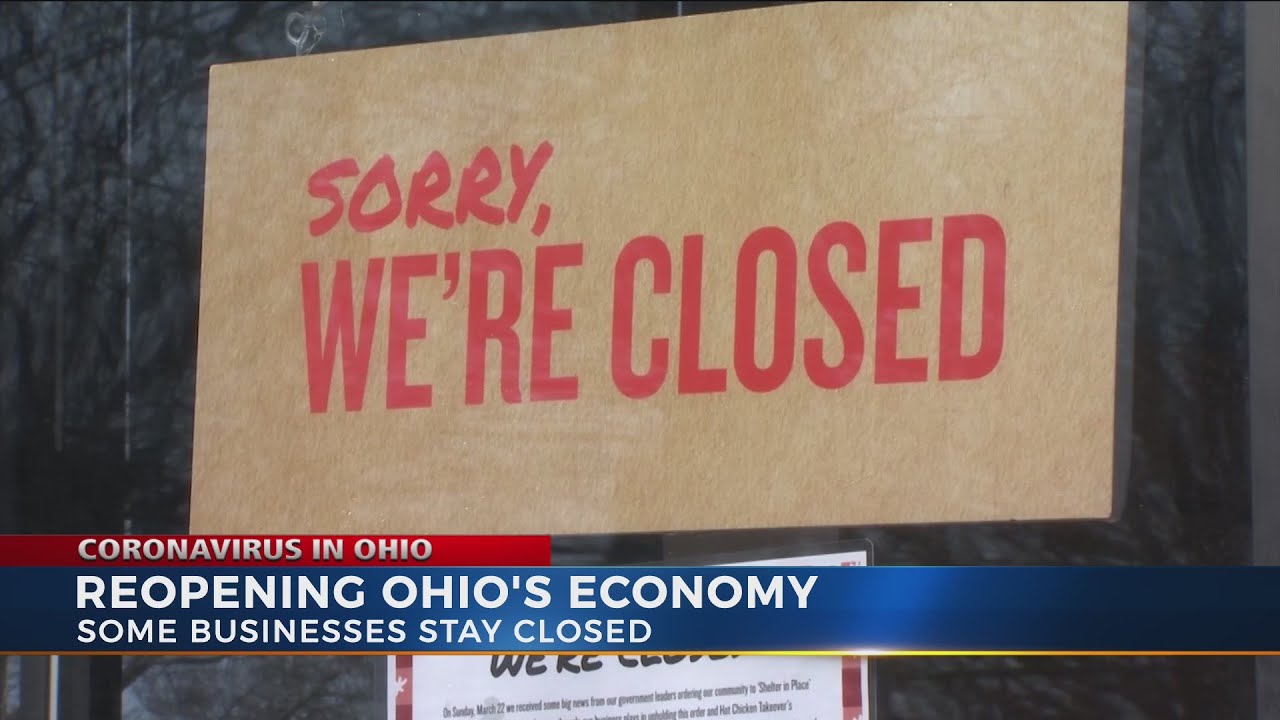
As with everywhere else in the country, Columbus has not gone unscathed by the Covid-19 pandemic and its related economic fallout. Just how bad did the situation get, though, and how was Columbus’ 20202 economic performance overall? Has it recovered since reaching pandemic bottom?
To find out, we’ll look at the latest economic data ending in January 2021.
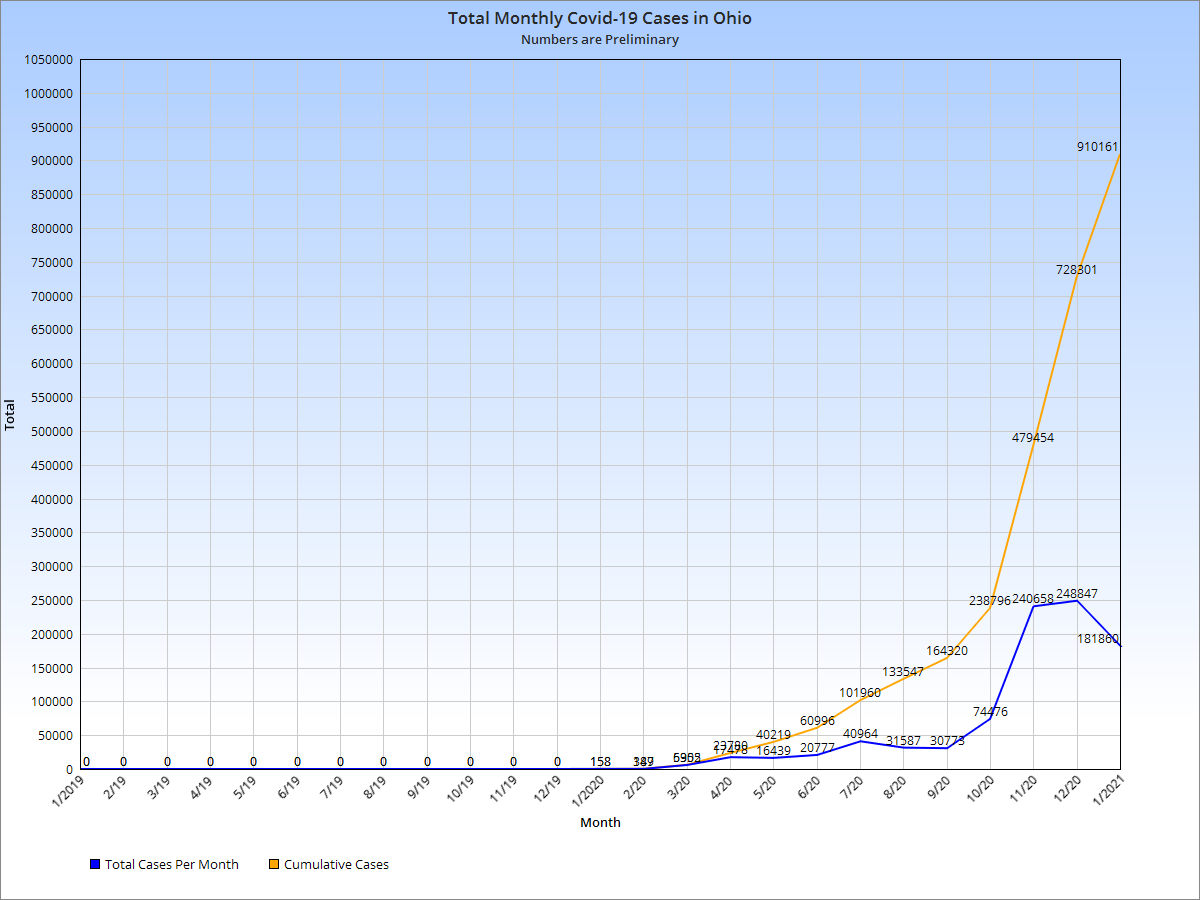
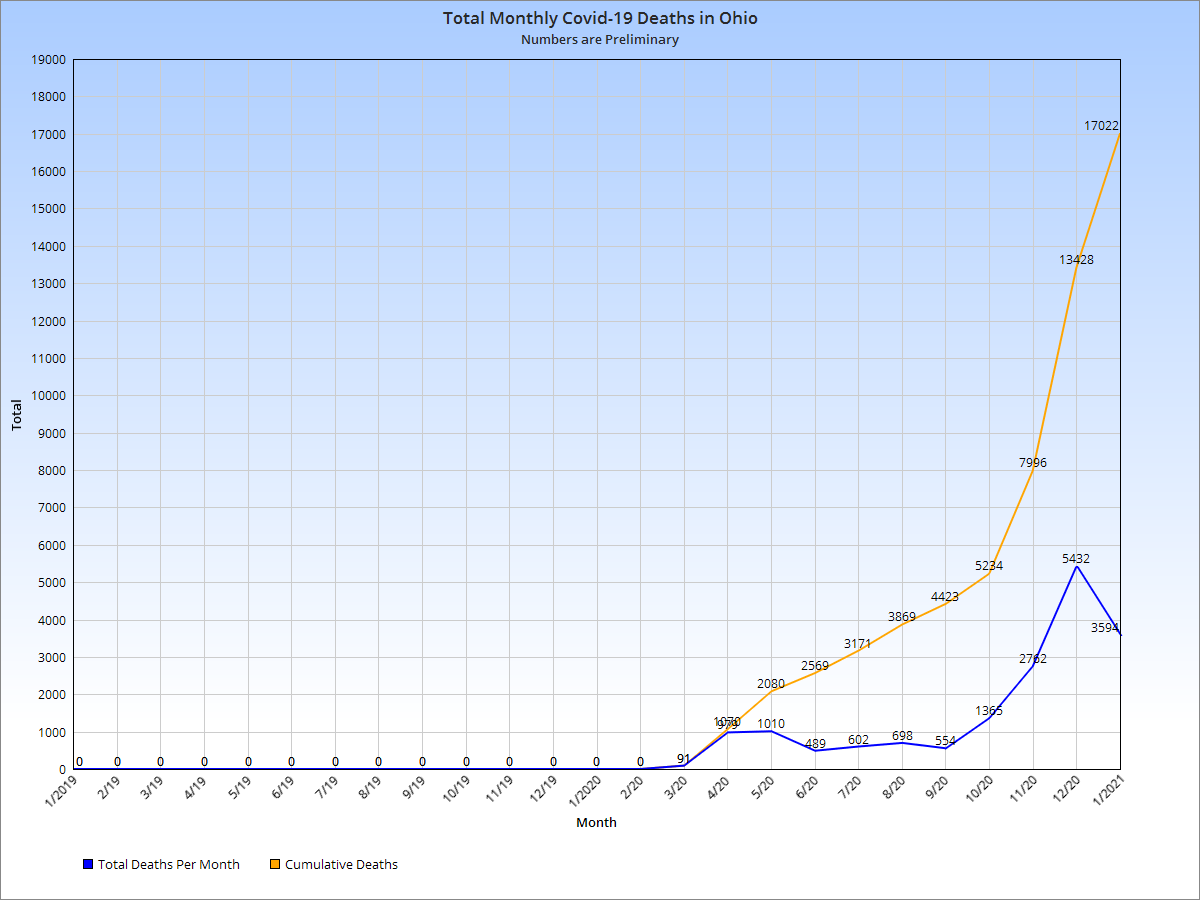
First, here are the historic and current Ohio Covid-19 numbers.
Covid 19 Cases and Deaths in Ohio In Ohio, the pandemic generally began in early January, though Ohio didn’t originally announce any cases until the end of February.
March 2020 marked the official beginning of the pandemic. It was on March 11th, 2020, however, that truly brought out the seriousness of the situation. On that day, multiple news stories all happened simultaneously. The WHO finally declared the situation a pandemic, state and local shutdowns began, Trump gave a national televised address announcing travel bans to Europe, and the stock market had one of its largest drops in history. The pile of bad news would begin affecting the economy almost immediately.
In Ohio, cases and deaths also began to add up quickly in March. As stay-at-home orders were issued and people stopped going out, there were mass layoffs across every industry of the economy.
So how was this all reflected in the economic data?
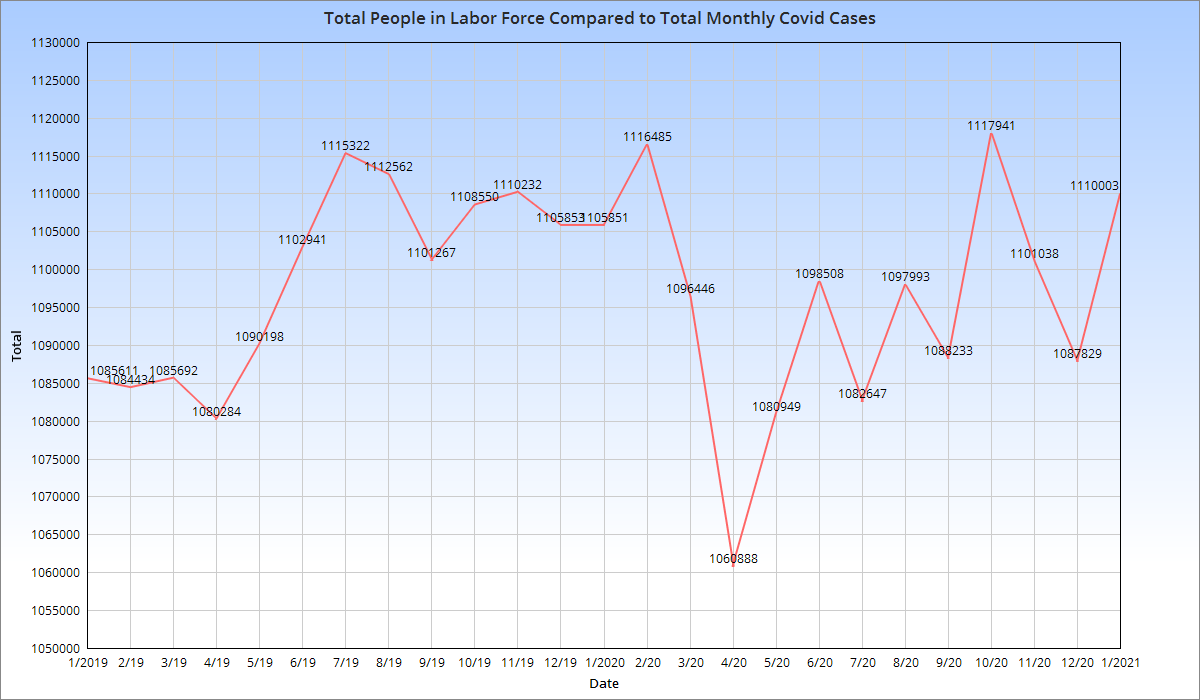
Columbus Metro Labor Force
The metro’s labor force was initially unfazed and reached peak in February 2020, slightly higher than the 2019 peak. However, March lost more than 20,000 from the labor force and April lost almost 36,000 more. The losses were mostly temporary, with a new peak being reached in October. However, the labor forced declined going into the late fall and winter as the 3rd- and worst- wave hit.
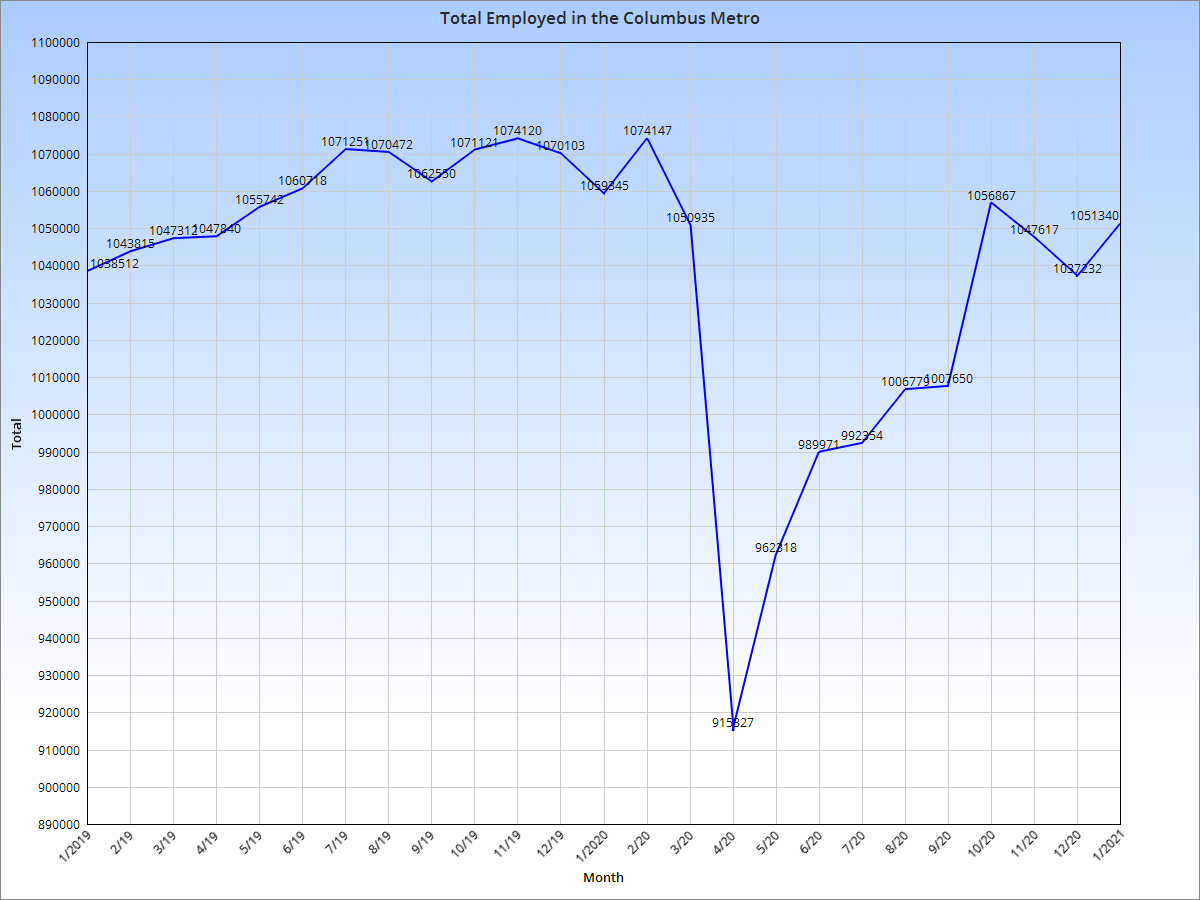
Columbus Metro Total Employed and Unemployed Employed totals were hit far harder than the labor force overall. More than 158K fewer people were employed in April versus February, a nearly 15% drop. Total employed has gone up since the bottom, but was still below the pre-Covid peak through January 2021.
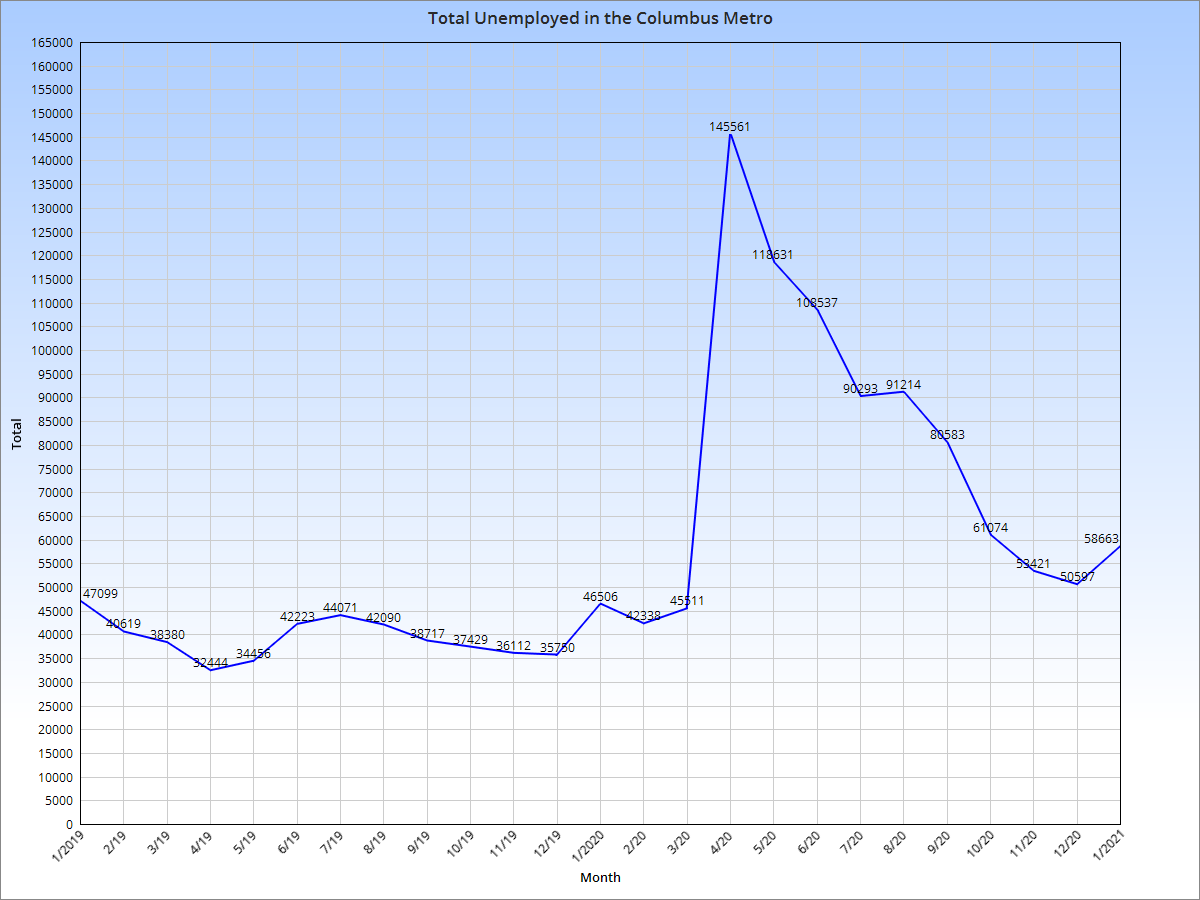
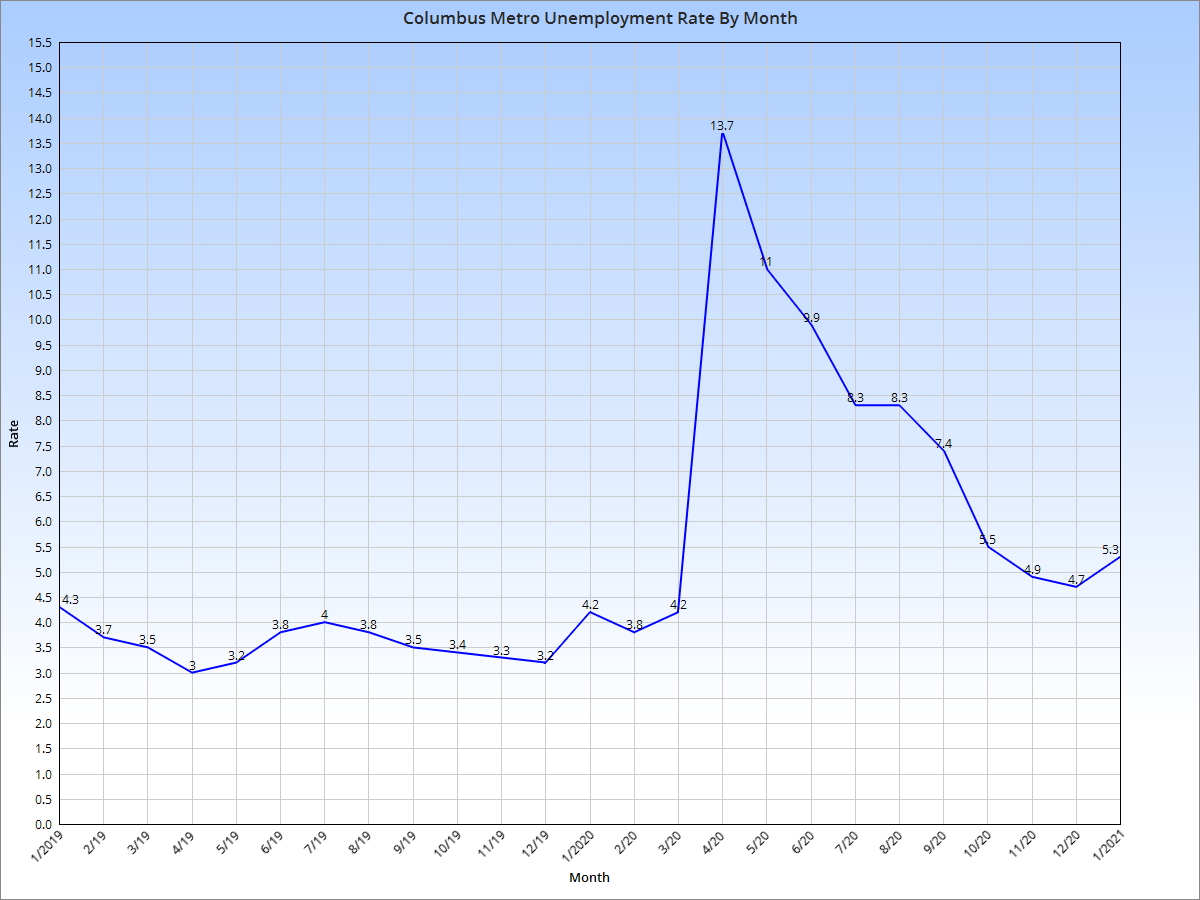
Columbus Metro Unemployment Rate The 13% unemployment in April was one of the highest outside of the Great Depression and nearly 4 points higher than the 2009-2010 recession. Unemployment fell through the end of 2020, but remained higher that pre-Covid levels. Columbus’ unemployment rate was a full point below the national average in January, a sign of its continuing economic resilience even during some of the worst economic conditions in generations.
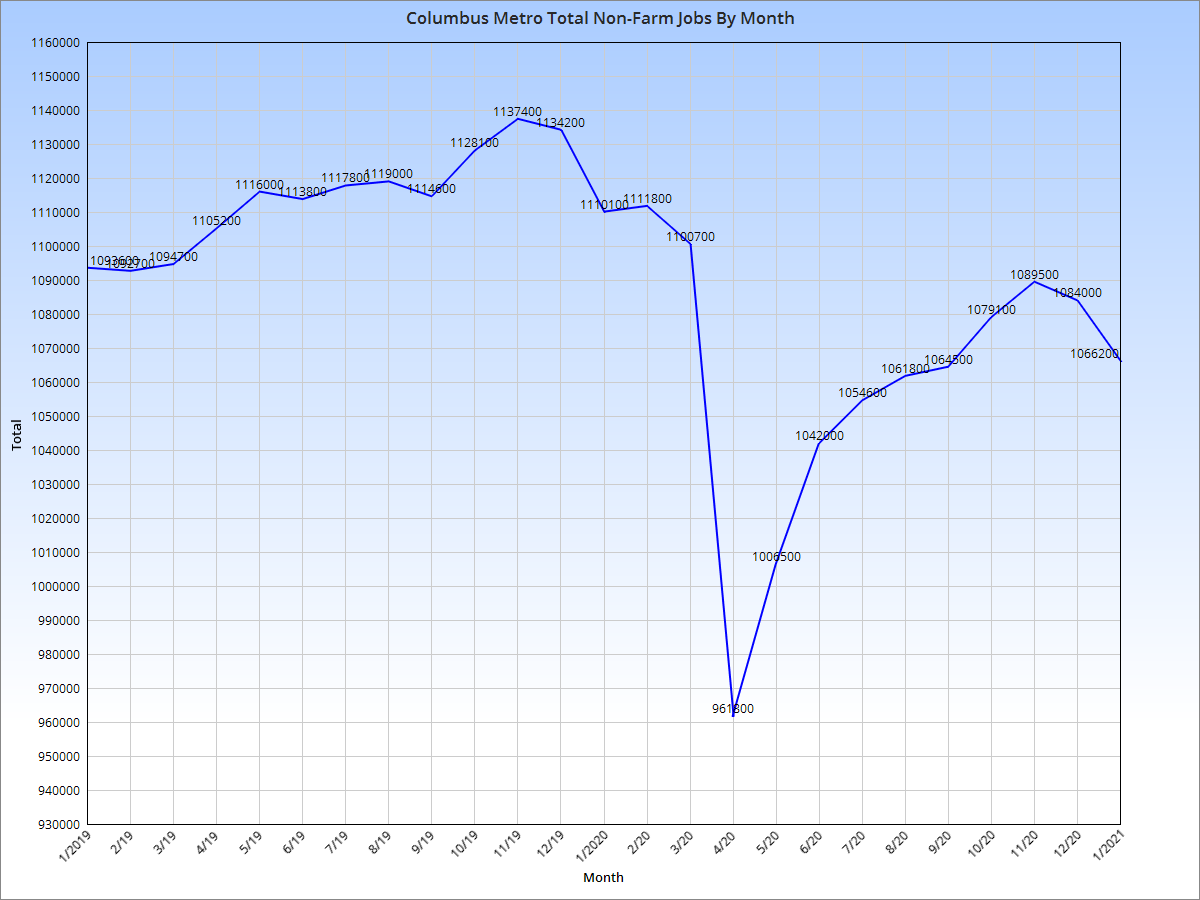
Columbus Metro Non-Farm Jobs Non-farm jobs in the metro area had peaked in November 2019 and had been declining even before the pandemic set in. Between February and April, 2020, 150,000 non-farm jobs were lost in the metro. As of January 2021, the metro was still short about 71,000 from the 2019 peak.
Now let’s take a closer look at how individual industries have performed.
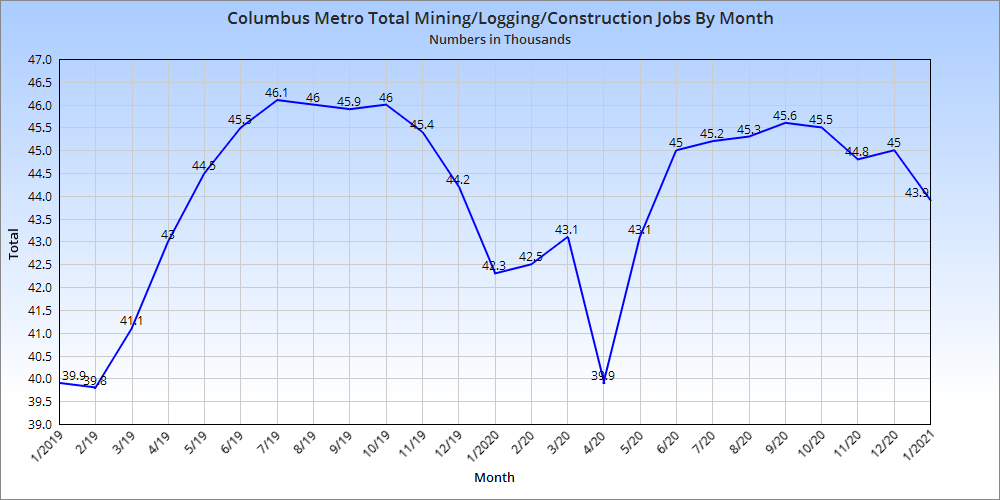
Columbus Jobs by Industry While the mining/logging/construction group did manage to get close to pre-Covid levels, it has been in general decline since last September, likely due to the 3rd wave that began in October.
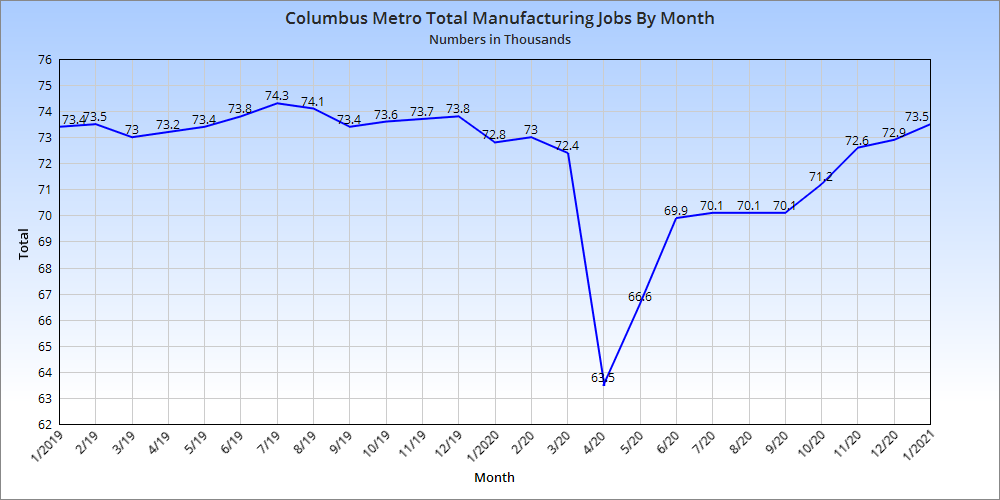
Manufacturing, surprisingly, has recovered completely, and jobs in the industry continued to rise through the 3rd wave.
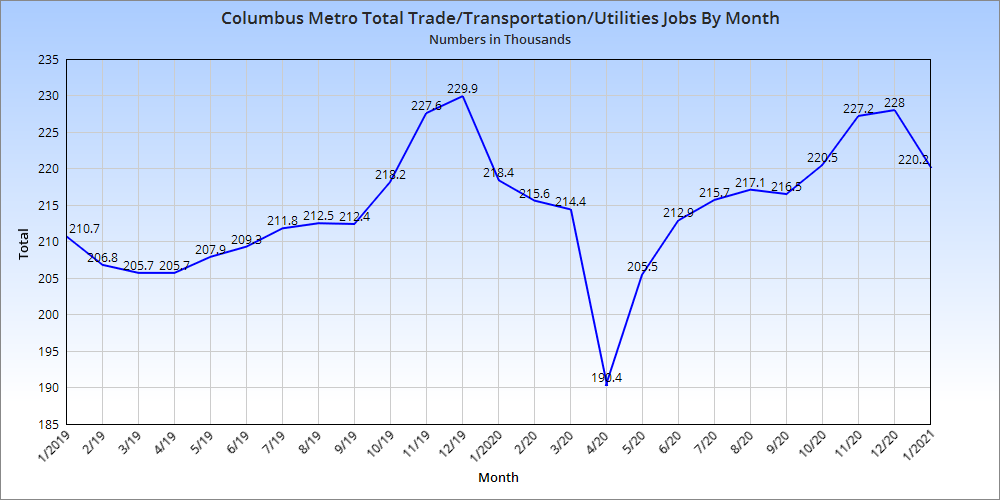
This industry group has also recovered fairly well, being close to where it was pre-Covid.
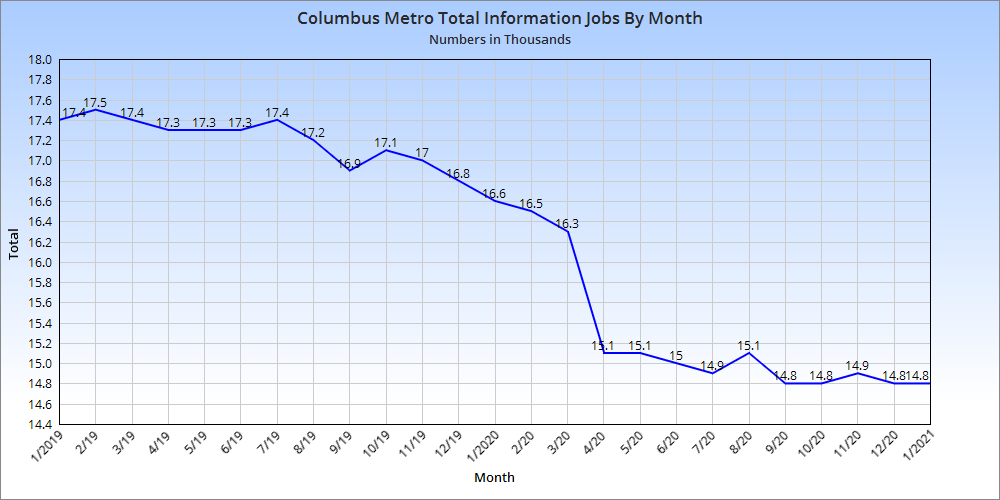
Information jobs were already in a long-term decline before the pandemic, but still faced a steep drop during the spring. Those lost jobs have not come back.
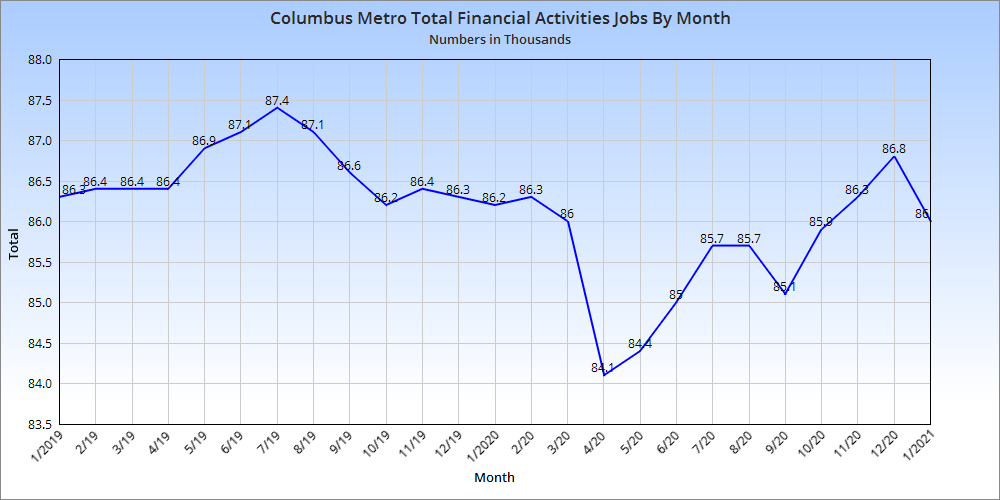
Financial activities jobs did not seem to face a significant decline, and have mostly recovered.
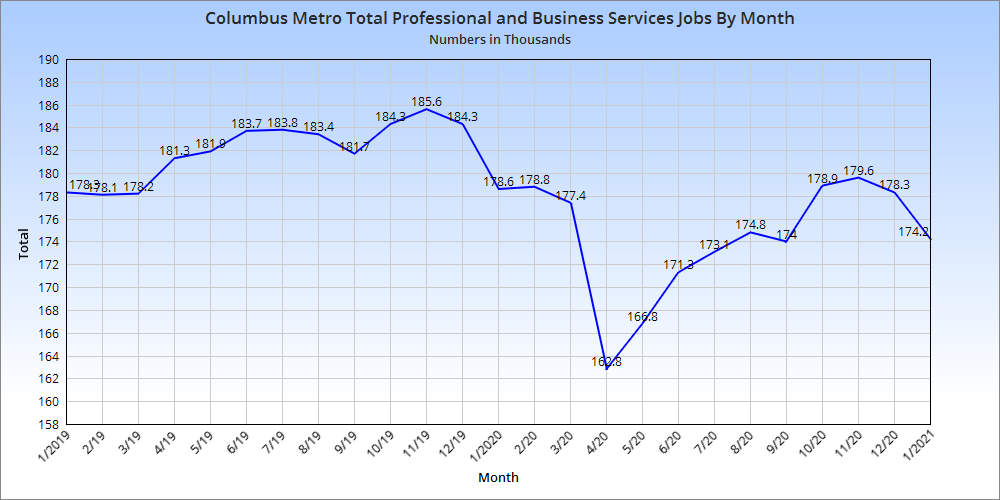
Professional and business services jobs were hit relatively hard during the economic collapse, and have only managed to recover about half of the losses through January.
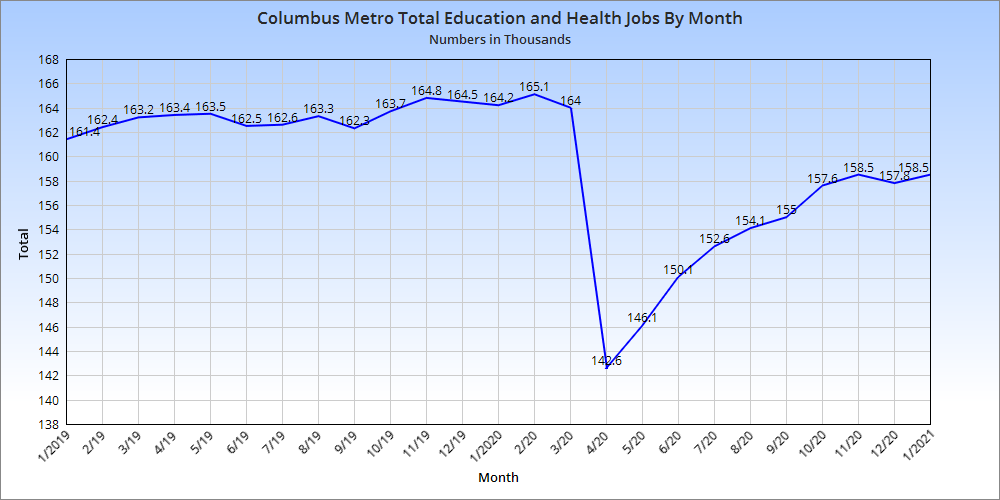
Another hard-hit industry group, the majority of the losses in the Health/Education group probably stem from the education side given that in-person schools have been mostly shut down the past year. Still, the industry group had recovered about 2/3rds of the losses through January.
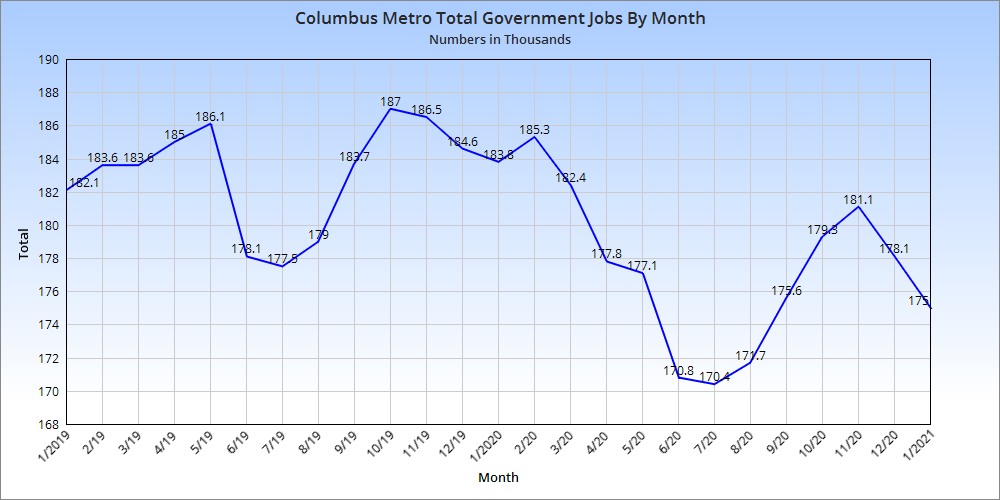
Government jobs typically see a significant mid-year drop, but it was much more severe in 2020. This category has not yet recovered fully.
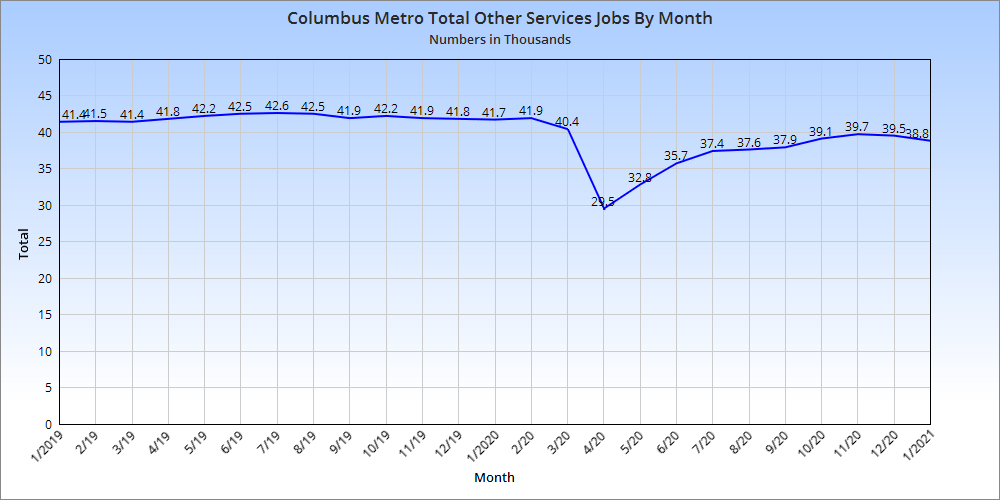
Other services jobs are typically pretty steady year over year and don’t see large changes. Obviously they did during the downturn, however. They have mostly recovered, although seemingly at a readjusted lower level.
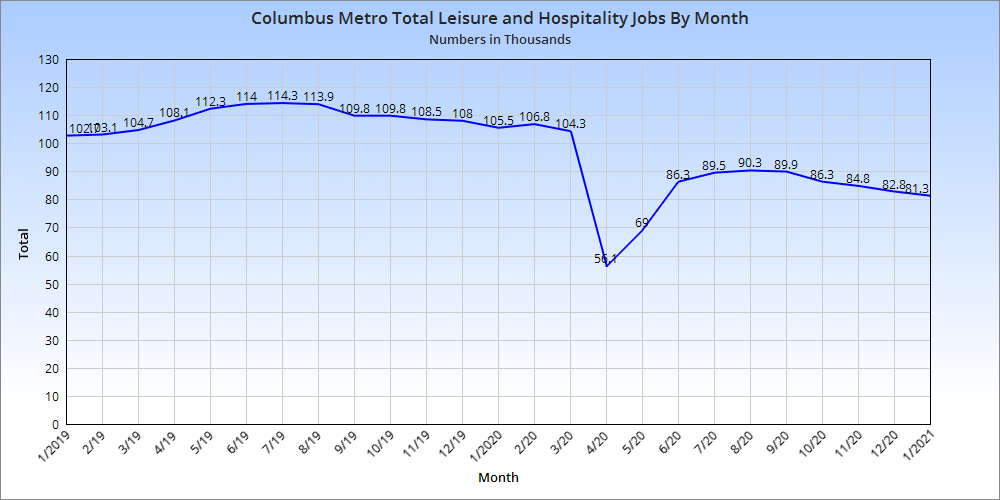
The leisure and hospitality industry was absolutely devastated, losing nearly 50% of all jobs. It has recovered some, but January still featured the fewest jobs in the industry since February 2003.
The Conclusion So as we can see, recovery for some industries is *far* better than others. Service industries have done much worse overall and continue to be below pre-Covid levels. This is not really all that surprising when restaurants, bars and other entertainment spots have faced the brunt of hardship. It remains to be seen how everything from economic stimulus packages to vaccination rates affect 2021, but it’s hard to imagine anything worse than last year.
I updated the Columbus Crime Statistics page with 2019 data, which is the latest year available. The data comes from what the city reported to the FBI’s Uniform Crime Reporting system.
2019 Violent Crime -There were 5,350 incidents of violent crime in Columbus in 2019, down slightly from 2018’s 5,365. The rate per 100K people was 595.4, down from 2018’s 601.0. -There is some discrepancy between the murders the city reported to the FBI- 81- and the total number of homicides it reported in its 2019 year-end report- 104. At 81 murders, it would be a rate of 9 per 100K, while 104 would be a rate of 11.6 per 100K. Even at 104, it would represent a drop from 2018’s 109. -There were 882 reported rapes, down from 2018’s 894. There were 98.2 rapes per 100K, down from 2018’s 99.9. -Robberies continued their years-long decline, with 1,810 total and a rate of 201.4 per 100K. Robberies have declined 53% since 2007. -There were 1,788 aggravated assaults at a rate of 199.0 per 100K. Assaults were higher than 2018’s 1,615, but they are still down nearly 35% since they peaked in 1990.
Violent Crime Changes By Age Group 2010-2019 0 to 19: -41.2% 20 to 39: -33.9% Unknown Age: -30.8% 40 to 59: +12.8% 60 and Over: +220.9%
Perhaps strangely, Asians, women and older people have seen their crime rates increase. In all 3 cases, the total crimes were relatively low in comparison to other groups, but the changes were significant enough to be noticeable.
2019 Property Crime -There were 29,974 property crimes reported in 2019 for a rate of 3335.6 per 100K, down from 2018’s 3596.3. Property crimes peaked in 2001 with 62,151, but have fallen nearly every year since. The 2019 total was 51.8% lower than in 2001. -Larceny thefts reached 20,606 for a rate of 2293.1 per 100K. This is both down from 2018’s 2427.8 and 46.9% lower than their 2001 peak. -Burglaries continued their dramatic fall in 2019. 5,809 were reported for a rate of 646.5 per 100K. This is down from 6,477 and 724.9 in 2018, and down nearly 62% just since 2010. -There were 3,559 motor vehicle thefts for a rate of 396.1 per 100K in 2019, down from 3,962 and 443.7 in 2018. As with burglaries, motor vehicle thefts are down significantly in recent years, having fallen more than 58% just since 2004.
The March, 2008 Columbus snowstorm was a historic and memorable event that will likely not be surpassed for a very long time, if ever. More than one week prior to the Blizzard of 2008, models had been hinting at a significant storm somewhere in the eastern US. Initially, models took the storm up the East Coast, but as the storm neared, models moved it further and further west and settled upon a track just west/just along the spine of the Appalachians. The track waffled for days, but never strayed far from the Appalachian track. Because the storm was originating near the Gulf of Mexico, models were showing the storm pulling vast amounts of moisture north into cold air over the Ohio Valley. Simply put, the track and conditions were being forecast to be perfect for a significant Ohio snowstorm.
Local forecasters, however, weren’t buying it… at least not at first. Four days before the storm, neither the NWS nor the television forecasters were calling for a significant event. The winter of 2007-08 had brought several storm busts, and none of them seemed ready to buy into another one. So right up to 24-36 hours before the event began, most forecasters were calling for 6″ maximum north and west of the I-71 corridor with a mix along the corridor and mostly rain to the south and east.
At 4AM on March 6th, the National Weather Service issued a Winter Storm Watch for parts of Ohio, including Central Ohio. The Watch called for 5″-10″ northwest of I-71, with lesser amounts along 71 due to a predicted changeover to sleet and freezing rain and far less just to the south and east.
URGENT – WINTER WEATHER MESSAGE NATIONAL WEATHER SERVICE WILMINGTON OH 353 AM EST THU MAR 6 2008
INZ050-058-059-066-073>075-080-KYZ089>095-OHZ026-034-035-042>046- 051>056-060>063-070>072-077-078-061700- /O.NEW.KILN.WS.A.0005.080307T1200Z-080309T0000Z/ WAYNE-FAYETTE IN-UNION IN-FRANKLIN IN-RIPLEY-DEARBORN-OHIO- SWITZERLAND-CARROLL-GALLATIN-BOONE-KENTON-CAMPBELL-OWEN-GRANT- HARDIN-MERCER-AUGLAIZE-DARKE-SHELBY-LOGAN-UNION OH-DELAWARE-MIAMI- CHAMPAIGN-CLARK-MADISON-FRANKLIN OH-LICKING-PREBLE-MONTGOMERY- GREENE-FAYETTE OH-BUTLER-WARREN-CLINTON-HAMILTON-CLERMONT- INCLUDING THE CITIES OF…RICHMOND…CONNERSVILLE…LIBERTY… BROOKVILLE…VERSAILLES…LAWRENCEBURG…RISING SUN…VEVAY… CARROLLTON…WARSAW…BURLINGTON…INDEPENDENCE…ALEXANDRIA… OWENTON…WILLIAMSTOWN…KENTON…CELINA…WAPAKONETA… GREENVILLE…SIDNEY…BELLEFONTAINE…MARYSVILLE…DELAWARE… PIQUA…URBANA…SPRINGFIELD…LONDON…COLUMBUS…NEWARK… EATON…DAYTON…XENIA…WASHINGTON COURT HOUSE…HAMILTON… LEBANON…WILMINGTON…CINCINNATI…MILFORD 353 AM EST THU MAR 6 2008
…WINTER STORM WATCH IN EFFECT FROM FRIDAY MORNING THROUGH SATURDAY EVENING…
THE NATIONAL WEATHER SERVICE IN WILMINGTON HAS ISSUED A WINTER STORM WATCH…WHICH IS IN EFFECT FROM FRIDAY MORNING THROUGH SATURDAY EVENING.
LOW PRESSURE WILL DEVELOP IN THE LOWER MISSISSIPPI VALLEY LATE TONIGHT AND LIFT NORTHEAST INTO THE TENNESSEE AND OHIO VALLEYS FRIDAY AND SATURDAY. SNOW WILL OVERSPREAD THE REGION FROM THE SOUTH ON FRIDAY MORNING. THE SNOW WILL LIKELY MIX WITH OR CHANGE OVER TO SLEET AND FREEZING RAIN FRIDAY AFTERNOON AND EVENING ALONG AND TO THE EAST OF THE INTERSTATE 71 CORRIDOR FROM CINCINNATI TO COLUMBUS. AS COLDER AIR FILTERS BACK INTO THE REGION…ANY MIXED PRECIPITATION WILL CHANGE BACK TO ALL SNOW FRIDAY NIGHT AND CONTINUE INTO SATURDAY. MINOR ICE ACCUMULATIONS ON TREES AND POWER LINES WILL BE POSSIBLE. PRECIPITATION WILL REMAIN MOSTLY ALL SNOW WEST OF THE INTERSTATE 71 CORRIDOR. 5 TO 10 INCHES OF SNOW WILL BE POSSIBLE IN THESE AREAS…WITH LIGHTER AMOUNTS FURTHER EAST WHERE SNOW MIXES WITH FREEZING RAIN AND SLEET.
THE EXACT PATH AND STRENGTH OF THE SYSTEM IS STILL IN QUESTION. IF THE SYSTEM MOVES FARTHER WEST MORE WARM AIR WILL LIFT INTO THE REGION…CAUSING LOWER SNOWFALL TOTALS AND MORE MIXED PRECIPITATION. IF THE SYSTEM SLIDES FARTHER EAST…LESS MIXED PRECIPITATION WOULD OCCUR AND SNOWFALL TOTALS WOULD BE HIGHER.
The Watch above did acknowledge that less mix could lead to higher totals, but nothing to the degree that would eventually fall. By later on the afternoon of the 6th, Watch totals did begin to creep up somewhat to 6″-10″ for the I-71 corridor, but the forecast still called for significant icing.
A Winter Storm Warning was finally issued at 4:30AM on March 7th, just hours before the snow would begin to fall.
OHZ045-046-053>056-062-063-071-072-078-071745- /O.UPG.KILN.WS.A.0005.080307T1200Z-080309T0000Z/ /O.NEW.KILN.WS.W.0006.080307T1700Z-080308T2100Z/ UNION OH-DELAWARE-CLARK-MADISON-FRANKLIN OH-LICKING-GREENE- FAYETTE OH-WARREN-CLINTON-CLERMONT- INCLUDING THE CITIES OF…MARYSVILLE…DELAWARE…SPRINGFIELD… LONDON…COLUMBUS…NEWARK…XENIA…WASHINGTON COURT HOUSE… LEBANON…WILMINGTON…MILFORD 436 AM EST FRI MAR 7 2008
…WINTER STORM WARNING IN EFFECT FROM NOON TODAY TO 4 PM EST SATURDAY…
THE NATIONAL WEATHER SERVICE IN WILMINGTON HAS ISSUED A WINTER STORM WARNING…WHICH IS IN EFFECT FROM NOON TODAY TO 4 PM EST SATURDAY.
LIGHT SNOW WILL OVERSPREAD THE REGION LATE THIS MORNING. THE SNOW WILL BECOME HEAVIER THIS AFTERNOON…AND LAST THROUGH SATURDAY AFTERNOON. FIVE TO SEVEN INCHES OF SNOW IS EXPECTED TONIGHT…WITH AN ADDITIONAL FIVE TO SEVEN INCHES FALLING SATURDAY MORNING. SNOW WILL TAPER OFF AND END SATURDAY AFTERNOON. IN ADDITION…NORTH WINDS AT 20 TO 30 MPH WITH HIGHER GUSTS WILL CAUSE SIGNIFICANT BLOWING AND DRIFTING…AND LIMIT VISIBILITIES TO NEAR ZERO AT TIMES. BY LATE SATURDAY AFTERNOON…A FOOT OR MORE OF SNOW IS EXPECTED WITH DRIFTS OVER TWO FEET.
The Warning abandoned all mention of mixing as models came in colder, and totals were now predicted to be at least a foot in the Columbus area with near blizzard conditions.
My personal account of the storm:
On Thursday, March 6th, I worked a 12-hour day at my store. Customers were talking about forecasts of 4-8″, which in central Ohio is significant in and of itself. We typically get one or two 6″ storms, but rarely up to 8″ and almost never more than that. In fact, in all of Columbus history, there have been less than a dozen snow events that broke double digits. Still, in the talking there were whispers that the storm would be more significant. By Thursday night when I arrived home, I discovered the radar was lit up over the South with a growing area of precipitation heading north. Temperatures had already cooled into the low 30s as a cold front had moved through during the day. Forecasts had changed late in the afternoon, and there were many calls of 6-10″ along I-71 by Sunday.
Friday, March 7th was my day off, and I woke up before 8am in the excitement and inticipation of the impending snow. The radar was showing returns north of the Ohio River then and it was already snowing in Cincinnati. Finally, at 9:05am, flurries began to fall and quickly intensified to a steady, windblown snow. A 9:30, I left the house to go to the store. By the time I reached it, the snow had turned heavy and was accumulating quickly. Visibility had dropped to a 1/4 mile at times and many roads were already snowcovered by the time I reached home.
The snow continued throughout the day and forecasts kept changing. At 3:30PM, the Winter Storm Warning was upgraded to a Blizzard Warning for the entire area until 4PM the following day.
URGENT – WINTER WEATHER MESSAGE NATIONAL WEATHER SERVICE WILMINGTON OH 325 PM EST FRI MAR 7 2008
…EXTREME WINTER WEATHER CONDITIONS EXPECTED THROUGH SATURDAY AFTERNOON…
.A MAJOR WINTER STORM WILL CONTINUE TO AFFECT THE OHIO VALLEY OVERNIGHT INTO SATURDAY. THIS STORM WILL HIT AS A ONE TWO PUNCH. THE INITIAL PUNCH TODAY…FOLLOWED BY A BRIEF LULL IN THE SNOW INTENSITY THIS EVENING…BEFORE PICKING UP IN INTENSITY AGAIN OVERNIGHT WHEN STRONG LOW PRESSURE WILL COMBINE WITH AN UPPER LEVEL DISTURBANCE TO BRING A SECOND ROUND OF HEAVY SNOW TO THE REGION. WINDS WILL GUST UP TO 40 MPH AT TIMES OVERNIGHT…THESE WINDS COMBINED WITH SNOW AND BLOWING SNOW WILL CAUSE EXTREME WINTER WEATHER CONDITIONS.
INZ066-073>075-080-KYZ089>099-OHZ026-043>046-051>056-060>065- 070>073-077>080-082-080430- /O.CAN.KILN.WS.W.0006.000000T0000Z-080308T2100Z/ /O.NEW.KILN.BZ.W.0001.080307T2025Z-080308T2100Z/ FRANKLIN IN-RIPLEY-DEARBORN-OHIO-SWITZERLAND-CARROLL-GALLATIN- BOONE-KENTON-CAMPBELL-OWEN-GRANT-PENDLETON-BRACKEN-ROBERTSON- MASON-HARDIN-SHELBY-LOGAN-UNION OH-DELAWARE-MIAMI-CHAMPAIGN-CLARK- MADISON-FRANKLIN OH-LICKING-PREBLE-MONTGOMERY-GREENE-FAYETTE OH- PICKAWAY-FAIRFIELD-BUTLER-WARREN-CLINTON-ROSS-HAMILTON-CLERMONT- BROWN-HIGHLAND-PIKE- INCLUDING THE CITIES OF…BROOKVILLE…VERSAILLES… LAWRENCEBURG…RISING SUN…VEVAY…CARROLLTON…WARSAW… BURLINGTON…INDEPENDENCE…ALEXANDRIA…OWENTON…WILLIAMSTOWN… FALMOUTH…BROOKSVILLE…MOUNT OLIVET…MAYSVILLE…KENTON… SIDNEY…BELLEFONTAINE…MARYSVILLE…DELAWARE…PIQUA…URBANA… SPRINGFIELD…LONDON…COLUMBUS…NEWARK…EATON…DAYTON… XENIA…WASHINGTON COURT HOUSE…CIRCLEVILLE…LANCASTER… HAMILTON…LEBANON…WILMINGTON…CHILLICOTHE…CINCINNATI… MILFORD…GEORGETOWN…HILLSBORO…PIKETON 325 PM EST FRI MAR 7 2008
…BLIZZARD WARNING IN EFFECT UNTIL 4 PM EST SATURDAY… …WINTER STORM WARNING IS CANCELLED…
THE NATIONAL WEATHER SERVICE IN WILMINGTON HAS ISSUED A BLIZZARD WARNING…WHICH IS IN EFFECT UNTIL 4 PM EST SATURDAY. THE WINTER STORM WARNING HAS BEEN CANCELLED.
A MAJOR WINTER STORM WILL CONTINUE TO AFFECT THE OHIO VALLEY OVERNIGHT INTO SATURDAY. THIS STORM WILL HIT AS A ONE TWO PUNCH. THE INITIAL PUNCH TODAY…FOLLOWED BY A BRIEF LULL IN THE SNOW INTENSITY THIS EVENING…BEFORE PICKING UP IN INTENSITY AGAIN OVERNIGHT WHEN STRONG LOW PRESSURE WILL COMBINE WITH AN UPPER LEVEL DISTURBANCE TO BRING A SECOND ROUND OF HEAVY SNOW TO THE REGION. WINDS WILL GUST UP TO 40 MPH AT TIMES OVERNIGHT. BEFORE THE STORM ENDS SATURDAY AFTERNOON…YOU CAN EXPECT 10 TO 15 INCHES OF ACCUMULATION. THE STRONG WINDS COMBINED WITH SNOW AND BLOWING SNOW WILL CAUSE EXTREME WINTER WEATHER CONDITIONS. THE SNOW AND BLOWING SNOW WILL REDUCE VISIBILITIES TO NEAR ZERO AT TIMES CAUSING WHITEOUT…AND BLIZZARD CONDITIONS.
DO NOT TRAVEL UNLESS ABSOLUTELY NECESSARY. CONDITIONS CAN DETERIORATE RAPIDLY IN BLIZZARD CONDITIONS.
Meanwhile, the snow continued into the evening and overnight hours of the 7th. Although it did lighten somewhat towards midnight, it never completely stopped. By midnight, in any case, 5-7″ had fallen throughout Columbus and central Ohio, which set a daily record.
Saturday, March 8th dawned very wintry. By dawn, no less than 10″ was on the ground and the snow was continuing to fall heavily. Winds were generally sustained near 20mph in the morning and increased during the late morning/early afternoon. Heavy snow and winds combined to create total whiteout conditions at times, and every county along I-71 from Cincinnati to Cleveland went under a level 2 or level 3 snow emergency.
At 11am, I went for a walk in the snow. It was still falling heavily and roads were nearly impassable with deep snow. Cars in some cases were buried in snow.
By 2pm, a break in the snowfall came as the low moved to the east of Ohio. When it moved into New York, wraparound snow moved back into the area for 3-4 more hours before ending by 6:30pm Saturday afternoon. The sun even poked through the clouds as it set, producing a very picturesque and beautiful winter scene. A fitting end to the day.
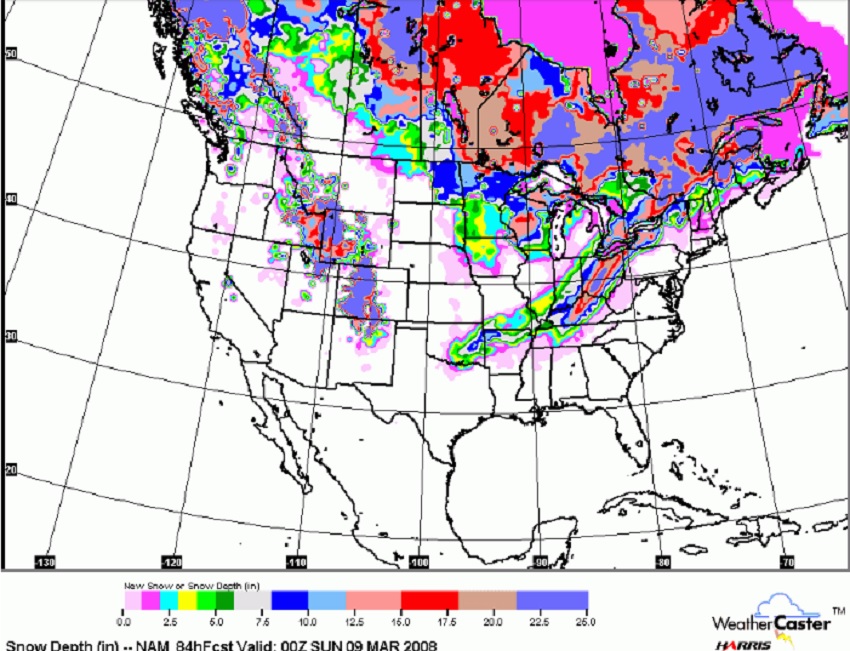
All in all, it was a record setting snowstorm all across the state. Columbus’ 20.5″ of snowfall, including 15.5″ on Saturday alone, was the greatest snowstorm of all time for the city. It also established the greatest 24-hour snowfall and the greatest snow depth ever recorded for any month at 18″. No part of the state was spared, as all major cities except Toledo had 10″ or more. Drifts of 5-7 feet deep were reported in many areas.
Aside from Columbus’ record, here were some other totals across Ohio. Cincinnati: 10.7″ Dayton: 15.4″ Lancaster: 17.0″ Akron: 17.1″ Marysville: 15.5″ Chillicothe: 14.0″ Westerville: 15.0″ Grove City: 11.3″ London: 17.0″ Cleveland: 14.8″ Delaware: 13.5″ Springfield: 15.0″ Belletontaine: 11.0″ Circleville: 13.5″
The storm also brought some areas of the state to record territory in total seasonal snowfall.
Incidentally, 30 years and 2 months prior, the Great Blizzard of 1978 struck. It is somewhat of note that Ohio’s greatest blizzards on record occurred during the “8” years. 1918, 1978, and now 2008.
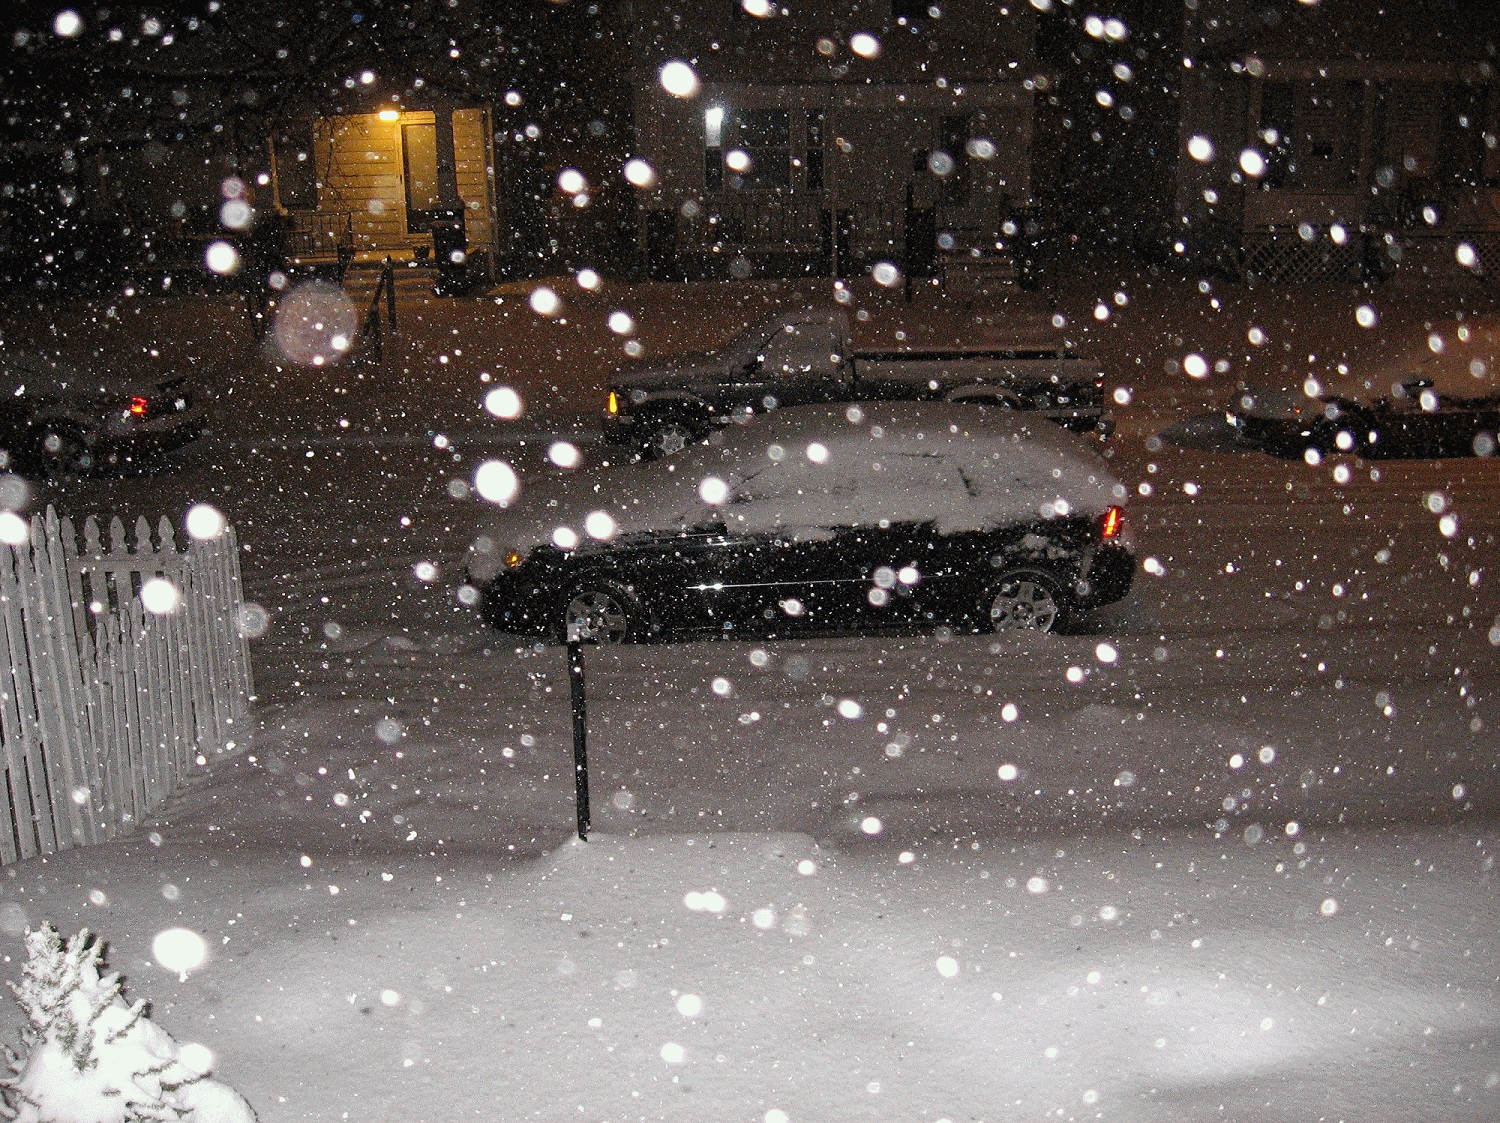
The first image below is a model snow depth forecast ending on March 9th. The second is a photo of the heavy snow in Columbus during the evening of the 7th.
Snow in Hilltop, Columbus.
Here are some videos during the storm. Cincinnati
Cleveland
Columbus
Historic winter storms from other months and years, along with many more records, can be found under Weather History And to look up current weather and local forecasts go here: Wilmington National Weather Service
The Columbus area housing market update January 2021 report is now available! Let’s be honest, the current housing market is extremely tough to navigate right now. This is true not so much for sellers, but rather buyers who are finding it nearly impossible to find a home they like at a good price in the neighborhood they want. There are relatively few homes available on the market, and those that are tend to get tangled in bidding wars that ultimately jack up the average sales price for the whole area.
The cause of this boils down to one critical problem- supply. There just aren’t enough existing homes to meet demand, nor are there nearly enough new homes being built. NIMBYism, local zoning and more issues are generally preventing increased home density in and around Columbus, keeping many potential homebuyers- and renters- struggling to find a place to live.
I haven’t done a breakdown of the Columbus real estate market in some time. Because of the current situation, I thought it would be a good time to take a fresh look.
The data below is from the January market report, the latest one available.
First, let’s look at those local areas that had the most homes for sale.
# of New Listings By County, January 2021 Franklin: 1,291 Delaware: 187 Licking: 157 Fairfield: 129 Union: 64 Pickaway: 47 Madison: 28 Morrow: 27 Perry: 20 Hocking: 16 Perhaps unsurprisingly, Franklin County has the most new listing by far.
Change of New Listings by County January 2020 vs. January 2021 Morrow: +8.0% Fairfield: -5.8% Licking: -6.5% Franklin: -6.6% Union: -7.2% Perry: -13.0% Madison: -20.0% Pickaway: -23.0% Delaware: -31.0% Hocking: -42.9% New listings were generally down across all but one metro county, a continuing story even before the pandemic.
Average Sales Price by County in January 2021 Delaware: $430,684 Union: $312,742 Fairfield: $265,821 Pickaway: $256,235 Franklin: $253,852 Licking: $234,116 Morrow: $232,393 Madison: $231,396 Perry: $219,053 Hocking: $208,231 All counties saw the average sale price of homes sold exceed the $200K mark, but Delaware County remains the most expensive place to buy a home in the metro.
Change in Average Sales Price by County January 2020 vs. January 2021 Perry: +53.7% Pickaway: +36.4% Fairfield: +25.9 Delaware: +23.5% Franklin: +13.4% Union: +12.0% Madison: +9.6% Licking: +9.0% Morrow: +8.9% Hocking: -7.6% All but Hocking County saw significant year-over-year sales price increases of homes sold.
Now let’s take a look at individual communities. Which ones were the hottest in January 2021?
Local Communities/Areas by New Listings in January 2021 1. Columbus (Overall): 850 2. Columbus City School District (CSD): 579 3. South-Western CSD: 173 4. Olentangy Local School District (LSD) (Delaware): 95 5. Hilliard CSD: 92 6. Westerville CSD: 86 7. Grove City: 77 8. Dublin CSD: 68 9. Pickerington LSD: 59 10. Groveport Madison LSD (Franklin): 56 11. Worthington CSD: 51 12. Gahanna Jefferson CSD: 50 13. Newark CSD: 42 14. Lancaster CSD: 41 15. Delaware CSD: 40 16. Upper Arlington CSD: 40 17. Pataskala: 37 18. Beechwold/Clintonville: 35 19. Gahanna: 35 20. Westerville: 35 21. Hilliard: 35 22. Blacklick: 34 23. Marysville School District: 33 24. Reynoldsburg CSD: 32 25. Dublin: 31 26. Teays Valley LSD (Pickaway): 30 27. Downtown Columbus: 29 28. Pickerington: 27 29. New Albany Plain LSD: 24 30. Short North: 24 31. Big Walnut LSD (Franklin): 22 32. Powell: 22 33. Canal Winchester CSD: 19 34. London CSD: 15 35. German Village: 15 36. New Albany: 14 37. Hamilton LSD (Franklin): 14 38. Buckeye Valley LSD (Delaware: 13 39. Bexley: 11 40. Worthington: 11 41. Granville CSD: 11 42. Obetz: 8 43. Johnstown-Monroe LSD (Licking): 8 44. Circleville CSD: 7 45. Grandview Heights: 7 46. Sunbury: 7 47. Whitehall: 6 48. Jonathan Alder LSD (Madison): 6 49. Jefferson LSD (Madison: 5 50. Minverva Park: 2 51. Valleyview: 1 52. Lithopolis: 0 It’s pretty clear that the number of new listings falls off dramatically outside of Columbus proper. Only a handful of suburban areas had more than 50.
Average Sales Price January 2021, # of Homes Sold and % Change vs. January 2020 1. New Albany: $788,943: 14: +8.4% 2. New Albany Plain LSD: $669,455: 20: +10.2% 3. German Village $637,550: 10: +2.3% 4. Olentangy LSD $494,911: 96: +23.0% 5. Powell: $493,087: 11: +19.2% 6. Granville CSD: $492,045: 6: +31.3% 7. Dublin: $468,902: 37: +17.5% 8. Upper Arlington CSD: $462,594: 26: -9.2% 9. Bexley: $438,288: 13: -17.6% 10. Grandview Heights: $437,010: 6: +8.5% 11. Buckeye Valley LSD: $403,616: 20: +40.9% 12. Downtown: $384,230: 22: -36.4% 13. Dublin CSD: $378,788: 78: +11.8% 14. Johnstown-Monroe LSD: $375,598: 12: +110.8% 15. Short North: $360,830: 10: -8.7% 16. Jonathan Alder LSD: $340,887: 15: +20.7% 17. Big Walnut LSD: $337,550: 14: -8.8% 18. Gahanna Jefferson CSD: $335,621: 34: +19.7% 19. Blacklick: $325,445: 32: +39.7% 20. Sunbury: $318,980: 5: +39.1% 21. Pickerington LSD: $318,093: 40: +28.6% 22. Worthington: $316,625: 8: +7.0% 23. Teays Valley LSD: $315,316: 21: +52.5% 24. Beechwold/Clintonville: $300,780: 43: +15.4% 25. Hilliard: $297,387: 25: +0.9% 26. Worthington CSD: $294,236: 40: +17.5% 27. Pickerington: $282,044: 18: +13.0% 28. Westerville: $279,126: $279,126: -0.9% 29. Hilliard CSD: $277,377: 92: +5.9% 30. Canal Winchester CSD: $276,299: 17: +21.7% 31. Grove City: $272,378: 47: +17.8% 32. Minerva Park: $269,580: 5: +21.2% 33. Westerville CSD: $265,781: 68: -3.3% 34. Obetz: $260,825: 6: +26.4% 35. Gahanna: $255,650: 16: -2.1% 36. Marysville CSD: $254,363: 32: +17.8% 37. Hamilton LSD: $245,750: 4: +85.8% 38. Delaware CSD: $245,526: 31: +21.8% 39. Pataskala: $237,293: 18: +26.8% 40. Lithopolis: $228,125: 4: -1.4% 41. South-Western CSD: $227,266: 131: +17.9% 42. Columbus: $222,124: 761: +17.0% 43. Columbus CSD: $215,256: 507: +20.2% 44. Jefferson LSD: $210,225: 4: -35.5% 45. Reynoldsburg CSD: $203,965: 34: +9.0% 46. Lancaster CSD: $203,095: 44: +37.5% 47. Groveport Madison LSD: $194,690: 43: +30.3% 48. London CSD: $190,733: 14: +43.8% 49. Circleville CSD: $183,546: 13: +5.3% 50. Whitehall: $165,361: 11: +68.6% 51. Newark CSD: $143,241: 51: +15.9% 52. Valleyview: $120,000: 1: N/A As stated above, most areas in the metro are priced above $200,000 for a house. Columbus overall is still one of the least expensive options. New Albany is really in a league all its own. It should be noted that many of these average price figures are based on relatively few sales. Because available inventory is so low, the average sales price is being pushed higher. However, it is certainly possible to find homes lower- and in some cases, much lower- than the average price. This is especially true in Columbus.
Finally, let’s look at how long for-sale homes actually stay on the market.
Average # of Days Listings Remain on the Market Until Sale, and % Change January 2020 to January 2021 1. Valleyview: 1: N/A No sales occurred in January 2020. 2. Gahanna: 9: -74.3% 3. Groveport Madison LSD: 9: -69.0% 4. Hamilton LSD: 9: -50.0% 5. Worthington: 9: -72.7% 6. Reynoldsburg CSD: 10: -68.8% 7. Obetz: 12: -71.4% 8. Hilliard: 13: -61.8% 9. Worthington CSD: 13: -56.7% 10. Circleville CSD: 14: -76.3% 11. Lithopolis: 14: -61.1% 12. Marysville CSD: 14: -63.2% 13. Minerva Park: 14: +133.3% 14. Pataskala: 14: -46.2% 15. New Albany: 15: -88.9% 16. New Albany Plain LSD: 15: -83.9% 17. Pickerington: 15: -71.7% 18. South-Western CSD: 15: -34.8% 19. Teays Valley LSD: 15: -58.3% 20. Canal Winchester CSD: 17: -73.0% 21. Whitehall: 17: -46.9% 22. Hilliard CSD: 18: -48.6% 23. Lancaster CSD: 18: -52.6% 24. Westerville CSD: 18: -47.1% 25. Delaware CSD: 19: -51.3% 26. Grove City: 19: -36.7% 27. Beechwold/Clintonville: 20: -53.5% 28. Columbus: 21: -30.0% 29. Westerville: 21: -27.6% 30. Newark CSD: 22: -31.3% 31. Pickerington LSD: 22: -45.0% 32. Dublin: 26: -55.9% 33. Buckeye Valley LSD: 27: -44.9% 34. Columbus CSD: 27: -18.2% 35. Dublin CSD: 27: -41.3% 36. Jefferson LSD: 27: -46.0% 37. London CSD: 27: -32.5% 38. Blacklick: 28: -12.5% 39. Grandview Heights: 28: -37.8% 40. Gahanna Jefferson CSD: 29: -23.7% 41. Johnstown Monroe LSD: 29: -12.1% 42. Sunbury: 29: +222.2% 43. Jonathan Alder LSD: 35: -10.3% 44. Short North: 35: -47.8% 45. Big Walnut LSD: 37: -54.3% 46. Bexley: 44: -18.5% 47. Upper Arlington CSD: 46: -17.9% 48. Olentangy LSD: 49: -16.9% 49. Powell: 52: -8.8% 50. Granville CSD: 54: -15.6% 51. German Village: 56: -38.5% 52. Downtown: 96: +242.9% Only 2 places in the metro saw an increase, with the big one being Downtown. This was most likely due to a few factors- last year’s protests and the pandemic reducing demand close to Downtown jobs. I would expect it to recover somewhat this year and certainly next year. Overall, though, most places saw significant drops in how long homes lasted on the market. Given that these are averages, we know that there were plenty of instances of homes flying off the market in just a few days.
Furthermore, the actual inventory on the market is 30 days or less. This means that if no more homes became available for sale, all the homes on the market would sell out in less than a month. In many cases, the supply would run out in just a few weeks.
Certainly, all these numbers indicate that Columbus itself is still one of the best options for home buying given its lower costs and greater supply, but even there, homes are selling in just a few weeks on average. There’s really been no better time to sell in a long time, but also no worse time to buy. Hopefully, this data provides at least a little insight into the local market and where one might fight the greatest advantages in finding a home. My recommendation is to use every available resource- from realtors to social media- to aid in the search.